Interventional Radiology has evolved to encompass periprocedural and inpatient care of critically ill patients. Acute hypotension and shock can occur in IR patients due to various causes including hemorrhage, sepsis, myocardial infarction, and pulmonary embolism; therefore, the ability to accurately evaluate acutely deteriorating patients must become a part of the IR skillset. Goal-directed sonographic examination of the heart and inferior vena cava provides rapid bedside assessment of anatomic and functional parameters that can be used to determine the etiology underlying a patient’s shock. Targets of evaluation include ventricular systolic function/size/thickness, presence of pericardial effusion and tamponade physiology, intravascular volume status, and existence of other structural pathology such as valvular disease and intracardiac masses. Presented is a primer on performing a systematic focused cardiac ultrasound examination for patients experiencing acute hypotension.
Introduction
Although echocardiography has been performed by cardiologists for decades to evaluate cardiac anatomy and function, the recent proliferation of point-of-care ultrasound has allowed practitioners across many patient care settings including the operating room, emergency department, inpatient floor, and periprocedural areas to perform bedside cardiac examinations in real time, particularly for patients experiencing unexplained hemodynamic deterioration. Goal-directed protocols such as Focused Assessed Transthoracic Echocardiography (FATE), Rapid Ultrasound in Shock (RUSH), and Focused Cardiac Ultrasound (FoCUS or FCU) have been developed to allow rapid identification of cardiovascular conditions at the root of a patient’s acute hypotension and shock.
Interventional Radiologists can benefit from becoming proficient with this “modern stethoscope” as we increasingly encounter patients with severe comorbidities or high presenting acuity. For example, a patient may unexpectedly deteriorate in the intraprocedural setting and bedside cardiac ultrasound can be used to identify acute myocardial infarction or guide emergent therapy such as intravenous fluid and vasopressor administration. A patient may present in extremis from hemorrhagic shock, and the consulting IR can use cardiac ultrasound to assess severity of hypovolemia to guide resuscitation efforts and triage appropriate procedural vs operative treatment. Although cardiac ultrasound has not traditionally been included in the IR training curriculum, a strong foundation in radiology should allow IRs to quickly incorporate this skill into their practice. Here, we present a primer on performing a systematic FoCUS exam, including technical considerations, protocolized image and data acquisition, and interpretation of findings, with emphasis on identification of common pathologies that may cause acute hypotension and circulatory shock.
Clinical role of FoCUS
Cardiac ultrasound can be used in patients presenting with acute hypotension, arrhythmia, cardiac arrest, chest pain, and syncope to assess for an underlying etiology. Common pathologies that can be diagnosed with FoCUS include ischemic left/right ventricular dysfunction, mechanical postmyocardial infarction (MI) complications, cardiomyopathies (eg, dilated, hypertrophic, and stress variants), myocarditis, valvulopathies, cardiac tamponade, pulmonary embolism, and hypovolemia.
Of the listed presentations, acute hypotension is most pertinent to IRs in the consultative and periprocedural settings. This is a particularly challenging condition, as a variety of etiologies with different pathophysiology can lead to the same presentation. Persistent or unexplained acute hypotension can be associated with circulatory shock, defined as inadequate oxygen delivery and/or impaired oxygen utilization leading to decreased tissue perfusion and organ dysfunction. The etiologies of hypotension and shock can be grouped into 4 main categories, each with characteristic pathophysiologic mechanisms that negatively impact cardiac preload, afterload, and/or contractility, ultimately lead to impaired organ perfusion ( Table 1 ). Identifying the category and etiology of a patient’s shock is of utmost importance, as treatment requires reversal of hemodynamic derangements that are unique to the patient.
| Category of Shock | Underlying Etiologies | Underlying Pathophysiology |
|---|---|---|
| Hypovolemic | Hemorrhage, intravascular fluid loss | Decreased blood volume returning to the right heart (preload) → decreased LV filling and output |
| Distributive | Sepsis, anaphylaxis, neurogenic, adrenal | Peripheral vasodilation (low SVR) → “pooling” of blood in the periphery eventually leading to decreased preload → decreased LV filling and output |
| Cardiogenic | Arrhythmia, MI, cardiomyopathy, valve dysfunction, dynamic LVOTO | Decreased cardiac contractility → decreased output |
| Obstructive | ||
| Increased pulmonary vascular resistance | Massive PE, pulmonary HTN | High RV afterload → poor RV output and high RV distension with bowing into the LV → poor LV filling → low output |
| Extrinsic mechanical compression | Pericardial tamponade, tension pneumothorax, abdominal compartment syndrome, restrictive cardiomyopathy, constrictive pericarditis | High biventricular afterload → poor biventricular filling → low output |
This is where FoCUS can play a critical role – through anatomic and functional analysis, FoCUS can quickly and accurately identify derangements in cardiac preload, afterload, and contractility and signs of the inciting pathologic process. For example, myocardial infarction can cause regional wall motion abnormalities and impaired ventricular contractility that can be identified qualitatively on FoCUS, and the degree of resultant output impairment can also be quantified as a depressed stroke volume on ultrasound. The interpretation of these targets of FoCUS imaging will be discussed subsequently in detail.
Image acquisition
Probe selection and positioning
Typically, a phased-array or “sector” probe is used for cardiac ultrasound. These probes have small footprints and low frequency transduction (∼1-5 MHz) to allow imaging of deep structures through narrow anatomic windows such as intercostal spaces. Two imaging modes are utilized:
- –
B-mode: basic anatomic evaluation, eg, ventricular size, pericardial effusion
- –
M-mode: change in position of a single anatomic structure over the course of the cardiac cycle as an indication of contractile ability or lumen collapse, eg, ventricular squeeze or IVC collapse
Imaging views
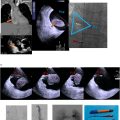
There are 6 views that are obtained with a typical bedside FoCUS exam – 5 views of the heart and one of the intrahepatic inferior vena cava (IVC). There are standardized protocols for obtaining these views, but there is wide variation in anatomy and quality of imaging windows between patients, and optimizing imaging may require slight repositioning or angulation from the standard positions. Traditionally, the imaging screen is oriented with indicator on screen right, so careful attention should be paid to correctly orienting the indicator side of the probe on the patient. Standard probe positioning to acquire views and typical anatomic and functional information obtained in each view are summarized in Table 2 and Fig. 1 . Anatomic diagrams and example ultrasound images of the standard views are also displayed in Fig. 2 .
| View | Technique | Information |
|---|---|---|
| Parasternal Long axis (PLAX) | Probe at left 4th intercostal space, just lateral to the sternum with indicator directed towards the right shoulder. The transducer is rotated so that the beam plane is oriented orthogonal to the anatomic coronal plane, in between axial and sagittal anatomic planes. | Provides excellent anatomic and functional imaging of the LV in longitudinal axis. The RV is partially visualized and can be assessed for dilation, in addition to the aortic root/LVOT. The pericardium can be assessed for presence of effusion. Coaptation of the AV and MV leaflets should also be seen. |
| Parasternal Short axis (PSAX) | From PLAX position, turn probe 90° clockwise with indicator directed towards the left shoulder. The transducer is rotated so that the beam plane is oriented orthogonal to the anatomic coronal plane, in between axial and sagittal anatomic planes. | “Donut” axial view of the LV and RV allows assessment of ventricular squeeze as well as dilation. This view is performed at 3 axial levels that are obtained by tilting the probe upwards from the same location: mid-papillary (best view of ventricular squeeze and size), mitral valve (gives “fishmouth” appearance view of normal mitral valve leaflets), and aortic valve (the 3 leaflets of the AV form the “Mercedes-Benz” sign, and RA and LA can be visualized but LV is lost at this level). |
| Apical 4-chamber (A4C) | Probe placed at the inframammary fold at the mid-clavicular line, with beam tilted cranially and indicator directed towards the left axilla. The transducer is rotated so that the beam plane is oriented parallel to the anatomic coronal plane. | Longitudinal anatomic and functional imaging of all 4 chambers and ideally the MV and TV, as well as excellent visualization of any pericardial effusion. |
| Apical 5-chamber (A5C) | From A4C position, the probe is flattened further (beam tilted further cranially) to visualize the AV and LVOT. | A cousin of the A4C, obtained with probe in similar position but tilted upwards to include the AV and LVOT. Similar information to A4C, but A5C is primarily used to calculate cardiac output. |
| Subcostal IVC (SIVC) | The probe is placed just to the right of midline and oriented in a parasagittal plane with indicator directed caudally to visualize the intrahepatic IVC in longitudinal view. | Longitudinal view of the intrahepatic IVC as it enters the RA. Used to evaluate for IVC collapse with respiratory variation as an indication of hypovolemia. |


Data acquisition
The FoCUS examination involves systematic evaluation of certain anatomic and physiologic parameters. Targets of evaluation in the setting of acute hypotension include global left ventricular (LV) systolic function, size, and wall thickness; global right ventricular (RV) systolic function, size, and wall thickness; presence of pericardial effusion and tamponade physiology; IVC size and collapsibility as a marker of intravascular volume status; presence of gross valvular abnormalities and outflow obstruction; and existence of any large intracardiac masses. The broad goals of imaging are to identify impairments in systolic cardiovascular performance, gross anatomic lesions that may impair cardiac function (eg, valvular, intracavitary, or myocardial lesions), hemodynamic derangements (eg, fluid overload or hypovolemia), and existence of chronic cardiac disease (eg, chronic heart failure or cardiomyopathy).
LV systolic function, size, and wall thickness
LV systolic function can be assessed qualitatively on the parasternal long axis (PLAX), parasternal short axis (PSAX), apical 4-chamber (A4C), and subcostal 4-chamber (S4C) views. Vigorous wall contraction towards the center of the ventricle and strong anterior mitral valve leaflet motion towards the interventricular septum indicate normal contractility, corresponding to an ejection fraction (EF, percentage of blood filling the ventricle at the end of diastole that is ejected out into the aorta during systole) of 55%-69%. Depressed contractility will appear as sluggish ventricular wall movement with poor squeeze towards the center of the ventricle on any view, while hyperdynamic function appears as near-complete collapse of the ventricular cavity with systole. Mildly reduced contractility indicates EF 45-54%, moderately reduced indicates EF 30-44%, and severely reduced is EF <30%. Any regional wall motion abnormalities should also be noted, as these may indicate remote or acute infarction or cardiomyopathy (eg, Takotsubo). Ejection fraction can also be assessed quantitatively by several methods such as fractional shortening, E-point septal separation, and Simpson (biplane) method; however, these may be time-intensive and difficult to perform accurately for the nonechocardiographic expert. One technique involves calculating the stroke volume (volume of blood ejected from the LV with each cardiac cycle, or end-systolic LV volume subtracted from end-systolic volume). This is obtained by multiplying the diameter of the left ventricular outflow tract (LVOT) measured in PLAX view by the velocity-time integral (VTI). VTI is calculated by an ultrasound machine function after the operator traces one systolic velocity waveform on pulsed-wave Doppler with gate positioned at the LVOT in A4C view ( Fig. 3 ). Normal stroke volume ranges between 60 – 100 ml.

Related posts:
 Intravascular Ultrasound: A Review of Radial and Side Firing IVUS
 Transvenous biopsy of abdominal-pelvic lesions with no safe percutaneous access: How we do it
 Central Venous Recanalization and Right Atrial Thrombectomy Using IVUS
 Transcaval endoleak embolization using intravascular ultrasound: A step-by-step guide
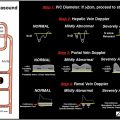 Fluid Status Assessment and the Role of the Venous Excess Ultrasound (VExUS) Score
 Vascular Ultrasound
Stay updated, free articles. Join our Telegram channel

Full access? Get Clinical Tree


