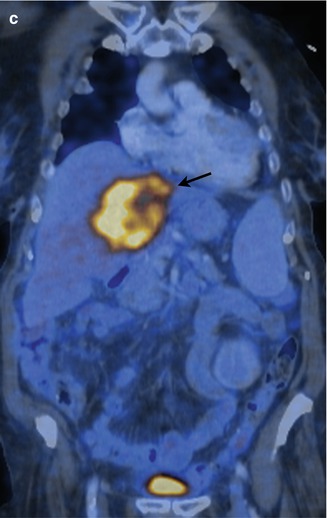
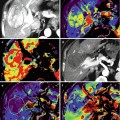
Fig. 43.1
(a) Metabolic image from a PET/CT study in coronal plane shows intense radiotracer uptake in the RUQ lesion (arrow). Note eccentric hypometabolic area reflecting the presence of necrosis. (b) Corresponding CT image shows mass-forming hypoattenuating CHC causing biliary dilatation (arrow). (c) Fusion image confirms FDG-avid lesion with central necrosis (arrow) and associated biliary obstruction consistent with mass-forming-type CHC
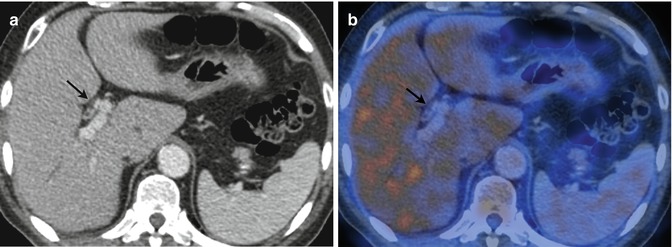
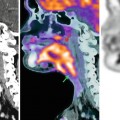
Fig. 43.2
(a) Axial contrast-enhanced CT image shows relatively uniform wall thickening of central biliary ducts with resulting luminal narrowing (arrow). (b) Fusion PET/CT shows no radiotracer uptake in the thickened wall lesion (arrow) in a patient proved to have CHC of the periductal infiltrating type. PET may fail to demonstrate lesions such as CHC because of small size or superficial spread
Both intrahepatic and extrahepatic CHCs of the mucinous type are often missed by PET due to low cellular density. There is a well-known potential for false positive in cases of inflammatory conditions that may mimic CHC, especially the hilar type both clinically and on anatomic-based imaging. A particular area of interest is the screening of patients in the setting of PSC since these patients have an increased risk to develop CHC albeit often harbor inflammatory changes due to the intrinsic nature of the disease or infection derived from chronic biliary stasis. Morphologic imaging has considerable difficulties in detection of CHC complicating PSC, but metabolic imaging with PET has proved effective in this task although a potential for false positive remains [22].
Caution should be exercised in interpreting PET studies of patients who have undergone biliary drainage procedures or stent placement since these devices may result in false-positive tracer uptake along their tracts.
PET role in local staging is limited due to low spatial resolution, and detection of metastatic lymph nodes is difficult with reported sensitivity between 13 and 50 % but high specificity for PET/CT (96 %). Furthermore, other conditions that may mimic CHC both clinically and on imaging may also display noncancerous lymph node enlargement, and concomitant inflammatory conditions may result in reactive lymphadenomegalies with FDG uptake.
As in other cancers, the greatest impact of PET is in staging distant spread of disease. This is due to the fact that PET is a whole body imaging modality that allows for detection of abnormal cancer metabolism before structural abnormalities are evident. As a result, PET may show metastatic foci that may be missed or be ambiguous by conventional morphologic imaging, the detection of which may preclude a morbid and extensive surgical approach (Fig. 43.3). Because of that, metabolic imaging with PET may have a significant impact resulting on disease management in up to 20 % of patients [23] and may change surgical management in 30 % [24].
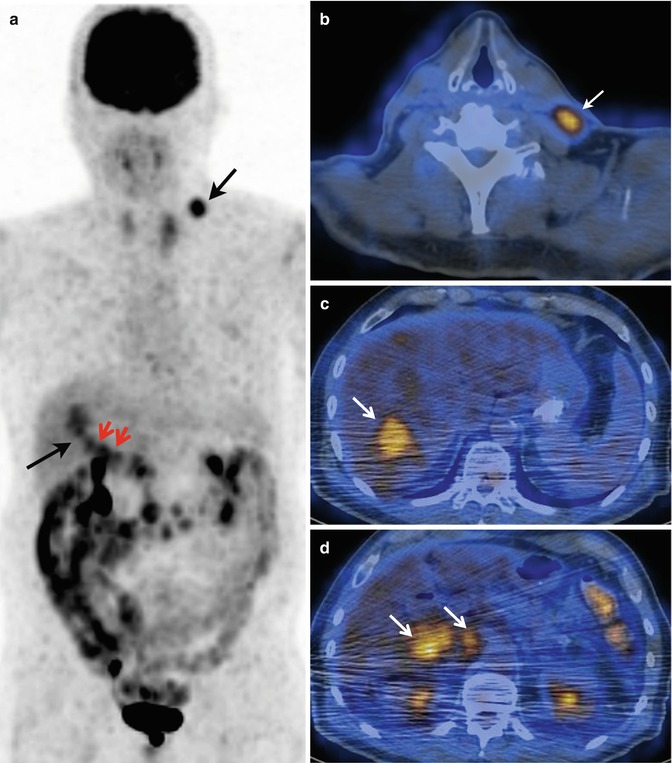
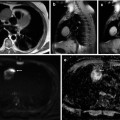
Fig. 43.3
(a) Coronal MIP from a PET/CT study shows hypermetabolic supraclavicular lesion (short arrow) as well as FDG-avid lesions projecting in the liver and representing the primary lesions (long arrow) and lymphadenopathies in the porta hepatis area (short red arrows). (b) Fusion axial image confirms a FDG-avid supraclavicular lymphadenopathy (arrow) indicating distant spread of disease. (c) Fusion axial image demonstrates segment VII location of hypermetabolic lesion (arrow). (d) Fusion axial image shows hilar as well as portacaval hypermetabolic lymphadenopathies (arrows)
Metastatic disease from CHC affects most often the liver and peritoneum, and based on the clinically relevant patient basis for detection of recurrent and metastatic disease, PET/CT reported sensitivity and specificity of 94.5 and 100 %, respectively. PET is also helpful in excluding residual disease in contrast-material-enhanced resection margins.
43.2.1.2 Gallbladder Carcinoma
GBC shares the same diagnostic challenges as CHC, which is an insidious course resulting in a late detection often at an advanced stage of the disease (Fig. 43.4) as well as the occurrence of nontumoral conditions that may simulate cancer on imaging studies such as inflammatory processes, especially xanthogranulomatous cholecystitis. Although few studies have investigated the role of PET for diagnosis, prognosis, staging, and tumor recurrence, this modality is seen as a potential useful technique that may eventually find its proper role in the GBC work-up. In a prospective study that evaluated FDG metabolism with PET, overall diagnostic accuracy was 83.3 % for the diagnosis of the primary lesion, 88.9 % for evaluation of lymph node involvement, and 85.1 % for the evaluation of metastatic disease. Mean SUVmax of malignant lesions was 6.14 and ROC curve showed a cutoff value of 3.56 g/ml in the SUVmax for malignancy. PET changes management in 14.8 % of patients as a result of identification of metastatic disease although proved to be limited in the setting of peritoneal carcinomatosis [25].
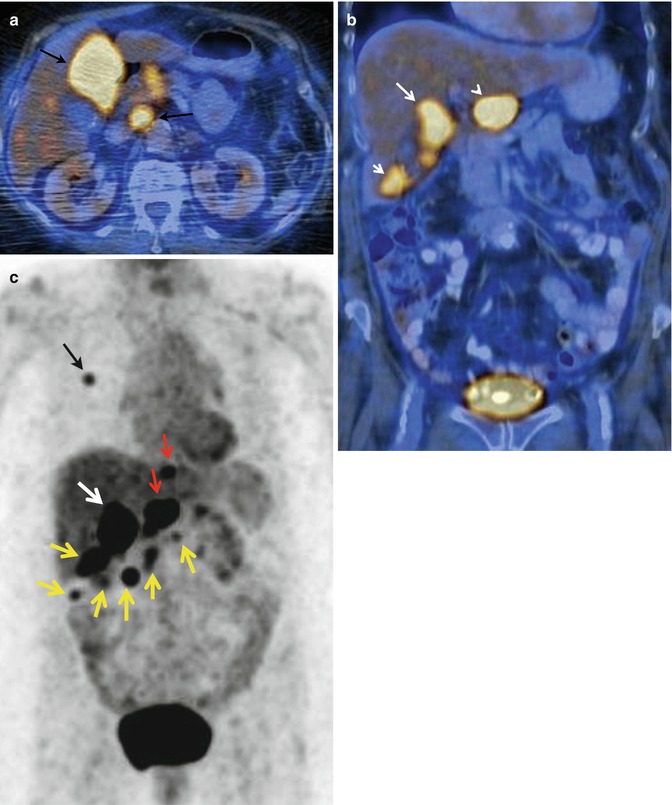
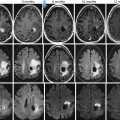
Fig. 43.4
(a) PET/CT axial fusion image shows intense FDG uptake in a mass occupying most of the gallbladder lumen (arrow) in a patient with gallbladder carcinoma and hypermetabolic metastatic portacaval lymphadenopathy (arrow). (b) PET/CT coronal fusion image shows multiple hypermetabolic foci representing the primary GBC (long arrow) as well as peritoneal spread (short arrow) and a conglomerate lymphadenopathy (arrowhead). (c) Coronal MIP from PET/CT of the same patient reveals several areas of abnormal FDG accumulation corresponding to the primary gallbladder mass (white arrow), hilar and cardiophrenic lymphadenopathies (red arrows), as well as peritoneal spread of disease (yellow arrows). A lung metastasis (black arrow) is also noted
Another study that specifically addressed the role of PET in risk stratification of 1–2 cm gallbladder regarding potential surgical management found that various criteria derived from 18F-FDG-PET including visual assessment, SUVmax of the polyp, and, most notably, the ratio of SUVmax of the polyp to SUVmax of the liver were useful in determining the need for surgical intervention and data derived from PET was more effective than other clinical risk factors, except for the age of the patient [26]. Metabolic evaluation with PET/CT has also been found to be useful in detecting recurrent disease as well as metastatic distal involvement with sensitivity of 97.6 % and specificity of 90 %, whereas the positive predictive value, negative predictive value, and accuracy reported were 95.3 , 94.7, and 95.1 %, respectively. Therefore, PET has the potential to detect early recurrent locoregional as well as distant spread in the setting of GBC resulting in ability to allow for an impact on management [27].
43.2.2 Magnetic Resonance Spectroscopy
There has been a recent interest to screen for hepatopancreaticobiliary malignancies by means of obtaining spectral analysis of metabolite profiles in human bile juice. Magnetic resonance spectroscopy (MRS) provides a noninvasive assessment of different metabolites whose normal and abnormal profiles correlate with the expected chemical alterations expressing tumor cell pathways [28].
Albiin et al. investigated the ability of 1H MRS to discriminate CHC from benign biliary conditions by obtaining spectra of sample bile from patients with and without PSC. The reported sensitivity, specificity, and accuracy were 88.9, 87.1, and 87.8 %, respectively [29]. Attempts have been tried to analyze differences in phospholipid metabolism by means of in vitro 1H and phosphorus 31P MRS with a high-field system (11.7 T). Khan et al. evaluated patients with nonmalignant pathologies and with CHC among other malignant hepatopancreaticobiliary malignancies and demonstrated that phosphatidylcholine levels were significantly reduced in the bile from cancer patients compared with those with no malignancy. They concluded that 1H and 31P MRS may be used to detect differences in phospholipid metabolism between these two populations of patients [30].
Other potential molecular target to be investigated by MRS is lactate level whose measurement in bile has been shown to correlate with hepatobiliary malignancies [31].
Wen et al. proposed a NMR-based metabolomic approach to aid in differentiating malignant from nonmalignant biliary tract diseases from bile samples obtained either percutaneously or endoscopically. They produced sensitivity and specificity of 88 and 81 %, respectively, performing better than conventional markers such as CEA, CA19-9, and bile cytology [32].
Although the aforementioned experiences are still far from current practice, they signal significant early attempts to employ novel imaging biomarkers that overcome present limitations of currently used noninvasive screening methods.
Although, at present, in vivo metabolic imaging through MRS is a very difficult task to perform in patients with anatomically demonstrated hepatobiliary masses, continued hardware and software innovations may result in a future useful approach to accomplish noninvasive molecular detection and characterization of tumors.
43.3 Tumor Cellullarity
43.3.1 Diffusion-Weighted Magnetic Resonance
DWI reflects the micro-movements of water molecules. It has been shown to be a sensitive parameter in microscopic tissue characterization. Diffusion-weighted imaging is performed after strong bipolar pulses are added to spin echo or gradient echo sequences, by sensitizing the water in tissue to diffusion [33]. The amount of diffusion is defined using the diffusion coefficient. Diffusion coefficient measurement is affected by capillary perfusion, temperature, magnetic sensitivity of the tissue, and motion. All these variables affect the actual diffusion, and therefore, the term “apparent diffusion coefficient” (ADC) is used rather than “diffusion coefficient.”
The extent of water molecule diffusion ability in a tissue is related to tissue’s cell density and integrity of the cell membranes [34]. The movement of water molecules is more restricted as the cell membrane becomes more intact or if the cell density is higher. The solid portion of the tumor has a higher cell density than normal tissues and exhibits relatively higher signal intensity on DWI.
DWI is inherently T2 weighted. An extra-long T2 relaxation time can also show as continuously higher signal intensity in DWI, which may then be misdiagnosed as restricted diffusion. This is known as the T2 shine-through effect. To avoid this effect, ADC values can be calculated using at least two images obtained under different b values. The ADC map can then be used to overcome the T2 shine-through effect by observing the relative reduction in signal in images obtained under different b


Related posts:

Stay updated, free articles. Join our Telegram channel
Full access? Get Clinical Tree
