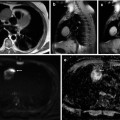
Fig. 36.1
Dynamic contrast-enhanced MRI in a patient with stage III ovarian cancer. Axial T2-weighted image (a) demonstrates bilateral solid adnexal tumours (asterisks) and omental cake (arrow). The K trans map (b) of both primary and metastatic sites visualises prominent heterogeneity in tumour perfusion. Gadolinium concentration-time curve (c) obtained from the left adnexal mass is characterised by steep initial uptake, high amplitude and large area under the enhancement curve (type 3), in keeping with an aggressive histology
36.2.2.2 Diffusion-Weighted Imaging
Quantitative DWI in ovarian disease has been mainly used in the differential diagnosis of complex adnexal masses [28–31]. ADC values have been found significantly lower in mature cystic teratomas due to the ubiquitous presence of keratinoid substance and may improve diagnostic performance in this histological subtype when there is paucity of fat [28, 31]. Endometriomas display lower ADC values due to their high concentration of blood products [29]. Qualitative assessment of hyperintensity within a solid component at high b values (1,000 s/mm2) coupled with intermediate T2 signal intensity has been attributed a 4.5 positive likelihood ratio for malignancy, while combined T2 and b 1000 hypointensity a 100 % NPV [32]. ADC mapping, however, has been found less useful in the differentiation of malignant from benign ovarian masses due to the considerable overlap of mean and lowest ADC values between the two groups [28, 31–33]. This reflects the histological heterogeneity of ovarian neoplasms, as it is thought that high ADC values in malignant lesions arise from desmoplastic stroma, whereas low ADC values in benign masses, such as fibromas, result from compact cellular organisation [32]. A multiparametric approach using an MRI 5-point scoring system comprising morphological (signal intensity, cystic/solid composition, multilocularity, presence of thickened irregular or grouped septa, vegetations, free fluid and peritoneal implants), DWI-derived (signal intensity at b 1000) and DCE-MRI-derived (type of time-signal intensity curve) features [34] achieved an AUROC of 0.94–0.98 for the differentiation of benign from malignant lesions with excellent interobserver agreement (κ > 0.80).
36.2.2.3 Proton Magnetic Resonance Spectroscopy
1H-MRS has been validated sparsely in characterising ovarian masses. As with other tumour types, choline is elevated in ovarian malignancy at the primary and metastatic sites [35], and a choline/creatine ratio greater than 3 may be predictive of malignancy [36]. In a study of 23 ovarian masses, identification of a choline peak demonstrated 89 % sensitivity and 84 % specificity in differentiation of malignant from benign pathology [37]. Iorio et al. examined the individual moieties comprising the total choline resonance and found a significant increase in phosphocholine and total choline levels in cancer compared to normal ovarian cells, as well as a reverse glycerophosphocholine/phosphocholine ratio. These spectroscopic findings were associated with an increased choline phospholipid metabolic turnover, as manifested by increased activity of both biosynthetic and catabolic enzymes, thus providing biochemical validation to the spectral profile [38]. Detection of a lipid peak in one small study had 100 % sensitivity and 94 % specificity in the characterisation of thecomas/fibrothecomas [39], while another showed that N-acetyl resonances at 2.0 ppm had 89 % sensitivity and 86 % specificity in diagnosis of mucinous components, and when seen together with choline, they raised suspicion for ovarian metastases (Krukenberg tumour) [40]. A significantly increased presence of lactate (1.4 ppm, which is an indicator of increased anaerobic activity) in combination with alanine and low glucose is seen in ex vivo studies of fluid from malignant ovarian cysts, indicating the predominance of anaerobic metabolic pathways in the setting of malignancy [41, 42]. The absence of lactate peaks was a powerful predictor of benignity. Intracellular lactate levels and total choline compounds also have been shown to be most prominent in the moderately to poorly differentiated histological types, compared to benign cysts [43].
Results on the spectral pattern of individual histological subtypes have been diverse, with dermoid cysts manifesting high choline concentration in vitro [42] and high lipid concentration in vivo [44]. The unique presence of glycine has been reported in endometriomas, suggesting that this metabolite also could serve as a spectroscopic marker for lesion characterisation [42].
36.2.3 [18F]-Fluorodeoxyglucose Positron Emission Tomography
The role of [18F]-fluorodeoxyglucose positron emission tomography (FDG-PET) in assessing asymptomatic sonographically suspect ovarian lesions is limited due to physiological uptake related to the menstrual cycle. The report of the FDG-PET cancer screening programme in Japan of nearly 44,000 subjects revealed an overall rate of malignancy detection of 1.14 % but did not demonstrate any benefit in the diagnosis of asymptomatic ovarian cancer [45]. Ovarian hypermetabolic activity has been reported in 18.75–20 % of premenopausal women without adnexal disease in the late follicular, ovulatory and early luteal phase or associated with oligomenorrhea, in contrast to postmenopausal women without gynaecological malignancy, who do not demonstrate increased ovarian uptake [46–48]. Physiological FDG uptake has been shown to be significantly lower than tumour activity, with an SUV of 7.9 separating benign from malignant pathology with 57 % sensitivity and 95 % specificity [47]. In a large prospective study of 99 patients with adnexal lesions, FDG-PET had 58 % sensitivity, 76 % specificity, 25 % positive predictive value (PPV) and 93 % negative predictive value (NPV) for the differentiation of benign from malignant histology; integration with MRI and US findings, however, increased diagnostic performance to 92, 85, 46 and 99 %, respectively [49]. False-positive results have been reported in inflammatory processes (abscess, hydrosalpinx), benign tumours (cystadenomas, schwannomas, mature teratomas), endometriomas and corpus luteum cysts, while false-negative findings may arise in cystadenocarcinomas and borderline tumours [49, 50]. A small in vivo study in 17 ovarian masses showed a positive correlation between maximum SUV (SUVmax), immunohistochemical markers of cellular proliferation and glucose metabolism (MIB-1 and GLUT-1 expression, respectively) and histopathological grade, indicating a potential role of FDG-PET as a biomarker of tumour activity [51].
36.3 Functional Imaging for Staging of Ovarian Cancer
Cross-sectional imaging, performed with computed tomography (CT) or magnetic resonance imaging (MRI), is used for routine staging, monitoring treatment outcome and surveillance of ovarian cancer. Traditionally ovarian cancer is staged at laparotomy/laparoscopy according to the TNM or FIGO system (Table 36.1). In preoperative staging the main role of imaging is to identify the cohort of patients with advanced disease, in whom upfront primary surgical debulking is not feasible either due to unfavourable anatomical site or disease volume. These patients will benefit from neoadjuvant chemotherapy followed by delayed primary cytoreductive surgery [52]. Postoperative imaging can confirm surgical outcome, whereby optimal cytoreduction (achieved when individual residual tumour foci do not exceed 1 cm in maximum diameter) has been proven to significantly improve survival [53]. Imaging also is used to detect and localise recurrence in patients with rising CA125 levels in order to assess the feasibility of secondary cytoreductive surgery, which has been associated with a benefit in overall survival [54, 55].
Table 36.1
TNM and International Federation of Gynaecology and Obstetrics (FIGO) classifications for staging ovarian cancer
TNM | FIGO | |
|---|---|---|
T1 | Stage I | Tumour confined to ovaries |
T1a | IA | Tumour confined to one ovary, intact capsule and no tumour on surface, no malignant cells in ascites or peritoneal washings |
T1b | IB | Tumour confined to both ovaries, intact capsules and no tumour on surface, no malignant cells in ascites or peritoneal washings |
T1c | IC | Stage IA or IB with any of the following: ruptured capsule(s), tumour on surface, malignant cells in ascites or peritoneal washings |
T2 | Stage II | Tumour involving one or both ovaries with pelvic extension |
T2a | IIA | Extension and/or implants on uterus and/or fallopian tubes, no malignant cells in ascites or peritoneal washings |
T2b | IIB | Extension to other pelvic tissues, no malignant cells in ascites or peritoneal washings |
T2c | IIC | Stage IIA or IIB with malignant cells in ascites or peritoneal washings |
T3 and/or N1 | Stage III | Tumour involving one or both ovaries with peritoneal metastases outside the pelvis |
T3a | IIIA | Microscopic peritoneal metastases outside the pelvis |
T3b | IIIB | Macroscopic peritoneal metastases outside the pelvis ≤2 cm in greatest diameter |
T3c and/or N1 | IIIC | Macroscopic peritoneal metastases outside the pelvis >2 cm in greatest diameter and/or regional lymphadenopathy |
M1 | Stage IV | Distant metastases |
36.3.1 Contrast-Enhanced Computed Tomography
CT is the standard modality for noninvasive staging and follow-up in ovarian cancer due to its wide availability and reproducibility. Advances in technique, such as use of contrast-enhanced multidetector CT, bowel opacification and multiplanar reformatting, have improved overall sensitivity to 85–93 % in the last decade [56–58]. Nevertheless, CT imaging of peritoneal disease remains challenging; metastatic deposits are often of subcentimetre dimensions, particularly in the setting of treated or relapsed disease, and combined with their low contrast to the normal peritoneal reflections and serosal surfaces, they easily escape detection. The size of peritoneal implants influences CT performance decisively, with sensitivity being decreased to 7–28 % when maximal diameter is less than 1 cm [59, 60]. However, detection of subcentimetre deposits provides vital prognostic information since the presence of residual foci as small as 5 mm is an adverse prognostic factor compared to complete absence of macroscopic residual disease [61]. In addition to size, anatomical distribution critically affects lesion detectability, particularly in the absence of ascites; the right subdiaphragmatic space, omentum, root of mesentery and serosal surface of small bowel frequently harbour occult tumour and are associated with a CT sensitivity of 11–37 % and an only moderate to fair interobserver agreement (κ = 0.35–0.70) [56, 59, 62]. Conventionally, involvement of these sites signifies non-resectability [63]. However, recent studies question the accuracy of imaging criteria for prediction of surgical outcome and highlight the importance of surgeon expertise [64, 65].
36.3.2 MRI
36.3.2.1 DCE-MRI
In a study by the Radiology Diagnostic Oncology Group, the overall sensitivity of gadolinium-enhanced MRI in depicting peritoneal disease was equal to CT (95 and 92 %, respectively), but MRI may be advantageous in the detection of small (<2 cm) implants (although the results did not reach statistical significance due to the limited number of small lesions) [58]. The administration of oral contrast material in order to opacify the gastrointestinal tract improves sensitivity in subcentimetre lesions (72–80 %) and in subphrenic, serosal and mesenteric sites (96 %) [66].
36.3.2.2 DW-MRI
The addition of DWI to conventional T1- and T2-W MRI has been shown to increase the number of depicted peritoneal lesions by 21–29 % due to the improved conspicuity of implants as foci of restricted diffusion in a background of suppressed peritoneal fat (Fig. 36.2) [67]. In preoperative detection of peritoneal carcinomatosis on a per-patient basis conventional MRI, DWI and their combination perform equally; however, on per-site analysis of 255 foci of carcinomatous peritoneal implantation, the combination of DWI and DCE-MRI has been shown to have an accuracy of 84–88 % compared with 52–72 % for MRI alone and 71–81 % for DWI alone [68]. The incremental value of DWI was more pronounced in the mesentery, right subhepatic space, serosa of small bowel and colon and pelvis (surface of uterus and urinary bladder) (Fig. 36.3), whereas conventional MRI was advantageous in the subphrenic spaces due to susceptibility artefact at lung bases in DWI [68]. In another small study, the addition of DWI to gadolinium-enhanced MRI increased the sensitivity, specificity and accuracy of the latter from 58 %, 87 %, 67 %–83 %, 94 % and 86 %, respectively [69]. A b value of 800 s/mm2 reduced false-positive T2 shine-through-related results in mesenteric sites adjacent to fluid-filled intestinal loops [69]. Other similar studies have confirmed the high sensitivity (90 %) and specificity (95 %) in detecting ovarian-related peritoneal dissemination and indicate substantial interobserver agreement (Cohen’s ĸ = 0.77) [70]. However, correlation with anatomical imaging is required in order to avoid false-positive results from inflammatory lesions and tissues with physiologically restricted diffusion (bowel serosa, cycling endometrium) and false-negative results in tumours of relatively free diffusion (necrotic, mucinous) [71].
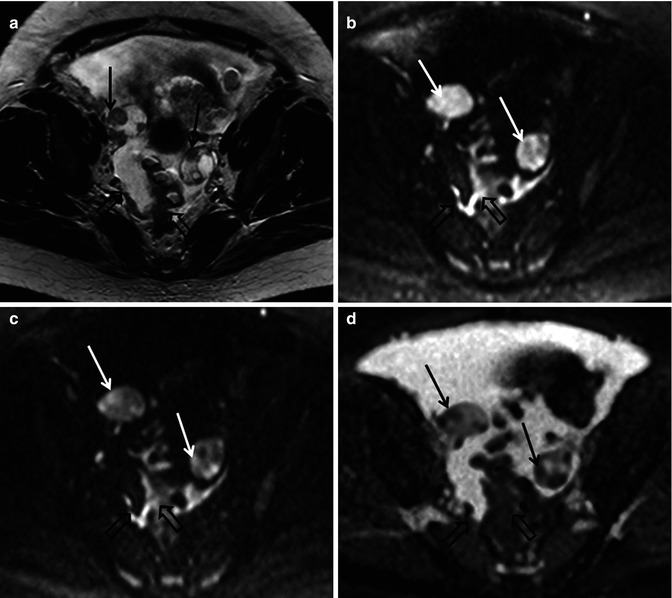
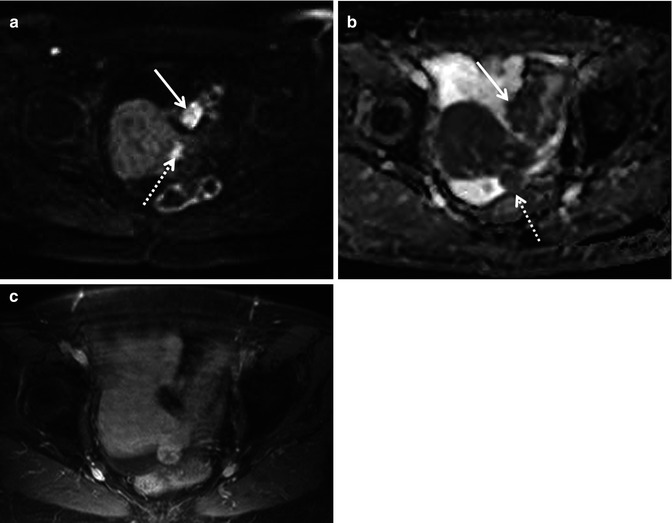
Fig. 36.2
Diffusion-weighted imaging in a 48-year-old female with advanced high-grade serous epithelial ovarian cancer. Axial T2-weighted MR image (a) shows bilateral complex solid-cystic adnexal masses (arrows) and abnormal soft tissue in the right peritoneal reflection and abutting the sigmoid colon (open arrows). Diffusion-weighted images obtained with b values of 600 s/mm2 (b) and 1,050 s/mm2 (c) demonstrate incremental signal loss in the cystic components and signal retention in the solid components (arrows). Peritoneal and serosal disease (open arrows) are rendered more conspicuous in relationship to adjacent tissues and ascites. Corresponding ADC map (d) confirms restricted diffusion in the solid elements of the primary sites (arrows) and in the metastatic infiltrates (open arrows)
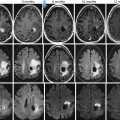
Fig. 36.3
Diffusion-weighted imaging in a 78-year-old woman undergoing staging of primary ovarian cancer. DWI image obtained with b value of 600 s/mm2 (a) demonstrates hyperintense nodules protruding from the left round ligament of the uterus (dotted arrow) and on the serosa of the sigmoid colon (solid arrow), consistent with local extension and peritoneal dissemination, respectively. Corresponding ADC map (b) shows restricted diffusion in tumour foci. On fat-suppressed gadolinium-enhanced T1-weighted MR image (c), the implants cannot be reliably identified amidst the normally enhancing uterus and bowel wall
36.3.3 [18F]-Fluorodeoxyglucose Positron Emission Tomography/Computed Tomography
FDG-PET/CT has been investigated for preoperative prediction of complete resectability. Astrong correlation has been shown in a retrospective study between the Peritoneal Cancer Index (PCI), which is the standard quantitative index of disease load derived from maximum lesion size in each of 13 abdominopelvic segments, obtained with FDG-PET/CT and at surgery (r = 0.95) [72]. Another prospective study in patients with gastrointestinal and ovarian primary malignancy showed a 93 % sensitivity, 96 % specificity, 98 % PPV and 84 % NPV for PET/CT in identifying peritoneal disease per abdominal segment, compared to 87, 92, 97 and 73 % for gadolinium-enhanced MRI, respectively, although the differences were not statistically significant [73]. FDG-PET/CT shows lower detection rates than CT for small lesions of 3–7 mm [74], and sensitivity of FDG-PET/CT may be hampered by lesion site as well as size: implants smaller than 5 mm and located in the small bowel serosa/mesentery were detected at a 75 and 82 % rate, respectively [72]. The sensitivity of PET/CT in delineating subcentimetre peritoneal implants may be improved with multiphase contrast-enhanced CT and bowel preparation (72 % for lesions <5 mm) [72]. However, in four prospective studies, FDG-PET/CT modified disease stage compared with anatomical imaging in 55–64 % of patients by depicting additional sites of disease in the peritoneum, lymph nodes, liver capsule and abdominal wall and altered decisions on clinical management in 34–59 % of patients, with the changes rated as high impact in 44–57 % (Fig. 37.6) [75–78]. FDG-PET/CT also has an important role in the evaluation of lymphadenopathy in ovarian cancer, as it can detect metastases in normal-sized retroperitoneal and pelvic lymph nodes [79].
36.3.4 Comparison of DWI-MRI and PET/CT
Comparison of the diagnostic performance of DWI and PET/CT on a per-patient basis has shown their equivalence (sensitivity, specificity and accuracy were 84, 82 and 83 % for DWI and 84, 83 and 80 % for PET/CT) [80]. Site-based sensitivity also has been shown to be equivalent for both modalities (74 % for DWI and 63 % for PET/CT; P = 0.27), especially for subcentimetre implants (42 and 50 %, respectively), although site-based specificity was preserved (97 % for DWI and 90 % for PET/CT). DWI discovered more sites of involvement than PET/CT in the supramesocolic compartment and especially in the perihepatic region (7/9 vs. 4/9, respectively) [80]. Other studies have mirrored this data (MR-DWI 84 % sensitivity, PET/CT 89 % sensitivity) with PET/CT having the highest PPV (0.93) compared to both combined MRI/DWI and MRI alone (0.72 and 0.70, respectively; P < 0.01) [81].
36.3.4.1 Radioimmunoscintigraphy
In radioimmunoscintigraphy (RIS), monoclonal antibodies labelled with a radiotracer and directed to tumour-expressed antigens can be imaged by conventional gamma cameras and aid in cancer diagnosis and staging. In ovarian cancer, most studies have used site-specific 111In- or 131I-labelled immunoconjugates of fragments of OC125, an antibody against CA125 antigen [82–84]. The reported sensitivity and specificity in small population studies were 80–93 % and 50–75 %, respectively. In a large multicentre study of 111In-labelled B72.3 (an antibody against the commonly expressed in adenocarcinomas antigen TAG-72), per-patient sensitivity was 68 % and specificity 55 %, whereas per-lesion sensitivity was 59 % for tumours <0.5 cm and 81 % for tumours >2 cm [85]. False-positive results may arise from cross-reactions with antibodies present in benign ovarian lesions, thus limiting the value of the technique in tissue characterisation. The use of RIS for diagnosis and staging has declined due to its disadvantages of poor spatial resolution (<8 mm) and lengthy examination process (interval between the infusion of the radiopharmaceutical and imaging >48 h), although a revival of interest in the technique may be anticipated for radioimmunotargeted drug delivery [83].
36.3.5 Near-Infrared Optical Imaging
The unique properties of peritoneal disease (large surface involvement at small depth) are particularly suited for intraoperative or laparoscopic near-infrared (NIR) optical imaging. This technique exploits the refraction of light or emission of fluorescence in order to image subsurface tissue at a depth of approximately 2 mm and with almost cellular-scale resolution (10–20 μm). Specially designed probes are administered in an optically inert state but in the presence of specific proteases that are highly expressed in diseased tissue are cleaved and thus activated, resulting in multifold amplification of the received signal. Preliminary data show promise for the in vivo characterisation of ovarian lesions and improved detection of peritoneal seedings [86, 87]. For the latter goal, fluorescent probes targeting tumour-specific molecules in ovarian cancer, such as folate receptor α, cathepsin B and αVβ3 integrin, are selectively activated in the primary site and metastatic peritoneal foci and augment their conspicuity in the intraoperative setting. In preclinical models the sensitivity and specificity of the technique for implant detection has been reported as 95–100 % and 88–100 %, with a potential for quantification of the fluorescent signal [87, 88]; in human studies the lack of depth visualisation may pose limitations.
36.4 Functional Imaging for Assessment of Treatment Response of Ovarian Cancer
36.4.1 Current Strategies for Evaluation of Response
In the management of ovarian cancer, standard chemotherapeutic regimens rely on platinum and taxanes and remain largely empirical, because current clinicopathological prognostic factors, such as age, FIGO stage, histological grade and surgical outcome, are inadequate to fully address the spectrum of disease heterogeneity. Cancer antigen 125 (CA125), a high-molecular-weight glycoprotein expressed and secreted by ovarian cancer cells in more than 80 % of patients, directly reflects malignant cell burden [89] and is currently the only approved serological biomarker for monitoring therapeutic efficacy [90]. The prognostic value of pre- and posttreatment CA125 levels, however, and intra-treatment CA125 kinetics have not been assimilated into standard clinical practice [91–93]. Prediction of tumour response at the outset or early stages of chemotherapy is desirable as it would lead to individualisation of treatment, timely modifications of therapeutic regimens and avoidance of unnecessary toxicity.
To-date CT is the standard of care in imaging the response of disseminated ovarian cancer to treatment. However, disparities between serological and imaging-based assessment of response are common, since apart from the measurable target lesions appropriate for Response Evaluation Criteria In Solid Tumours (RECIST) [94], a variable proportion of active disease is in the form of microscopic peritoneal implants, which can only be indirectly assessed through CA125 [95]. An integrated biochemical and morphological approach for assessing response correlates well with clinical outcome [96] but may be inaccurate in the early phases of treatment due to fluctuations of CA125 and temporal lag of size changes [97]. Awareness of the limitations of anatomical imaging for size-based response assessment of ovarian cancer (nonmeasurable disease, poor reproducibility and lag of macroscopic volume change compared to reduction in cellularity) has driven the need for novel modalities which provide functional as well as structural information. These gauge tumour biology by targeting properties such as metabolism, hypoxia, cellular proliferation/density and vascularisation [98].
36.4.2 MRI
36.4.2.1 DCE-MRI
DCE-MRI has been used for response assessment in ovarian cancer: in a study of 24 ovarian cancer patients, the initial area under the gadolinium curve (IAUGC) and the transfer constant K trans did not alter significantly within 24 h of initiation of standard platinum-taxane chemotherapy, presumably due to wide intrapatient variability (reported coefficients of variation 20.3 and 12.1 %, respectively) [99]; lack of demonstrable haemodynamic changes in this study suggests that possible early antivascular effects of purely cytotoxic regimens are beyond the sensitivity of DCE-MRI techniques. Although one study showed significant correlations between DCE-MRI parameters and serological markers (fractional blood plasma volume, v p, inversely correlated and K trans positively correlated with soluble VEGF receptors 1 and 2 [100]), another exploratory study following treatment with bevacizumab, an antivascular endothelial growth factor (VEGF) antibody, showed no significant correlations of relative blood flow with microvessel density, response status and progression-free survival [101]. In the former study a significantly higher percentage change of enhancing tumour fraction and CA125 from baseline was observed at 4 weeks in patients who subsequently progressed clinically compared with those who remained stable, indicating a bigger initial response in more aggressive tumours. In this context it has to be noted that the results of the Medical Research Council OV05/European Organisation for Research and Treatment of Cancer 55955 trial did not demonstrate any survival benefit with early treatment of disease progression based on increased CA125 levels compared to delayed treatment of symptomatic recurrence, thus questioning the clinical utility of serological or imaging surrogate markers [102].
36.4.2.2 DWI-MRI
Response may also be quantified before any measurable reduction of tumour volume using ADC (Fig. 36.4). An increase in centile values of ADC from cumulative histograms generated from the amalgamation of different sites of primary adnexal and secondary peritoneal and omental disease may be seen after one cycle of chemotherapy and a decrease of histogram skewness and kurtosis after three cycles [103]. Percentage change of the 25th percentile was the parameter with the highest accuracy in identifying response, with an AUROC of 0.82, suggesting that the domains of lower diffusivity may be more representative of tumour biology due to their highest cellular concentration. However, ADC discriminants after the first cycle improved the PPV of integrated CA125 and RECIST criteria of response (92.6 % vs. 64.8 %, respectively) but not their NPV (46.2 % vs. 35.7 %, respectively), which in clinical practice would be helpful for the early identification of nonresponders [103]. In a multiparametric study combining DWI, DCE-MRI and 1H-MRS of 22 patients receiving neoadjuvant platinum-based chemotherapy, responders showed a significantly higher increase of mean ADC values and of the fractional volume of extravascular extracellular space v e, also reflected in a higher decrease of the rate constant k ep (k ep = K trans/v e) in ovarian lesions compared to nonresponders but not in omental or peritoneal sites [104]. Furthermore, pre- and posttreatment choline concentrations of ovarian tumours were significantly lower in responders than in nonresponders (P = 0.025 and 0.010, respectively), although the predictive values of these parameters were not stated in the study. These preliminary data support the promising role of functional imaging techniques in providing biomarkers for prediction and early assessment of treatment response.
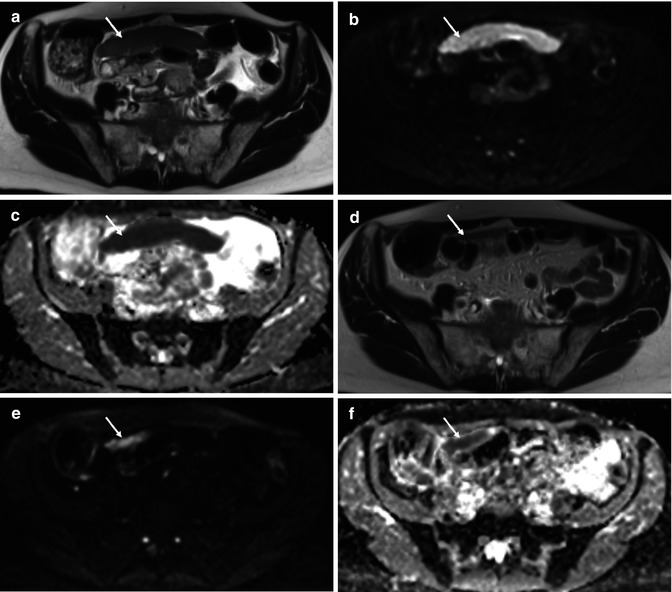
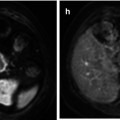
Fig. 36.4
Treatment response of primary high-grade serous ovarian cancer in a 62-year-old female. Baseline axial T2-weighted MR (a) demonstrates a large inframesocolic omental deposit (arrow) with increased signal intensity on the high b value (b = 900 s/mm2) DWI image (b) and a low ADC on the corresponding ADC map (from b = 100, 500, 900 s/mm2) (c), signifying impeded diffusion. Posttreatment imaging performed after 3 cycles of neoadjuvant chemotherapy (d–f) demonstrates partial response with a small-volume residual omental cake (arrow). Mean ADC of the lesion decreased from 0.56 × 10⁻³ mm2/s at baseline to 0.29 × 10⁻³ mm2/s after treatment, indicating that residual tumour may be more hypercellular compared to responding tumour
36.4.3 Positron Emission Tomography
36.4.3.1 [18F]-Fluorodeoxyglucose
In advanced ovarian cancer a limited number of FDG-PET clinical studies have demonstrated that sequential SUVmax decrease during neoadjuvant chemotherapy can characterise response and predict clinical outcome more accurately than clinical and biochemical biomarkers [105–107]. A threshold of SUVmax decline >20 % after the first cycle and >55 % after the third defined metabolic response and was associated with a significantly higher median overall survival in responders (38.3 and 38.9 months, respectively) than in nonresponders (23.1 and 19.7 months; P = 0.008 and 0.005, respectively). Macroscopically complete surgical cytoreduction was achieved in 33 % of metabolic responders compared to 13 % of nonresponders. However, clinical response criteria, such as residual tumour less than 4 cm, regression of peritoneal carcinomatosis and ≥75 % reduction/normalisation of CA125, did not correlate with overall survival (P = 0.7) [105].
36.4.3.2 Novel PET Radiotracers
The use of novel PET radiotracers that address specific metabolic pathways also is being explored. The radiotracer [18F]-fluorothymidine (18F-FLT), a thymidine analogue, the uptake of which correlates with the degree of DNA synthesis and cellular proliferation, has shown in a small number of PET preclinical studies of human ovarian cancer xenografts in mice an early and significant reduction of accumulation as a result of effective experimental treatment [108, 109]. Change in 18F-FLT uptake preceded tumour volume reduction after treatment with everolimus and Top216, both inhibitors of the mammalian target of rapamycin (mTOR) pathway, and supervened the magnitude of 18F-FDG decline [108, 109]. In a pilot clinical study in 6 patients with ovarian lesions, 18F-FLT uptake (SUVmax) was higher in malignant than benign tumours and normal ovarian tissue and was positively correlated with Ki67 mitotic index [110]. Another radiotracer, 11C-choline, has been shown to be advantageous over FDG-PET in the detection of primary pelvic tumour (n = 18) (sensitivity 85 % vs.75 %, respectively) due to the absence of the confounding effects of urinary radioactivity and hyperglycaemia, albeit with significantly lower SUVmax (4.61 ± 1.61 vs. 9.14 ± 3.78, P < 0.0001) [111]. Pelvic inflammatory disease may be a source of false-positive results, and intense physiological 11C-choline in the intestine hampers the detection of parailiac lymphadenopathy [111]. Experimental single photon emission computed tomography (SPECT) imaging with 111


Related posts:


Stay updated, free articles. Join our Telegram channel
Full access? Get Clinical Tree
