Macro trend
Potential consequences
Emphasis on cost effectiveness of PCI
Earlier triage via non-invasive testing
Selective use of invasive diagnostics
Lower disposable costs
Emphasis on functional assessment
Preference for rapid, easy-to-use technologies
Increased emphasis on patient outcomes
Reimbursement restricted to devices with proven outcome benefit
Selective use of invasive diagnostics in complex cases with highest complication rates
Need for well-conducted clinical trials to gain wide acceptance of new devices
Economic penalties for repeat procedures
Increased use of therapeutic guidance in complicated cases
Need for new diagnostic methods to guide preventative therapies
Personalized medicine
Emphasis on quantitative risk assessment to appropriately tailor therapy
Fewer open-heart surgical procedures
Need for better real-time visualization in structural heart procedures
Another equally important consequence has been an increased emphasis on functional assessment of coronary lesion severity by fractional flow reserve (FFR) as an adjunct to the conventional anatomical assessment by angiography. Measurement of FFR with a pressure wire has been shown in well-controlled clinical trials to be a powerful tool for detecting ischemia-producing coronary lesions [1, 2]. Stenting in lesions with FFR readings above a threshold of 0.80 can be safely deferred, with an associated reduction of procedural complications [3]. The relatively weak correlation that has been observed between FFR and IVUS- or OCT-derived anatomical measures in recent studies [4] has called into question the role of intravascular imaging in decisions to stent intermediate coronary lesions. How can OCT-guided PCI improve a patient’s chances of a good outcome beyond that expected when stenting decisions are made by FFR assessment alone? This is one of the key questions being addressed as the application of optical coherence tomography in interventional cardiology expands.
Counterbalancing the trend toward cost-containment in PCI, which tends to discourage the widespread use of intravascular imaging, is the need to obtain reliable and comprehensive information for making the right treatment decisions so that complications and repeat procedures can be avoided. There will continue to be a clinical demand for advances in imaging that give cardiologists a more detailed look at vascular morphology than angiography alone can provide.
15.3 Research Areas
Optical coherence tomography is a very active research area for engineers and scientists, with hundreds of journal articles published each year on topics ranging from the principles of tunable lasers to new applications of OCT in clinical ophthalmology [5–7]. Although a relatively small fraction of the published research literature pertains specifically to coronary imaging, these publications serve as a valuable resource for innovation in intravascular OCT. In particular, the latest generation of intravascular OCT instruments has benefited from the accelerated commercialization of R&D advances in laser and photonics technologies, image processing, and computing power. Industry has the primary responsibility to translate these advances into affordable products with clear patient benefits. Toward this end, efforts to improve future generations of OCT imaging systems are focused on the reliability of image acquisition, rapid extraction of relevant clinical information, and ease of use for real-time decision-making in the catheterization lab. In the following sections, work in several specific research areas is discussed under separate headings.
15.3.1 OCT Image Acquisition Within a Single Cardiac Cycle
Since the first frequency-domain OCT systems were introduced for coronary imaging in 2009, the benefits of increasing the speed of OCT image acquisition have been recognized: longer vessel surveys with lower injected contrast volume, fewer cardiac motion artifacts in 3D vessel reconstruction, and shortened therapeutic decision times. It is now possible to complete an intravascular OCT pullback in less than 1 s, enabling 3D image acquisition within a single cardiac cycle. The transition to markedly higher imaging speeds has been made possible by concurrent advances in three areas: rapidly swept laser light sources; distally actuated micromotors; and high-speed electronics for data acquisition.
Swept lasers form the heart of intravascular OCT systems. Laser sweep rate, tuning range, and coherence length directly map into OCT system imaging speed, axial resolution, and imaging range, respectively. Hence, academic and industrial research groups have focused heavily on improving laser performance in recent years. Fourier-Domain Mode-Locked (FDML) lasers have increased in sweep rate from 290 kHz in 2006 [8] to 5.2 MHz in 2010 [9], while the use of dispersion-compensating filters has allowed FDML coherence lengths to extend beyond 2 cm [10], thereby enabling longer scan ranges for intravascular imaging. At the same time, vertical cavity surface-emitting laser (VCSEL) technology has progressed rapidly and can now reach sweep rates up to 1 MHz, with coherence lengths in the multi-cm range [11]. Other classes of lasers have also been demonstrated for high-speed OCT imaging, such as fiber ring lasers that operate at rates up to 240 kHz [12] and external cavity lasers based on polygon rotational filters that operate at rates as high as 400 kHz [13]. Many high-speed OCT laser systems now incorporate internal or external optical buffering [14] to replicate time-delayed copies of each wavelength scan and thereby multiply the effective sweep rate.
To make productive use of their fast line rates, high-speed OCT laser systems must be coupled to correspondingly high-speed imaging catheters. Intravascular OCT requires line densities of 500–1,000 image lines per frame; fewer lines per frame lead to spatially under sampled images, while more lines per frame lead to spatially oversampled images. State-of-the-art lasers operating at speeds of 1–5 MHz should therefore be operated with catheters capable of generating images at speeds of 1,000–10,000 fps. A conventional intravascular imaging catheter is actuated at its proximal end using an external motor coupled to a torque wire via a fiber-optic rotary joint (FORJ). Rotational motion is transmitted to the lens assembly at the distal tip of the catheter. Due to the mechanical constraints of the torque coil, FORJ, and motor, as well as the requirement to translate motion over the entire length of the catheter (1.5–2.0 m), commercial catheter speeds are currently limited to about 200 fps. High-precision research systems that employ custom-made FORJ assemblies and catheters have achieved rotational speeds up to 350 rotations per second (rps), which enables frame capture at the equivalent rate of 350 frames per second [12]. Emerging catheter designs that feature micromotors mounted at the distal end of the catheter eliminate the need for external motors and torque coils. High-speed catheter operation has been demonstrated with piezoelectric devices at rotational speeds up to 960 rps [15] and with rotary micromotors at 400 rps [16] and 3,200 rps [17]. While these revolutionary catheter technologies remain slightly too large for clinical deployment and pose fabrication and cost challenges, moderate reductions in actuator size may soon enable their use in vivo without compromising device deliverability or safety.
The final technology required for intravascular OCT imaging within a single cardiac cycle is high-speed data acquisition and signal-processing electronics. To preserve system dynamic range, OCT systems require relatively high-resolution digitizers, particularly when imaging samples with highly variable signal levels common to pathologic or stented arteries. The availability of gigasample-class digitizer integrated circuits, combined with high-bandwidth digital bus architectures and the signal-processing capabilities of graphic processing units (GPUs) has opened the door for real-time 3D OCT imaging. Currently, the highest speeds achieved to date for an intravascular OCT imaging system have been obtained by pairing a high-speed signal processing system with a 1.6 MHz FDML laser source and a micromotor catheter operating at 3200 rps, culminating in a total pullback time of under 1 s [17]. In the future, intravascular OCT acquisition speeds will continue to increase as laser, catheter, and signal processing technologies advance in parallel.
15.3.2 3D Segmentation and Visualization
The increase in the volume of image data acquired by successive generations of OCT imaging systems has outpaced the ability of the systems to extract clinically relevant information and display it in a format that can be readily interpreted by cardiologists during PCI procedures. In a typical OCT procedure, several gigabytes of data are acquired to generate cross-sectional images of an artery in three dimensions before and after intervention. Fortunately, software is being developed for the latest generation of OCT systems that eases the information processing burden by automating the main tasks involved in treatment planning and evaluation.
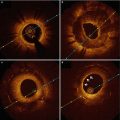
Earliest to emerge have been automated software tools that take advantage of the clear delineation of the lumen boundary provided by OCT [18–20]. Figure 15.1 shows an example of the information displayed by the latest generation of a commercial intravascular imaging system (ILUMIEN OPTISTM, St. Jude Medical, Westford, MA). In addition to the conventional transverse and longitudinal (L)-mode cross sections (upper right and lowermost panels of Fig. 15.1), a volumetric reconstruction of the lumen is displayed (upper left panel). Generated by a fully automatic software routine that traces the 3D contour of the inner surface of the artery, this representation of the artery is intended to give cardiologists views of lumen morphology similar to those provided by coronary angiograms reconstructed from projections acquired at multiple angles. The algorithms that underlie the automated boundary detection must be computationally efficient for real-time operation and must operate in the presence of guide-wire shadows and other image artifacts.
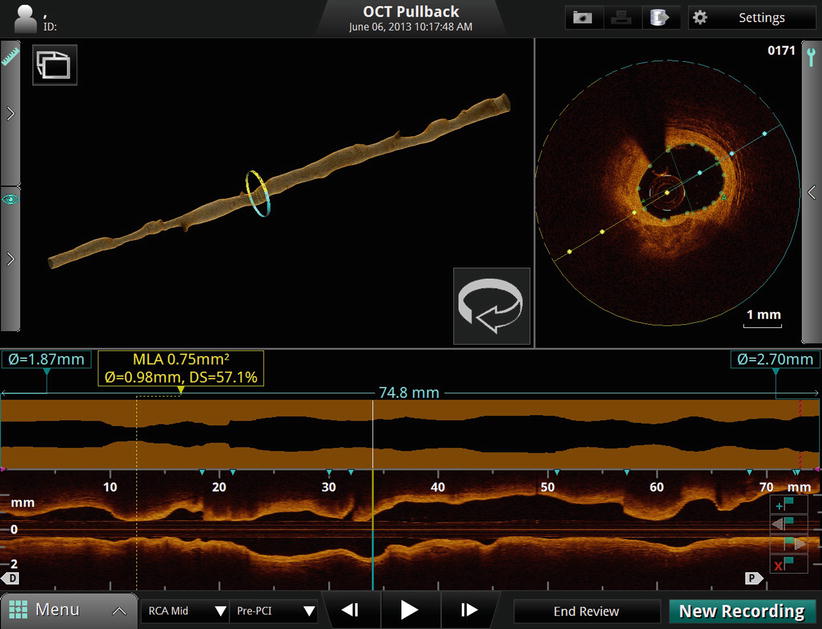
Fig. 15.1
Volumetric data display on the ILUMIEN OPTISTM OCT system console
Although they give an impression of the severity and longitudinal extension of flow-limiting lesions, 3D lumen reconstructions are not well-suited for quantitative planning. The lumen profile display, shown in Fig. 15.1 above the L-mode image, is designed to serve this function. Derived from the 3D lumen contour, the lumen profile shows the mean diameter or area of the vessel lumen along the entire length of the imaged segment of the artery (7.5 cm, in this example). Unlike the L-mode display, the lumen profile is calculated as an average over all angles, allowing the variations of the flow-limiting diameter or area of the artery to be quantified independent of lesion eccentricity. This information facilitates the choice of the appropriate stent diameter and length for restoration of the lumen profile.
Recently, the scope of research in volumetric imaging has extended beyond lumen reconstruction to automated segmentation and visualization of stents for volumetric assessment of malapposition and neointimal thickness [21–24]. One of the objectives of this work is to provide clinical researchers with new off-line tools for evaluation of stent performance in large patient trials; another objective is to facilitate real-time assessment of stent deployment.
When a beam of light impinges on a metallic stent strut, it reflects light strongly and casts a shadow. These basic optical properties are the primary signatures of stents in OCT images. One might imagine that computer recognition of stent struts would then be simple exercise of searching for regions of the OCT image with bright reflections with associated shadows. In practice, however, the image-processing task is not so straightforward. Since the reflection of light from the surface of most stent struts tends to be specular, the intensity of light reflected back to the lens at the tip of the OCT catheter depends strongly on the angular orientation of the strut relative to the incident OCT beam. Consequently, the apparent brightness of the image of a stent strut, as well as the appearance of its shadow, both depend on the position of the OCT catheter in the artery. Moreover, the radial position of the strut relative to the focus of the incident OCT beam and the presence of overlying tissue or residual blood adds to intensity variations. Finally, other bright and highly attenuating structures in the artery (e.g., foam cell clusters) can masquerade as stent struts.
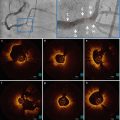
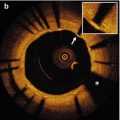
In spite of the challenges imposed by these variables, significant progress has been made in the development of robust image-processing methods for automated stent detection in OCT images. Figure 15.2 shows an example of computer-detected stent struts in OCT images of a freshly implanted stent and of a stent at follow-up [23]. Based on the computer-generated distribution of stent reflections relative to the lumen boundary, the boundary of the malapposed region or the volume of tissue coverage can be quantified and displayed. The potential clinical benefits of volumetric stent imaging with intravascular OCT is currently being investigated for assessing the risks of stent restenosis and thrombosis after implantation of bare metal and drug-eluting stents [25, 26].
Fig. 15.2
Examples of automatic detection of stent struts in OCT image cross sections. (a) Freshly implanted stent with residual blood in lumen. (b) Stent at follow-up with eccentric neointimal growth console (From Ughi et al. [23])
Perhaps the longest-standing and most challenging objective of OCT software developers has been the automated delineation and characterization of plaque within long arterial segments. Although early work by Yabushita and others [27–29] established the relationship between the optical characteristics of the most common vascular tissues and their appearances in OCT images, an algorithm for fully automated tissue classification is not yet available for clinical use. Recently, computer-assisted segmentation of calcified plaques and thin-capped fibroatheromas has been demonstrated in a research setting. Figure 15.3 is an example of a 3D rendering of a large calcium deposit in an artery imaged by OCT in vivo [31]. Such reconstructions, made possible by the unique ability of OCT to image calcium, may facilitate real-time planning of stent placement and deployment, especially in complicated cases for which use of rotational atherectomy or a cutting balloon is indicated. A semi-automatic algorithm has also been developed for volumetric reconstruction of fibrous caps overlying lipid-rich plaque [30]. Quantitation of thickness variation based on the 3D structure of the plaque may lead to a better understanding of the mechanisms of plaque rupture.
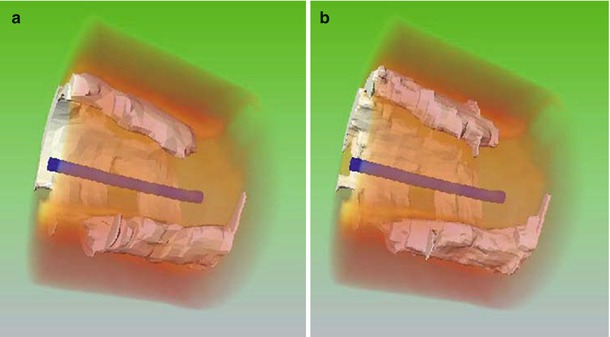
Fig. 15.3
3-D rendering of calcified plaque in an OCT image segment (a) manually segmented, and (b) automatically segmented (From Wang et al. [30])
The rapid development of 3D visualization techniques for CT, MR and other non-invasive imaging modalities is likely to engender parallel developments in intravascular imaging. By reducing the steepness of the learning curve for image interpretation, computer-assisted processing and display of image data promises to improve the clinical utility of OCT for non-expert users.
15.3.3 Angiographic Co-Registration
While intravascular OCT images enable visualization of coronary anatomy with unprecedented levels of detail, only a segment of one coronary branch can be interrogated within a single acquisition. Additionally, OCT imaging cannot be performed in real time during delivery of stents or other therapeutic devices. Therefore, cardiologists continue to rely on X-ray angiography for assessment of the complete coronary system and for real-time guidance of intravascular therapy. Recently, technologies have begun to emerge that allow co-registration of OCT and angiography image data to overcome these limitations.
Two general software techniques for OCT-angiography co-registration currently exist: landmark-based and tracking-based. Landmark-based co-registration techniques rely on identification of a known feature that is visible in both the OCT and angiographic images to anchor the position of the images. Landmark features are typically large side branches, which are readily detectable with both OCT and X-ray imaging. Although identification of the landmark is currently performed by a trained user, this technique could conceivably be automated in the future. Once a landmark has been selected, a priori knowledge about the OCT pullback speed, length, and starting position can be used to project the OCT frame positions onto an angiographic image. This class of techniques has the advantage that an OCT pullback can be co-registered to an angiogram acquired at a different point in time, as long as there was no change in the position of the OCT catheter between the acquisition of the two datasets. Industrial research teams have demonstrated full 3D reconstruction and co-registration of OCT with angiography using multi-planar X-ray imaging and landmark-based techniques [32].
Tracking-based co-registration techniques rely on detection of a radio-opaque feature on the OCT catheter, such as a marker band, in a series of angiography frames acquired at the same time as the OCT pullback. If the radio-opaque feature is positioned at a known distance from the catheter’s imaging lens, the OCT image position can be localized directly on the corresponding angiography frame. This class of techniques has the advantage of generally requiring less user input, as there is no need for identification of landmarks on the OCT or angiography images. Tracking-based co-registration has the drawback of requiring the OCT and angiography datasets to be acquired simultaneously. However, this requirement provides the benefit of inherent compensation of motion artifacts, as the true position of the OCT imaging lens can be inferred on every angiography frame.
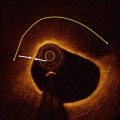
Figure 15.4 shows an example screenshot of tracking-based OCT co-registration software developed by St. Jude Medical. The left panel shows an angiography frame acquired at the same time as the OCT frame displayed in the right panel. The white bar on the X-ray image indicates the spatial location of the OCT frame. The side branch visible at 8 o’clock in the OCT image is also visible directly underneath the white angiography marker. This type of display is useful for localizing features detected by OCT within the wide field of view provided by angiography.
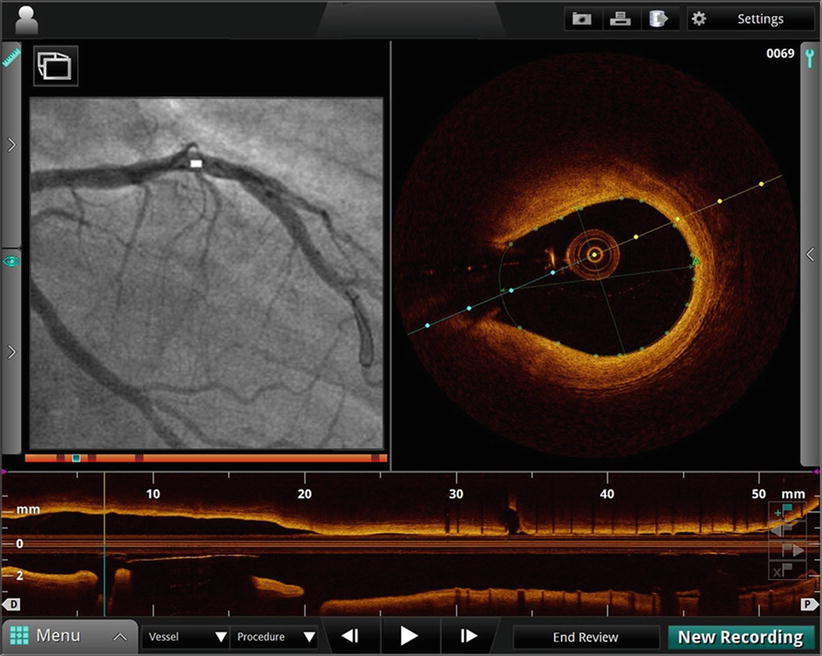
Fig. 15.4
Co-registration of OCT (right hand panel) and angiographic (left hand panel) images. White marker on angiogram indicates position of OCT frame. Side branch visible on OCT at 8 o’clock position is also visible directly beneath white marker on angiogram
15.3.4 Functional Lesion Assessment
The increasing acceptance of FFR as the gold standard for functional assessment of the hemodynamic significance of coronary stenoses has called into question the role of imaging in stenting decisions [2]. Minimum lumen area (MLA) and percent diameter or area stenosis (%DS or %AS) are the anatomical measures of lesion significance by which the significant of intermediate lesions have been evaluated by angiography and IVUS. Recent studies have shown weak correlations of these measures with FFR for both imaging modalities [33, 34]. MLA and %AS measured using OCT has not fared much better, except in small-diameter arteries [4, 35].
Since narrowing of the epicardial coronary branches is the predominant contributor to the pressure drop measured by a pressure FFR, why do MLA and %AS, as measured by OCT and other existing imaging modalities, fail to correspond well with FFR measurements? This discordance has both physiological and methodological origins [36]: (1) simple anatomic indices fail to represent the volumetric nature of flow-limiting lesions, (2) very high measurement accuracy is critical, because the flow resistance or a stenosis varies in inverse proportion to the fourth power of its radius, (3) since the pressure drops across stenoses are flow dependent, shunting of flow by side branches and collateral vessels can alter the physiological significance of the same stenosis at different locations, and (4) the hyperemic microvascular resistance, which sets the upper limit on blood flow in a given branch, and hence, the pressure drop across a stenosis, varies according to the volume of myocardium perfused by a given coronary branch.
New methods are being developed for modeling blood flow resistance of coronary arteries that aim to improve the ability of image-derived anatomical measurements to predict the functional significance of coronary lesions [37]. Although most of the publications on this topic pertain to non-invasive assessment of FFR using computed tomography angiography [38, 39], investigations of methods to estimate FFR from 3D OCT models have been active for a number of years [40, 41]. High-quality 3D lumen reconstructions generated from OCT images contain detailed information about lumen morphology, normal reference diameters, branch locations and other variables from which patient-specific models of coronary blood flow can be built.
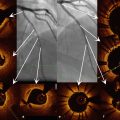
The feasibility of estimating FFR using a computationally efficient model of flow resistance derived from OCT images was demonstrated recently in a small clinical study [41]. This study showed the benefits of incorporating information about the volumetric properties of a coronary lesion, in addition to its minimum cross-sectional dimensions. Figure 15.5 shows the diameter profile of a diffusely stenosed coronary artery (upper panel) and the corresponding pressure drop along its length (lower panel) calculated by the analytical flow model employed in the study. The numerical values shown in the figure are the hyperemic blood flow rates estimated by the flow model for each of the branches. Based on these flow rates and the flow resistances calculated from the lumen areas measured along the length of the vessel, the model estimates the FFR for the main branch. In this example, the ‘1 – VRR’ value (0.66) displayed in the top panel of the figure is an estimate of the distal FFR that would be measured by a pressure wire. Flow modeling opens the potential for optimization of PCI according to anatomical and physiological information derived from pullbacks. If future studies support the clinical utility of OCT-derived FFR estimates, this approach may encourage the development of interactive stent planning tools to facilitate treatment of complex coronary lesions.
Fig. 15.5
(Top) Mean-diameter profile of the lumen of a stenosed coronary branch derived from an OCT pullback image. The ‘1 – VRR” value (0.66) in the upper left corner of the panel is the estimated FFR. The other numerical values are the estimated blood flows in ml/s. (Bottom) Calculated pressure drop along the length of the vessel for the branched and hypothetical unbranched artery (From Guagliumi et al. [41])
15.3.5 Multimodal Imaging
Since the first intravascular OCT studies were carried out nearly 15 years ago, a growing number of intravascular imaging modalities have been demonstrated in pre-clinical studies: near-infrared spectroscopy (NIRS), intracoronary MRI, elastography, molecular fluorescence, and photoacoustic imaging [42–44]. Given that each modality has its particular strengths and weaknesses, it is natural to contemplate whether there are synergistic combinations of modalities that can provide unique clinical diagnostic capabilities for cardiovascular application. In 2013, the TVCTM NIRS-IVUS Imaging System (Infraredx, Burlington, MA) was the first intravascular imaging system with a dual-modality catheter to gain FDA approval. It is likely that other multimodal intravascular imaging technologies will be introduced into clinical practice in the coming decade. This section reviews on-going investigations of multimodal intravascular diagnostics in which OCT plays a central role.
15.3.5.1 OCT-IVUS
Although the superior contrast, resolution, and near-field image quality of OCT compared to IVUS make the interpretation of arterial morphology easier [45], the deeper tissue penetration of IVUS has advantages in applications that require a long far-field scan range, such as ostial left main imaging and the measurement of lipid plaque burden.
Efforts to combine OCT and IVUS functionality on the same catheter and console have been reported by several research groups [46–48]. The main challenge of these efforts has been to maintain state-of-the-art performance of both modalities without adding significant complexity or cost. Without sacrificing crossing profile and deliverability, the catheter must accommodate the IVUS transducer with the interconnecting RF and OCT fiber optics within a single sheath. Several different catheter-tip configurations have been reported to align the OCT and IVUS beams with only a small longitudinal, lateral or angular offset. To date, prototype catheters with outer diameters as small as 3.6 F have been developed and tested in animal models [48]. Figure 15.6 shows an example of the construction of the internal catheter-tip assembly at the tip of a 4 F OCT-IVUS catheter [47]. Further improvements in catheter design and manufacturing are required to meet the clinical requirements for imaging performance, deliverability and reliability.
Fig. 15.6
Imaging assembly at the tip of a prototype OCT- IVUS catheter before insertion in a 4 F transparent nylon sheath (not shown) (From Li et al. [47])
Hybrid OCT-IVUS imaging has the potential to differentiate and characterize plaque morphology more precisely than either modality alone. In particular, hybrid imaging may allow more comprehensive assessment of atherosclerotic lesions by combining the ability of OCT to assess lumen dimensions, estimate fibrous cap thickness, identify thrombus, and delineate the boundaries of calcified plaque with the ability of IVUS to image through lipid-rich plaques and thrombus [44].
Related posts:

Stay updated, free articles. Join our Telegram channel

Full access? Get Clinical Tree


