Future Perspective and Conclusions
9.1 Present Status
Some form of elastography is now available on most ultrasound systems. Elastography is an area of active research not only for the breast but for other organs as well. There are several techniques available for breast elastography, as summarized in ▶ Table 3.1. These can be grouped into two main categories, strain elastography (SE) and shear wave elastography (SWE). Within these two main groups there are several techniques used to generate elastograms. There have been minimal studies comparing the various techniques. All these techniques have high sensitivity and specificity for characterization of breast masses as benign or malignant. Although the techniques are easy to perform, they require attention to details to obtain optimal images for interpretation. Each of the techniques has advantages and disadvantages (▶ Table 5.1). These techniques are now maturing, but continued work on standardizing elastography techniques is required. Further comparative studies are needed to determine which technique or combination of techniques is most appropriate for various clinical problems.
No comparative studies have been performed to suggest one method is better than another. Although a meta-analysis or direct study comparing the various SE interpretation techniques has not been reported, most papers using E/B ratio have a sensitivity of > 98% and specificity of > 85%. These are higher than the reports using the 5-point color scale or the strain ratio (lesion to fat ratio). We do not know if this is a function of the interpretation technique or the variability of the acquisition technique (equipment specific). There are presently two techniques used to generate SWE in the breast. No direct comparative studies have been performed. Our observation is that there are subtle differences between the two techniques with interpretation of one system having a more prominent “ring” of high Vs surrounding the lesion as the more diagnostic feature.
Although most studies are reported as using a “light touch,” very few studies have controlled the amount of precompression with a consistent method. This may lead to the differences of cutoff values in SWE. On SE precompression does not affect the E/B ratio but leads to poor-quality elastograms. Precompression can significantly affect the strain ratio (lesion to fat ratio) on SE.
The bull’s-eye artifact seen with SE has been shown to be extremely helpful in characterization of cystic lesions.48 We have been able to eliminate a large number of breast biopsies using this technique. The ability to characterize a lesion as a benign complicated cyst with almost perfect accuracy has led to decreased biopsy and need for short-term follow-up. The increased confidence has also led to less patient anxiety and decreased requests for biopsy or surgical removal of these lesions. Further confirmation of the accuracy of this artifact in characterizing a lesion as a benign complicated cyst will hopefully lead to addition of this artifact as a special case in the ultrasound Breast Imaging–Reporting and Data System (BI-RADS).
Guidelines for elastography in the breast have been presented.15,16 The guidelines all recommend the use of elastography in characterization of breast lesions as benign or malignant. The guidelines do not recommend one method over another. The guidelines suggest that elastography may be used to upgrade or downgrade the BI-RADS category score but do not provide detailed specific guidance on when this should be used.
Additional studies are needed to determine cutoff values for the various techniques and interpretation methods. The studies need to have better control of technique, especially controlling the amount of precompression. Based on the studies published to date, guidance in interpretation based on the probability of malignancy can be provided. ▶ Fig. 5.2 presents these data on a scale similar to BI-RADS probablity scale based on the probability of malignancy for each technique. There is moderate variability in published results for some techniques. A conservative approach was used to develop this table. As more standardized methodology is used it is expected the table will be revised.
9.2 Areas for Further Research
9.2.1 Elastography–Pathology Correlation
There are several elastography findings that are unique to the breast. The size change observed in SE in both benign (smaller) and malignant lesions (larger) appears to occur only in breast. Desmoplastic reaction has been suggested as a possible cause for malignancies appearing larger on SE. However, this does not explain why benign lesions appear smaller. The size changes noted in the breast are not identified in phantom studies. It is not know if surgical specimens have similar size changes studied in vitro as noted in vivo. Further correlative studies with surgical pathology are needed to determine if the actual size of a malignant tumor is better defined by the elastographic size as opposed to the B-mode size. More detailed elastography pathology correlative studies are needed to determine the exact nature of the stiffness identified on both SE and SWE surrounding malignancies. These studies would be helpful in determining if the elastographic size should be used in surgical planning. We know that B-mode ultrasound and mammography often underestimate the size of malignancies compared to surgical pathology.
9.2.2 Tumor Grade Assessment
Preliminary work has demonstrated that the elastogram/B-mode (E/B) ratio is predictive of tumor grade. Low-grade malignancies such as ductal carcinoma in situ (DCIS) and mucinous or colloid cancers have E/B ratios of near 1. Invasive ductal cancers have higher E/B ratios, and the ratio appears to have some correlation with tumor grade.28 Similar results have been found with SWE. Evans et al193 reported that breast cancers with higher mean stiffness values at SWE had poorer prognostic features. They found that high histologic grade, large invasive size, lymph node involvement, tumor type, and vascular invasion all showed statistically significant positive association with high stiffness values. Further investigations are needed to determine if this information will prove clinically useful.
9.2.3 Poor Shear Wave Propagation in Cancers
Preliminary work suggests that shear wave generation or propagation is problematic in breast malignancies. This does not appear to occur in other organs. This can lead to false-negative results. This phenomenon occurs with both SWE systems and is most likely a fundamental problem of breast pathology and not with ultrasound SWE. This phenomenon leads to non–color coding of the malignancy or a poor-quality measure. Initial SWE algorithms did not fully account for this problem. Now that this phenomenon is known the addition of a quality measure or improved algorithms not color coding areas of poor-quality shear waves are being developed to solve this problem and limit the number of false-negative results.65 The result is that in many breast cancers the shear wave velocity (Vs) cannot be determined. In some cancers the high Vs in the periphery of the lesion will allow for a true-positive result. But many breast cancers will not have elevated Vs in or around the lesion, with the areas of malignancy not color coded or having a poor-quality measure. In most cases if the lesion is solid and it does not color code the lesion has a high probability of being a malignancy.65 In all of these cases SE documents these breast malignancies as true-positives. The combination of SE and SWE results will increase the diagnostic confidence in these cases.
9.2.4 Improved Understanding for Specific Pathologies
There have been very few studies of the elastographic features of individual pathologies. This book has presented the range of elastographic features for individual pathologies, mostly based on our experience, given the lack of published results. For example, fibroadenomas can have a wide range of elastographic findings from very soft to very stiff, from an E/B ratio of < 1 to > 1. We do not know if elastographic data will provide clinically useful information on a given pathology. Do stiff fibroadenomas with an E/B ratio > 1 have a higher probability of continued or rapid growth? Can this be used to select patients who could benefit from surgical removal? Can elastography be used to monitor large-duct papillomas and predict if they are progressing to atypia or malignancy? Some work as been done on using elastographic data to characterize malignancies. The E/B ratio and Vs max have been shown to correlate with tumor grade on preliminary studies.
9.2.5 Correlation between Semiquantitative and Quantitative Measurements
Very few studies have been performed where several measurements using different techniques are performed in the same patient. Is there a correlation between the Vs max and the elasticity/imaging (E/I) ratio? How do the E/I ratio and strain ratio (lesion to fat ratio) relate to each other? Our limited results suggest that the E/I ratio and strain ratio may not be significantly correlated. The E/I ratio measures a phenomenon that we do not understand but relates to the tumor interaction with adjacent tissue elasticity, whereas the strain ratio is a measure of stiffness. It appears a lesion can have low malignant strain ratio but have a large malignant E/B ratio. The strain ratio is more likely to correlate with the Vs max on SWE.
9.3 Future Developments
Elastography is still early in its development. Improvements in existing techniques as well as new techniques are certain to be developed. Elastography is an area of very active research not only for the breast but also for many other organs.194
9.3.1 Three-Dimensional Screening
The present two-dimensional (2D) technology limits elastography for breast cancer screening. Screening with SE will most likely be problematic for some time due to its relative nature. Both 2D SE and 2D SWE are limited in screening due to the long amount of time needed to screen the breasts with these techniques. Both techniques cannot be used in a scanning mode. At each location where an elastogram is obtained the probe must be stationary for at least several seconds.
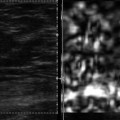
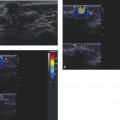
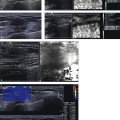
The development of a three-dimensional (3D) shear wave technique would allow for breast screening in a reasonable amount of time. Works in progress of both SE (▶ Fig. 9.1) and SWE (▶ Fig. 9.2) have been reported. The present 3D probes scan a relatively small area, and evaluating both breasts for screening takes a prohibitive amount of time. The development of a 3D SWE probe that can evaluate a larger field of view (FOV) is needed to allow for routine screening with SWE.
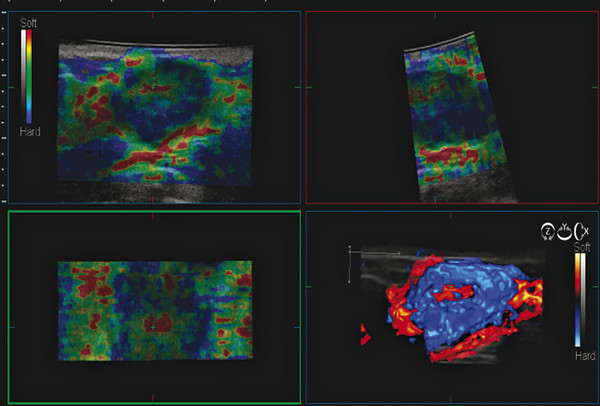
Fig. 9.1 The three-dimensional (3D) strain elastogram of an invasive ductal cancer obtained on a Hitachi system (Hitachi Aloka America, Wallingford, CT) displayed as a 3D rendering. In addition to 3D rendering, imaging can be presented as slices that can be displayed in any plane.
(Courtesy of Hitachi Aloka Medical, press release dated February 7, 2011)
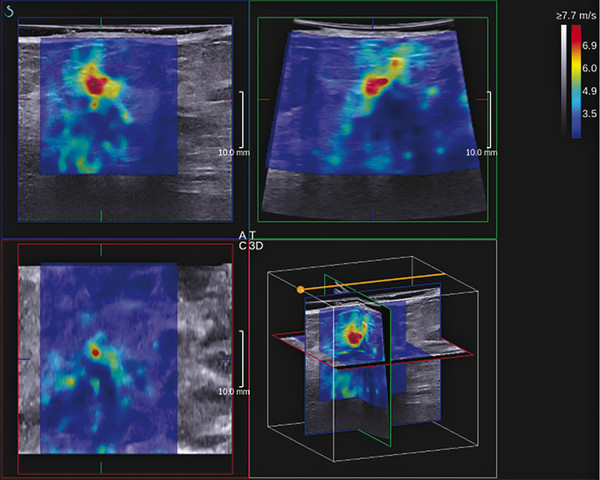
Fig. 9.2 The three-dimensional images from an invasive ductal cancer obtained with a SuperSonic Imagine system (Bethel, WA). The axis can be moved to visualize a two-dimensional image from any plane. The data can also be displayed as multiple slices through the field of view slices in any plane.
(Courtesy of Supersonic Imagine, press release dated March 8, 2011)
The development of 3D elastography may help to improve lesion characterization and allow for evaluation of larger areas of breast tissue in a time-efficient manner. Evaluation with elastography in the coronal plane with the use of an opacity feature is presently being investigated. With only one acquisition the tumor volume can be interrogated for spiculation, extent of invasion, desmosplastic reaction, and Vs values throughout the volume. This may lead to improved presurgical planning and assessment of effectiveness of chemotherapy.
9.3.2 Added to BI-RADS
Addition of elastography to the BI-RADS lexicon is expected in the future. Given the excellent results of elastography in initial studies the addition of this technique to the BI-RADS ultrasound lexicon will most likely occur. The addition of elastography to the BI-RADS classification may be the ability to upgrade or downgrade BI-RADS category 3 or BI-RADS category 4A lesions, selecting patients more appropriate for biopsy. Further work is needed to determine if elastography will be able to downgrade BI-RADS 4B, 4C, or 5 lesions. With sensitivities of > 98% in several large studies using the E/B ratio in SE, lesions with an E/B ratio should be considered BI-RADS category 5 regardless of the conventional ultrasound findings. Using this technique the Positive Predictive Value (PPV) is 99%. Thus an E/I ratio value of < 1 has a < 2% probability of malignancy, suggesting the lesions with this finding fall into a maximum BI-RADS category 3 regardless of the BI-RADS category score on conventional ultrasound. Further studies need to be performed to determine if this is an appropriate approach.
9.3.3 Standardization of Protocols
There are significant differences in results with strain ratio. This is partially due to some studies using subcutaneous fat as a reference, whereas others use fat at a similar depth to the lesion and still others use both fat and glandular tissue as the reference. Precompression will also affect the strain ratio because the stiffness of fat will be affected more than that of other lesions, leading to a lower strain ratio. There is also no convention as to where the regions of interest (ROIs) should be placed—whether they should include the entire lesion or the region with greatest stiffness. There is often artifactual soft signal adjacent to lesions that should not be used to calculate the strain ratio because this will artificially elevate the strain ratio (see Case ▶ 6.17).
The cutoff value for SWE varies from a maximum value of Vs of 4.1 m/s (50 kPa) to 5.2 m/s (80 kPa) in various studies. Precompression was not controlled in these studies, although they were performed with “a light touch.” The effect of precompression can easily account for an elevated cutoff value of this range. Further studies that are well controlled for precompression are needed. A ring of high Vs surrounding a lesion has also been suggested as a diagnostic feature of malignancy. Care must be taken because precompression will cause the ring to form, even in benign lesions. This ring may be due to interaction of the acoustic radiation force impulse (ARFI) with the boundary effects when an interface of soft to hard tissue is present.195
9.3.4 Reporting
No guidelines have been developed for the reporting of SE or SWE results. We document all the elastographic parameters obtained on the images and store the images in our Picture Archiving and Communication System (PACS). We usually report the elastographic findings within the report as suggestive of benign or suggestive of a malignant lesion. If the elastographic findings change management from the BI-RADS score resulting from conventional ultrasound the report includes a more detailed discussion of the elastographic findings.
We use ▶ Fig. 5.2 to guide our interpretations. Until there is more standardization of protocols it is unlikely that a standard universal guideline for reporting will be agreed upon.
9.3.5 New Technology
There is a trend for both SE and SWE to be available on one ultrasound system. This allows a “toolbox” of elastography techniques. The elastographic examination can then be tailored to the needs of the patient. The ability to use multiple techniques will also increase diagnostic confidence if their results are concordant. Cases with nonconcordant results should raise suspicion of an unsuspected finding, such as two lesions adjacent to each other.
On SWE one system now provides four different maps that display the shear wave data. These include the velocity map, quality map, time map, and displacement map. For routine clinical use we evaluate the velocity map and the quality map. These two maps provide the information needed to accurately interpret the SWE results. The time and displacement maps are currently used for research and can be confusing to the novice. In general the quality map is most helpful when the shear wave velocities are low, suggestive of a benign lesion. In this case a high (good, green) quality map will increase the probability that the lesion is truly benign. If the quality map is poor on a lesion with low Vs the possibility of a false-negative result could be considered.65 The other SWE vendor has incorporated the quality map with the velocity map, not color coding the image where the shear wave quality is poor. The algorithms on early systems did not adequately evaluate the shear wave quality for breast applications due to unexpected shear wave propagation in breast cancers. Newer algorithms are correcting this problem, and continued improvement in accuracy can be expected as these are developed.
New elastographic techniques are in development. With increasing precompression a ring of high Vs occurs at interfaces between soft and stiff tissues.195 This may be secondary to reflection of the ARFI pulse at the interface. This appears to occur at lower levels of precompression in malignant lesions than in benign lesions. The possibility of a graded compression technique may lead to another method of characterizing breast masses and lead to improved definition of lesion borders.
9.4 Conclusions
Elastography, both SE and SWE, has high sensitivities and specificities in characterization of breast masses. The incorporation of elastography into the standard ultrasound breast exam is occurring. International guidelines have been published for the use of elastography, both SE and SWE, in characterization of breast pathology. Despite guidelines additional studies are under way to standardize the techniques, interpretation, and reporting of elastographic results. Within the next few years breast elastography will be more standardized.
Both SE and SWE have been shown to have high reproducibility, sensitivity, and specificity for characterization of breast lesions. Each has its advantages and disadvantages. The use of both techniques can increase diagnostic confidence when results are concordant.
Elastographic systems and the applications themselves continue to evolve, and new tools and new evidence will likely emerge. We anticipate that the direction of development, imaging methods, and diagnostic approaches will change and fragment in the future. It appears that elastography has already become an essential medical tool in the field of breast imaging.
References
[1] Jellins J, Kossoff G, Reeve TS. Detection and classification of liquid-filled masses in the breast by gray scale echography. Radiology 1977; 125: 205‐212 PubMed
[2] Hilton SV, Leopold GR, Olson LK, Willson SA. Real-time breast sonography: application in 300 consecutive patients. AJR Am J Roentgenol 1986; 147: 479‐486 PubMed
[3] Stavros AT, Thickman D, Rapp CL, Dennis MA, Parker SH, Sisney GA. Solid breast nodules: use of sonography to distinguish between benign and malignant lesions. Radiology 1995; 196: 123‐134 PubMed
[4] American College of Radiology (ACR). American College of Radiology Breast Imaging Reporting and Data System (BI-RADS) Ultrasound. 4th ed. Reston VA: American College of Radiology; 2003.
[5] Tanter M, Bercoff J, Athanasiou A et al. Quantitative assessment of breast lesion viscoelasticity: initial clinical results using supersonic shear imaging. Ultrasound Med Biol 2008; 34: 1373‐1386 PubMed
[6] Ophir J, Céspedes I, Ponnekanti H, Yazdi Y, Li X. Elastography: a quantitative method for imaging the elasticity of biological tissues. Ultrason Imaging 1991; 13: 111‐134 PubMed
[7] Samani A, Zubovits J, Plewes D. Elastic moduli of normal and pathological human breast tissues: an inversion-technique-based investigation of 169 samples. Phys Med Biol 2007; 52: 1565‐1576 PubMed
[8] Frey H. [Realtime elastography. A new ultrasound procedure for the reconstruction of tissue elasticity] Radiologe 2003; 43: 850‐855 PubMed
[9] Krouskop TA, Wheeler TM, Kallel F, Garra BS, Hall T. Elastic moduli of breast and prostate tissues under compression. Ultrason Imaging 1998; 20: 260‐274 PubMed
[10] Hall TJ, Zhu Y, Spalding CS. In vivo real-time freehand palpation imaging. Ultrasound Med Biol 2003; 29: 427‐435 PubMed
[11] Bluemke DA, Gatsonis CA, Chen MH et al. Magnetic resonance imaging of the breast prior to biopsy. JAMA 2004; 292: 2735‐2742 PubMed
[12] Morrow M. Magnetic resonance imaging in breast cancer: one step forward, two steps back? JAMA 2004; 292: 2779‐2780 PubMed
[13] Bamber J, Cosgrove D, Dietrich CF et al. EFSUMB guidelines and recommendations on the clinical use of ultrasound elastography, I: Basic principles and technology. Ultraschall Med 2013; 34: 169‐184 PubMed
[14] Nakashima K, Shiina T, Sakurai M et al. JSUM ultrasound elastography practice guidelines: breast. J Med Ultrasound 2013; 40: 359‐391
[15] Cosgrove D, Piscaglia F, Bamber J et al EFSUMB. EFSUMB guidelines and recommendations on the clinical use of ultrasound elastography, II: Clinical applications. Ultraschall Med 2013; 34: 238‐253 PubMed
[16] Barr RG, Nakashima K, Amy D et al. WFUMB Guidelines and Recommendations on the Clinical Use of Ultrasound Elastography: Part 2; Breast. Ultrasound in Medicine and Biology in press
[17] Emerson K. Diseases of the breast. In: Wintrobe MM, Adams RD, et al, eds. Harrison’s Principals of Internal Medicine. 7th ed. New York, NY: McGraw-Hill; 1974 :582–587.
[18] Barr RG. Sonographic breast elastography: a primer. J Ultrasound Med 2012; 31: 773‐783 PubMed
[19] Barr RG, Zhang Z. Effects of precompression on elasticity imaging of the breast: development of a clinically useful semiquantitative method of precompression assessment. J Ultrasound Med 2012; 31: 895‐902 PubMed
[20] Nightingale K, Soo MS, Nightingale R, Trahey G. Acoustic radiation force impulse imaging: in vivo demonstration of clinical feasibility. Ultrasound Med Biol 2002; 28: 227‐235 PubMed
[21] Fahey BJ, Nightingale KR, Nelson RC, Palmeri ML, Trahey GE. Acoustic radiation force impulse imaging of the abdomen: demonstration of feasibility and utility. Ultrasound Med Biol 2005; 31: 1185‐1198 PubMed
[22] Rouze NC, Wang MH, Palmeri ML, Nightingale KR. Robust estimation of time-of-flight shear wave speed using a radon sum transformation. IEEE Trans Ultrason Ferroelectr Freq Control 2010; 57: 2662‐2670
Related posts:

Stay updated, free articles. Join our Telegram channel

Full access? Get Clinical Tree


