(1)
Department of Clinical Radiology, Amiri Hospital – Kuwait City, Kuwait City, Kuwait
1.1 Liver Cirrhosis
1.1.1 Types of Liver Cirrhosis
1.2.1 Types of Liver Steatosis
1.3.3 Peptic Ulcer Disease
1.4.1 Crohn’s Disease
1.4.3 Ulcerative Colitis
1.6 Pancreatitis
1.6.1 Acute Pancreatitis
1.6.3 Chronic Pancreatitis
1.7 Jaundice
1.7.1 Kernicterus
1.7.2 Obstructive Jaundice
1.7.3 Bile Plug Syndrome
1.7.5 Choledochal Web
1.8.1 Normal Anatomy
1.8.2 Pathophysiology
1.8.4 Sprue
1.1 Liver Cirrhosis
Liver cirrhosis is a term used to describe the histological development of regenerative hepatic nodules surrounded by fibrous bands in response to chronic liver injury.
Cirrhosis is an advanced, diffuse stage of liver injury, which is characterized by replacement of the normal liver parenchyma by collagenous scar (fibrosis). Cirrhosis is accompanied by diffuse distortion of the hepatic vasculature and architecture, resulting in vascular disturbance between the portal veins and the hepatic veins, plus porta hepatic fibrosis. The major cirrhosis consequences are hepatic function impairment, increased intrahepatic resistance (portal hypertension), and the development of hepatocellular carcinoma (HCC).
Types of Liver Cirrhosis
Laennec’s cirrhosis is a type of micronodular liver cirrhosis that is seen in patients with malnutrition, alcoholism, or chronic liver steatosis.
Posthepatitic cirrhosis is a micro- and/or macronodular liver cirrhosis commonly seen in patients with hepatitis C virus or uncommonly B virus.
Postnecrotic cirrhosis is macronodular liver cirrhosis that can arise due to fulminating hepatitis infection or due to toxic liver injury.
Primary biliary cirrhosis (PBC) (vanishing bile duct syndrome) is an autoimmune disease of unknown origin characterized by progressive intrahepatic bile duct, nonsuppurative inflammation, and destruction by T-cell lymphocytes, which leads later on to micronodular liver cirrhosis, hepatomegaly, with greenish-stain liver on gross examination due to bile retention. PBC occurs in middle-aged women in up to 90 % of cases. In symptomatic PBC, patients may complain of jaundice in the first 2–3 years, which develops later into portal hypertension and hepatosplenomegaly. In the asymptomatic PBC, the only symptom is abnormal serum hepatobiliary enzyme levels. PBC is classified pathologically into four main stages. Florid duct stage (stage I PBC) is characterized by vanishing intrahepatic duct and ductopenia due to destruction of the intrahepatic bile duct basement membrane and cellular bodies by lymphocytes. Ductular proliferation stage (stage II) is characterized by small bile ducts proliferation in an attempt to compensate the obstruction of the large bile ducts. The liver characteristically contains few large ducts and many small bile ducts. Scarring (stage III) is characterized by fibrosis and intrahepatic collagen deposition. Hepatic cirrhosis (stage IV) is characterized by architectural hepatic disruption and accumulation of the bile within the hepatocytes. The disease is diagnosed by liver biopsy, plus detecting antimitochondrial antibodies (AMA) in the serum.
Secondary biliary cirrhosis arises due to extrahepatic obstruction of the biliary tree, causing bile stagnation within the liver. This type can be seen in cases of congenital bile duct atresia, chronic biliary stone obstruction, or pancreatic head carcinoma. The inflammation in the secondary biliary cirrhosis arises due to secondary infection of the bile, leading to neutrophilic acute inflammatory reaction. In contrast, PBC is a chronic, autoimmune disease with lymphatic and plasma cell inflammatory reaction.
Cirrhosis due to metabolic disease is seen in glycogen storage diseases, α1-antitrypsin deficiency disease, hemochromatosis, and Wilson’s disease. All the metabolic cirrhoses are micronodular except Wilson’s disease (macronodular).
Cirrhosis due to circulatory disorders is observed in patients with venous congestion due to right-sided heart failure, veno-occlusive disease due to herbal medicine, and Budd–Chiari syndrome. In congestive heart failure, chronic hepatic venous congestion may lead to intrahepatic hypertension, which results in sinusoidal congestion, pressure atrophy, and necrosis of pericentral parenchymal cells. Later, there is a collapse of the necrotic cells with perisinusoidal and periportal collagen deposition (fibrosis) extending to the central veins. These changes are known as “nutmeg liver” on postmortem liver examination.
Cirrhotic nodules are parenchymal nodules found in cirrhotic liver (seen in 25 % of imaging scans only), and they are divided into three main types:
Regenerative nodules represent normal proliferation of liver parenchyma. The development of regenerative nodules can be explained pathologically by cellular repair mechanism known as “cell-to-cell and cell-to-matrix interaction.” Cell-to-cell interaction describes the process of cellular inhibition when two cells touch each other (e.g., skin wound healing). Cell-to-matrix interaction describes the process of cellular proliferation inhibition when the regenerated cells touch the tissue matrix (connective tissue frame). In acute hepatitis, if the connective tissue matrix is preserved, then damage to the liver can be completely repaired without architectural distortion or residuals. In contrast, in chronic hepatitis, both the liver parenchyma and the connective tissue frame are damaged. This matrix damage results in random liver cell regeneration without cell-to-matrix cellular inhibition, which will result in regenerative liver nodule formation with fibrosis in between (liver cirrhosis). These nodules do not function normally because the relationship with the portal vein, hepatic artery, and bile ducts (porta hepatis) is lost.
Dysplastic nodules are regenerative premalignant nodules.
HCC nodules are nodules composed of neoplastic cells and are seen commonly in patients with cirrhosis due to hepatitis C virus.
Patients with cirrhosis are asymptomatic, unless they develop signs of liver failure. Signs of liver failure include yellowish discoloration of the skin (jaundice), development of central arteriole dilatation with radiating vessels on the face (spider nevi), white nail bed due to hypoalbuminemia, painful proliferative arthropathy of long bones, gynecomastia and palmar erythema due to reduced estradiol degeneration by the liver, hypogonadism (mainly in cirrhosis due to alcoholism and hemochromatosis), anorexia and wasting (>50 % of patients), and diabetes mellitus type 2 (up to 30 % of patients). Some patients with liver cirrhosis may develop palmar fibromatosis.
Fibromatosis is a pathological condition characterized by local proliferation of fibroblasts which manifests clinically as soft-tissue thickening. Fibromatosis can affect the palmar aponeurosis (Dupuytren’s contracture), causing limited hand extension and possibly bony erosions (. Fig. 1.1.1). Palmar fibromatosis that occurs in a bilateral fashion and is associated with bilateral plantar fibromatosis is called Ledderhose disease (. Fig. 1.1.1). Other forms of fibromatosis in the body include the male genital fibromatosis (Peyronie’s disease) and fibromatosis of the dorsum of the interphalangeal joint (Garrod’s nodes).

Fig. 1.1.1
An illustration shows the clinical pathological picture of Dupuytren’s contracture with illustrated thickening of the palmar aponeurosis (a) and bilateral plantar nodules representing the clinical manifestation of Ledderhose disease (b)
The development of portal hypertension can result in splenomegaly, ascites, and prominent paraumbilical veins (caput medusae). Multiple intra- and extrahepatic portosystemic collaterals develop to compensate the loss of the large portal venous flow that cannot be maintained longer due to increased intrahepatic venous pressure in portal hypertension. Intrahepatic portosystemic shunts occur when the portal vein communicates with the hepatic vein in or on the surface of the liver through a dilated venous system. In contrast, extrahepatic portosystemic shunts occur when the intrahepatic portal vein runs toward the outside of the liver communicating with the systemic veins. Cruveilhier–Baumgarten syndrome is a condition characterized by patent paraumbilical vein as a consequence of portal hypertension, which occurs as a part of portosystemic shunts. Paraesophageal and paragastric varices develop in patients with advanced liver cirrhosis and can cause life-threatening upper gastrointestinal (GI) bleeding.
Hepatic encephalopathy is a potentially reversible complication seen in advanced liver failure and cirrhosis characterized by motor, cognitive, and psychiatric central nervous system (CNS) dysfunction. Manifestations of hepatic encephalopathy include daytime deterioration (grade 1), disorientation in space (grade 2), or coma (grade 3). Flapping tremor (asterixis) may be seen in patients with hepatic encephalopathy. The neurological manifestations of hepatic encephalopathy are due to inability of the liver to detoxify neurotoxins such as ammonia, phenols, short-chained fatty acids, and other toxic metabolites within the blood. These toxic metabolites cross the blood–brain barrier and deposits within the basal ganglia causing encephalopathy. Hepatic encephalopathy can be induced or exaggerated by sedation, high-protein diet, GI hemorrhage, and the use of diuretics.
Hepatopulmonary syndrome is an end-stage liver disease characterized by pulmonary failure, and it is seen in 15–20 % of cirrhosis patients. The diagnosis of hepatopulmonary syndrome requires the following three criteria: chronic liver disease, increased alveolar–arterial gradient on room air, and evidence of intrapulmonary vascular dilatation. Patients with hepatopulmonary syndrome present with liver cirrhosis with hypoxia (30 % of decompensated liver patients). This hypoxemia occurs due to pulmonary vascular dilatation and subsequent ventilation–perfusion mismatch due to decreased hepatic clearance or increased hepatic productions of circulating cytokines and chemical mediators (e.g., nitric oxide). Hypoxic respiratory failure can occur with cases of massive liver necrosis or fulminant hepatic failure.
Hepatitis C virus–related arthritis (HCVrA) may be seen in patients with liver cirrhosis due to hepatitis C virus. HCVrA affects 4 % of patients with HCV liver cirrhosis, and it has two forms: a frequent symmetrical polyarthritis affecting small joints similar to rheumatoid arthritis in a lesser form and an intermittent mono-/oligoarthritis that involves medium- and large-sized joints.
Signs on Plain Radiographs
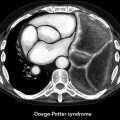
Hepatic hydrothorax is defined as large pleural effusion in a cirrhotic liver disease patient in the absence of cardiac or pulmonary disease. Hepatic hydrothorax is seen in 10 % of patients. The pleural effusion can be right sided (67 %), left sided (17 %), or bilateral (17 %).
Hepatopulmonary syndrome is visualized on plain chest radiographs as reticulonodular interstitial pattern located mainly at the lung bases (46–100 % of cases).
Noncardiogenic pulmonary edema can be seen in 37 % in patients with fulminant hepatic failure.
Esophageal varices may manifest on chest radiographs as focal lateral displacement of the mediastinum.
On abdominal radiographs, ascites is detected as loss of the abdominal gases and the normal psoas shadows visualization. The abdomen structures are blurry due to the overlying fluid shadow (. Fig. 1.1.2).

Fig. 1.1.2
Plain abdominal radiograph in a patient with massive ascites shows complete blurry abdomen
Signs on US
Cirrhosis is detected as irregular nodular liver contour with inhomogeneous echo-texture. Liver right lobe atrophy with enlarged caudate lobe is a typical finding (caudate lobe/right lobe ratio >0.65) (. Figs. 1.1.3 and 1.1.4).
Mixed hypoechoic and hyperechoic texture of the liver parenchyma is detected when regenerative nodules are found.
Signs of portal hypertension include splenomegaly (>12 cm), ascites, and dilated venous collaterals.

Fig. 1.1.3
Transverse ultrasound image of a patient with liver cirrhosis shows atrophied left lobe (white arrowhead), with hypertrophied caudate lobe (black arrowhead)

Fig. 1.1.4
Transverse ultrasound image of a patient with liver cirrhosis due to hepatitis C virus shows irregular liver contour (arrowheads), with two intrahepatic liver hypoechoic masses, which were diagnosed on liver triphasic CT scan later as hepatocellular carcinoma (HCC) masses (arrows)
Signs on Doppler Sonography
Hepatic veins: hepatic veins join immediately the inferior vena cava, which is in direct communication with the left atrium. Due to the previous anatomical fact, the normal hepatic veins waveform is “triphasic,” because it is affected by left atrial cardiac motion and Valsalva maneuver (. Fig. 1.1.5). In patients with cirrhosis, the triphasic flow pattern is converted into biphasic and monophasic depending on the severity of cirrhosis.
Portal vein: it supplies 70–80 % of the incoming blood to the liver, and the hepatic artery supplies only 20–30 %. The normal portal venous flow is always toward the liver (hepatopetal). The fasting mean velocity of normal portal vein is approximately 18 cm/s (range, 13–23 cm/s3), and the flow pattern is normally flat or monophasic (. Fig. 1.1.6). Mildly pulsatile portal venous flow pattern can be seen normally in tall, thin patients (. Fig. 1.1.7). Portal hypertension is detected as hepatic blood flow away from the liver (hepatofugal) due to increased intrahepatic venous flow resistance. Portal vein diameter (>13 mm) and splenic vein diameter (>10 mm) are other signs of portal hypertension. Hepatic vein thrombosis can be seen in patients with HCC, and it is visualized as partial or complete loss of flow signal within the portal vein.
Hepatic artery: the normal hepatic artery in a fasting patient has a systolic velocity of approximately 30–40 cm/s and a diastolic velocity of 10–15 cm/s. The flow pattern normally is monophasic and has low resistance, with high diastolic flow (. Fig. 1.1.8). The resistance index (RI), which is defined as the maximal systolic velocity minus the end-diastolic velocity divided by the maximal velocity, varies normally in a fasting patient from 0.55 to 0.81. There is increase in hepatic artery RI after mean or with age in a healthy person. The hepatic artery diastolic velocity is less than the peak portal vein velocity, and if the hepatic diastolic velocity is greater than the portal vein, one should suspect hepatic parenchymal disease. Also, the RI increases in patients with cirrhosis, and the after meal variation is absent (. Fig. 1.1.9).

Fig. 1.1.5
Color Doppler waveform spectrum of the hepatic veins shows the normal venous triphasic pattern

Fig. 1.1.6
Color Doppler waveform spectrum of the portal vein shows the normal monophasic pattern

Fig. 1.1.7
Color Doppler waveform spectrum of the portal vein shows the physiologic portal vein pulsation in athletic tall patient who came for a routine abdominal ultrasound checkup

Fig. 1.1.8
Color Doppler waveform spectrum of the hepatic artery shows the normal monophasic, low-resistance with high diastolic flow arterial pattern

Fig. 1.1.9
Hepatic artery color Doppler waveform spectrum in a patient with alcoholic liver cirrhosis shows high RI (arrowhead)

Fig. 1.1.10
Color Doppler sonography image shows patent umbilical vein at the level of the umbilicus (arrowheads) in a patient with chronic liver cirrhosis and Cruveilhier–Baumgarten syndrome

Fig. 1.1.11
The same patient shows the connection of the patent umbilical vein to the dilated portal vein through the ligamentum teres (arrowhead)
Signs on Barium Swallow
Esophageal varices are visualized as serpiginous filling defects in the esophagus, usually located in the lower third (. Fig. 1.1.12).

Fig. 1.1.12
Barium swallow (a) and axial thoracic-enhanced CT (b) images in two patients with esophageal varices. In (a), the varices are visualized as serpiginous filling defects in the lower esophagus (arrowheads). In (b), esophageal varices are visualized as multiple paraesophageal enhanced tubular densities adjacent to the esophageal wall (arrows)
Signs on CT
Cirrhotic liver appears small (<15 cm), with atrophied right lobe and enlarged caudate and left lobes. The liver contour is nodular and irregular due to parenchymal atrophy and nodular regeneration (. Fig. 1.1.13).
Regenerative nodules are divided into micronodules (<3 mm in diameter) and macronodules (>3 mm in diameter). They do not enhance in arterial phase because they are supplied mainly by portal vein and enhance like a normal liver parenchyma. Occasionally, they may accumulate iron within them, which will make them seen in noncontrast scans as hyperdense nodules (siderotic nodules), which are typically seen in alcoholic liver cirrhosis.
Dysplastic nodules are siderotic nodules larger than 1 cm. They enhance homogeneously in both arterial and portal phases and are usually not seen in scans. Few nodules may show enhancement in the arterial phase and only differentiated from HCC by biopsy.
Hepatocellular nodule is seen as a hypodense area in nonenhanced CT scan and shows enhancement in the arterial phase, which is the key to HCC diagnosis. Up to 50 % of nodules are not detected in the arterial phase because they behave as a normal liver parenchyma in the triphasic hepatic scan. The nodules become hypodense again in the portal venous phase of the scan (. Fig. 1.1.13).
Portal hypertension can be detected if the portal vein diameter increases (>13 mm). Also, splenomegaly, dilated perisplenic collateral venous channels, and ascites may be found as signs of portal hypertension (. Fig. 1.1.14).
Esophageal varices are seen as multiple, enhanced nodular or tubular densities inside the esophageal lumen (intraluminal varices) or adjacent to the esophageal wall (paraesophageal varices) (. Fig. 1.1.12).
Enlarged porta hepatic lymph nodes might be seen in end-stage cirrhotic liver.
Cruveilhier–Baumgarten syndrome is visualized as an abnormal vein that arises from the right or left intrahepatic portal vein and leaves the liver via ligamentum teres to attach itself to the umbilicus on the portal phase of contrast-enhanced liver CT (. Fig. 1.1.15).
On chest HRCT, hepatopulmonary syndrome is visualized as peripheral pulmonary arteriole dilatation with increased numbers of terminal branches extending to the pleura (. Fig. 1.1.16).
Liver venous hypertension due to congestive heart failure (nutmeg liver) may show characteristic reticulo-mosaic pattern of enhancement on postcontrast examinations (. Fig. 1.1.17).

Fig. 1.1.13
Coronal nonenhanced CT image shows mildly shrunken liver due to cirrhosis with mild irregular contour and hypodense nodule in segment IVb (arrowhead), which was proven later to be HCC

Fig. 1.1.14
Axial CT scan in a patient with liver cirrhosis shows massive ascites that nicely demonstrates ligamentum teres (arrowhead)

Fig. 1.1.15
Sequential axial abdominal enhanced CT of a patient with liver cirrhosis shows patent umbilical vein arises from the left portal vein (a), runs through ligamentum teres (b), and joins the umbilicus (c). The course of the patent vein can be seen in the coronal image in (d)

Fig. 1.1.16
Axial chest HRCT illustration shows multiple dilated peripheral pulmonary arterioles demonstrating hepatopulmonary syndrome in patients with liver cirrhosis

Fig. 1.1.17
Axial (a) and coronal (b) contrast-enhanced CT in a patient with right-sided heart failure due to tricuspid regurgitation shows the characteristic reticulo-mosaic pattern of enhancement of hepatic venous congestion
Signs on MRI
Hepatic encephalopathy has bilateral and symmetrical high-intensity signal on T1W images in the basal ganglia, especially in the globus pallidus (. Fig. 1.1.18). The extent of the basal ganglia disease is related to the plasma level of ammonia. Cerebellar atrophy may be seen in advanced stages.
Regenerated nodules with or without hemosiderin have low T2 signal intensity. In contrast, a hepatic carcinoma nodule appears hyperintense on T2W images and shows early arterial-phase contrast enhancement.
In PBC, periportal hyperintensity signal on T2W images is observed in the initial stages of the disease (stages I and II), reflecting active periportal inflammation (. Fig. 1.1.19). A periorbital halo sign may be seen as low-intensity signal centered around the portal venous branches on T2W images (. Fig. 1.1.19). This sign is specific for the diagnosis of PBC. Lastly, a peripheral small wedge-shaped area may be seen in the early phases of liver contrast study, which represents arterial–portal shunting.
Up to 50 % of uncompensated cirrhotic patients show dilated cisterna chyli, which is seen as high T2 signal intensity structure adjacent to the aorta, with delayed enhancement several minutes after gadolinium injection. This sign is detected on CT in 1.7 % of uncompensated cirrhotic patients.
Plantar fibromatosis is visualized as bilateral infiltrative masses located at the deep aponeurosis adjacent to the plantar muscles in the medial aspect of the foot (. Fig. 1.1.20). The masses typically show low T1 and T2 signal intensities due to the fibrous nature of the lesion. After contrast injection, enhancement of the masses can be seen in approximately 50 % of cases.

Fig. 1.1.18
Axial T1W MR illustration shows bilateral symmetrical high density in the globus pallidus representing sign of hepatic encephalopathy

Fig. 1.1.19
Axial T2W MR illustration of the liver demonstrates the periportal hyperintensity (arrows) and the periorbital halo sign (arrowheads)

Fig. 1.1.20
Axial-oblique T2W (a) and T1W postcontrast MRI of the feet shows bilateral hypointense plantal masses (arrowheads) on image (a) diagnostic of Ledderhose disease (plantar fibromatosis). The masses show marked contrast enhancement after gadolinium injection (b)
Further Reading
Ba-Ssalamah A, et al. Dedicated multi-detector CT of the esophagus: spectrum of diseases. Abdom Imaging. 2009;34:3–18.
Bonekamp S, et al. Can imaging modalities diagnose and stage hepatic fibrosis and cirrhosis accurately? J Hepatol. 2009;50:17–35.
Chavhan GB, et al. Normal Doppler spectral-waves of major pediatric vessels: specific patterns. Radiographics. 2008;28:691–706.
Colli A, et al. Severe liver fibrosis or cirrhosis: accuracy of US for detection – analysis of 300 cases. Radiology. 2003;227:89–94.
Ito K, et al. Imaging findings of unusual intra- and extrahepatic portosystemic collaterals. Clin Radiol. 2009;64:200–7.
Kobayashi S, et al. MRI findings of primary biliary cirrhosis: correlation with Scheuer histologic staging. Abdom Imaging. 2005;30:71–6.
Lim JH, et al. Regenerative nodules in liver cirrhosis: findings at CT during arterial portography and CT arteriography with histopathologic correlation. Radiology. 1999;210:451–8.
Martinez-Noguera A, et al. Doppler in hepatic cirrhosis and chronic hepatitis. Semin Ultrasound CT MR. 2002;23:19–36.
Mauro MA, et al. Computed tomography of hepatic venous hypertension: the reticulated – mosaic pattern. Gastrointest Radiol. 1990;15:35–8.
Meyer CA, et al. Diseases of the hepatopulmonary axis. Radiographics. 2000;20:687–98.
Palazzi C, et al. Hepatitis C virus-related arthritis. Autoimmun Rev. 2008;8:48–51.
Schuppan D, et al. Liver cirrhosis. Lancet. 2008;371:838–51.
Sharma S, et al. MRI diagnosis of plantar fibromatosis – a rare anatomic location. Foot. 2003;13:219–22.
Verma SK, et al. Dilated cisternae chyli: a sign of uncompensated cirrhosis at MR imaging. Abdom Imaging. 2009;34:211–6.
1.2 Fatty Liver Disease (Liver Steatosis)
Accumulation of lipid within cells is a pathologic process. Any type of lipid can accumulate within cells, such as cholesterol, triglycerides, and phospholipids. Fatty liver disease (steatosis) is characterized by accumulation of triglycerides within hepatocytes.
Normally, free fatty acids are taken up by the hepatocytes and then converted into cholesterol esters, triglycerides, ketone bodies, or phospholipids. Some of the lipids combine with apoproteins to form a specific type of lipoprotein called very-low-density lipoprotein (VLDL), which is then secreted into the blood. Liver steatosis can result from either excess delivery of free fatty acids into the liver (e.g., diabetes mellitus), increased formation of lipids within the liver (e.g., alcohol ingestion), hepatocytes disease (e.g., hepatitis), or decreased formation of VLDL by the liver (e.g., protein malnutrition).
Types of Liver Steatosis
Diffuse fatty infiltration: the liver is usually enlarged with uniform decrease in density in the liver scan.
Focal fatty infiltration: there is an area of the liver that shows fatty infiltration while the rest of the liver is normal. It usually occurs in the same areas that are supplied by the third inflow systemic veins (porta hepatic, around ligamentum teres, and adjacent to gallbladder). It is seen most commonly in the left lobe of the liver.
Multiple fatty infiltrations: there are scattered low-density areas within a normal density liver. This type can be easily mistaken with metastases on noncontrast-enhanced liver CT scan.
Focal sparring: there are areas of normal liver parenchyma surrounded by large areas of low-density diffuse fatty infiltration. This type also may simulate neoplasms on noncontrast-enhanced liver CT scan.
Signs on US
Fatty liver is visualized as highly echogenic liver. The high liver echogenicity can be compared to the echogenicity of the right renal cortex, which will show marked difference in echogenicity (. Fig. 1.2.1).
Focal fatty infiltration is seen as a focal, highly echogenic area within a relatively isoechoic (normal) liver parenchyma (. Fig. 1.2.2).
Focal sparring is seen as a focal area which is relatively hypoechoic (normal) within a highly echogenic liver.

Fig. 1.2.1
Transverse ultrasound image of the liver shows diffuse increase in liver echogenicity compared to the right renal cortex (liver steatosis)

Fig. 1.2.2
Transverse ultrasound image of the liver shows focal fatty infiltration involving segment VI and segment VII
Signs on CT
Hepatic steatosis is detected as diffuse or focal reduction of the liver normal density on noncontrast-enhanced scan (. Fig. 1.2.3). The normal liver density is 8 HU (Hounsfield unit) above that of the spleen (60 HU). Fatty liver density is 10 HU below spleen density on noncontrast-enhanced scan (if the normal spleen is 52 HU, then the fatty liver is <42 HU).
Focal fatty infiltration is seen as a hypodense area with nonspherical margins (metastases usually have round edge). The hypodense area or the mass does not show mass effect over the parenchyma around it and shows change over time (seen in films before the current scan or after few months’ scan). The same criteria are applied to the focal sparring, but the mass will be isodense within a hypodense liver on noncontrast-enhanced scan.
In both focal sparring and focal fatty infiltration, hepatic vessels course within the fatty infiltration or focal sparring undisturbed. In contrast, metastases or other hepatic lesions will be cutting off the hepatic vessels when they reach them.

Fig. 1.2.3
Axial precontrast (a) and postcontrast (b) abdominal CT images show diffuse hepatic steatosis. Notice the density of the liver compared to the spleen in pre- and postcontrast images
Signs on MRI
Liver steatosis is diagnosed on MRI when the liver intensity drops to >30 % difference on both T1W in-phase and T1W out-of-phase images (. Fig. 1.2.4).

Fig. 1.2.4
Axial T1W in-phase (a) and T1W out-of-phase (b) MRI in a patient with liver steatosis shows drop in the liver signal intensity >44 % in the T1W out-of-phase image (b), diagnostic of hepatic steatosis
Further Reading
Alpern MB, et al. Focal hepatic masses and fatty infiltration detected by enhanced dynamic CT. Radiology. 1986;158:45–9.
Cassidy FH, et al. Fatty liver disease: MR imaging techniques for the detection and quantification of liver steatosis. Radiographics. 2009;29:231–60.
Karcaaltincaba M, et al. Imaging of hepatic steatosis and fatty sparing. Eur J Radiol. 2007;61:33–43.
Sabir N, et al. Correlation of abdominal fat accumulation and liver steatosis: Importance of ultrasonographic and anthropometric measurements. Eur J Ultrasound. 2001;14:121–8.
Salmonson EC, et al. Focal periportal liver steatosis. Abdom Imaging. 1993;18:39–41.
Yates CH, et al. Focal fatty infiltration of the liver simulating metastastic disease. Radiology. 1986;159:83–4.
1.3 Recurrent Epigastric Pain
Epigastric pain is a term used to describe dull achy pain located at the area of the epigastrium beneath the xyphoid process. Epigastric pain is a very common complaint encountered in both medical and surgical casualty departments. Diagnosis often is established by proper history, examination, and laboratory investigations. This topic discusses some causes of recurrent epigastric pain, in which radiology can play an important role in establishing the underlying diagnosis.
Gastroesophageal Reflux Disease
Gastroesophageal reflux disease (GERD) is a disease characterized by reduction of the lower esophageal sphincter pressure resulting in leaking of the stomach acidity into the lower third of the esophagus, causing esophagitis and epigastric pain.
The most common cause of GERD is hiatus hernia. Four types of hiatus hernias are known: sliding, paraesophageal, sliding and paraesophageal, and complete stomach herniation into the thorax.
Patients with GERD typically present with long-standing mild to moderate epigastric pain with burning sensation, usually postprandial. Severe cases of GERD may manifest due to propagation of gastric acidity to the upper esophagus. Symptoms like aspiration pneumonia, laryngitis, and teeth decay may be seen uncommonly due to advanced GERD. Medical treatments include antacids, histamine (H2) blockers, and proton pump inhibitors. Surgical management with gastric fundoplication is usually advised in cases where the medical therapy fails to control the symptoms.
Barium swallow is the most sensitive method to detect GERD and esophagitis. Esophagitis is defined as defects in the esophageal mucosa due to exposure to the gastric reflux acid and pepsin. Barrett’s esophagus (BS) is a condition characterized by esophageal mucosal healing in a persistent acid environment. This healing process is characterized by metaplasia of the normal esophageal stratified squamous epithelium into columnar, gastric-like epithelium. Metaplasia is transformation of one cell type to another (e.g., cuboidal cell to columnar cell). BS has the potential for neoplastic transformation. Up to 50 % of patients with GERD show esophageal dysmotility disorders (EDM).
On barium swallow, sliding hiatus hernia is detected by identifying Schatzki ring. An esophageal ring is a short annular narrowing of the esophagus <1 cm in diameter. Esophageal A ring is a ring made up of smooth muscles that is seen at the tubulovestibular junction (muscular ring). Esophageal B ring (Schatzki ring) is an esophageal ring that is only visible radiologically when there is sliding hiatus hernia and is caused by propagation of the gastroesophageal junction above the diaphragm. Esophageal C ring is the normal abdominal retroperitoneal esophageal part (3 cm long) which makes a groove on the liver. In contrast to esophageal ring, esophageal stricture is defined as an esophageal segment with fixed narrowing. Esophageal web is an abnormal thick 1–2 mm diaphragm-like membrane that extends partially or completely around the esophageal lumen and always indents the esophagus anteriorly. The lower esophageal sphincter line where mucosal change is observed between the esophagus and the stomach on barium examination is sometimes referred to as the Z–line.
Esophageal dysmotility disorders are a group of diseases characterized by abnormal esophageal peristalsis seen on barium swallow. Types of EDM are tertiary contractions, corkscrew esophagus, esophageal achalasia, esophageal chalasia, and presbyesophagus.
Tertiary esophageal contraction is a nonpulsatile, uncoordinating contraction of the esophageal circular smooth muscles. The normal primary and secondary contractions of the esophagus help to push the food and fluids through the esophagus. This type of dysmotility is often seen with old age or GERD. Corkscrew esophagus is a term used to describe the same dysmotility as in tertiary contractions but arises posterior to the heart, causing pain in the retrocardiac region during swallowing. Esophageal achalasia is a disease characterized by contraction and narrowing of the esophagus due to a defect in the normal neuronal plexuses within the esophageal muscles, which results in failure of the smooth muscles to relax when the food arrives. Achalasia is commonly seen in the lower third of the esophagus. Achalasia can occur without prior cause (primary) or due to underlying pathology like Chagas’ disease or malignancy (secondary). Esophageal chalasia is characterized by dilatation and widening of the gastroesophageal junction. Presbyesophagus is an asymptomatic condition characterized by failure of the primary peristaltic wave to pass completely through the esophagus, resulting in a combination of tertiary contractions, aperistalsis, and failure of the lower esophageal sphincter to contract (curling phenomenon).
Hiatus hernia can be congenitally seen in neonates and children. The most common congenital hiatal hernias are Morgagni and Bochdalek’s hernias. Morgagni hernia is stomach or bowel herniation into the thorax due to diaphragmatic defects that occurs in the anterior/inferior mediastinum. Bochdalek’s hernia is stomach or bowel hernia into the thorax due to diaphragmatic defects that occurs in the inferior/posterior mediastinum.
Differential Diagnoses and Related Diseases
Steakhouse syndrome is a term used to describe acute food impaction of the esophagus, usually at its distal third. The most common cause of food impaction is esophageal webs. Patients often present to the emergency ward with acute esophageal food impaction, especially after meat ingestion, where the name came from. Patients present with intense retrosternal pain, which may be cardiac in origin, especially if the impacted food presses over the posterior cardiac border. Plain chest radiographs should be performed to exclude bony material impaction or signs of pulmonary aspiration.
Plummer–Vinson syndrome (Paterson–Kelly syndrome) is a disease characterized by dysphagia, iron-deficiency anemia, and esophageal webs. Patients are commonly women (85 %), between 30 and 70 years of age. Upper aerodigestive tract carcinoma is seen in 4–16 % of cases, with almost all cases occurring at the postcricoid location.
Signs on Chest Radiographs
Hiatal hernia is diagnosed by finding the stomach bubble within the thorax, rather than under the left hemidiaphragm (. Fig. 1.3.1).
Morgagni hernia is demonstrated as a mass, bowel loop, or stomach bubble lying in the inferior/anterior mediastinum on lateral radiographs (. Fig. 1.3.2). In contrast, Bochdalek’s hernia is demonstrated as mass, bowel loop, or stomach bubble lying in the inferior/posterior mediastinum on lateral radiographs (. Fig. 1.3.3).
In esophageal achalasia, there is paramediastinal shadow (widening of the mediastinum), with air–fluid level seen in the retrocardiac shadow (. Fig. 1.3.4).

Fig. 1.3.1
Posteroanterior plain chest radiograph shows herniated stomach into the thorax with the gastric bubble observed in the thorax (arrowhead)
Fig. 1.3.2
Posteroanterior (a) and lateral (b) plain chest radiographs show right mediastinal mass on (a), which is seen located within the anterior/inferior mediastinum on lateral radiographs (arrows). The patient is a child, and the mass was omental and bowel herniation due to an anterior congenital diaphragmatic defect (Morgagni hernia)

Fig. 1.3.3
Posteroanterior (a) and lateral (b) barium enema radiographs in a baby with Bochdalek’s hernia show herniation of part of the transverse colon through a posterior/inferior diaphragmatic defect (b)
Fig. 1.3.4
Posteroanterior (a) and lateral (b) plain chest radiographs in a patient with achalasia show mild widening of the mediastinum and air–fluid level behind the cardiac silhouette (arrowheads), representing fluid content within the dilated esophagus
Signs on Barium Swallow
In esophagitis, there is mucosal granularity, thickened mucosal folds due to edema, and linear ulcers seen as linear barium defects. Stricture formation is a sign of chronic ulceration (. Fig. 1.3.5).
Diagnosis of hiatal hernia depends upon identification of the gastroesophageal junction, which is typically located at the termination point of the converging gastric mucosa. Schatzki’s ring is seen as a uniform round esophageal narrowing with a distended small pouch representing the herniated stomach above the diaphragm (. Fig. 1.3.6). Herniation of the gastric fundus or body into the thorax is a definite sign of hiatus hernia. Esophageal webs are identified as incomplete esophageal narrowing located anteriorly.
Barrett’s esophagus is divided into two types: short-segment and long-segment BS. Short-segment BS is characterized by mucosal metaplasia <3 cm above the gastroesophageal junction, whereas long-segment BS is mucosal metaplasia >3 cm above the gastroesophageal junction. BS is classically suspected when multiple lower esophageal mucosal ulcerations, mid-esophageal stricture, and hiatal hernia are found. The explanation of such suspicion lies in the fact that the new gastric epithelium secretes acid, which causes regional ulcers and esophageal stricture later on. A reticular ringlike pattern of ulceration above the gastroesophageal junction, which mimics areae gastricae, is a relatively specific sign of BS (. Fig. 1.3.7).
In tertiary contractures, the esophagus wall is irregular with fine, multiple contractions that run in a wavy appearance (. Fig. 1.3.8).
In achalasia, there is narrowing of the distal esophagus with dilation of the esophagus proximal to the narrowing, giving the so-called mouse-tail appearance (. Fig. 1.3.9).
In Plummer–Vinson syndrome, anterior transverse linear esophageal filling defects (webs) with focal esophageal stenosis and poststenotic dilatation are typically found (. Fig. 1.3.10).

Fig. 1.3.5
Barium swallow examinations show patients with esophagitis. In patient (a), there is mucosal granularity with thickened mucosal folds (arrowheads). In patient (b), there is stricture seen at the distal end of the esophagus (arrow)

Fig. 1.3.6
Barium swallow image at the distal third of the esophagus in a patient with hiatus hernia shows Schatzki’s ring (arrowheads), with the herniated part of the stomach beneath it (black arrow)

Fig. 1.3.7
Barium swallow image at the gastroesophageal junction shows the specific pattern multiple ringlike ulcers and stricture of the esophagus >3 cm above the gastroesophageal junction (long-segment Barrett’s esophagus (BS))

Fig. 1.3.8
Barium swallow image shows the classical appearance of esophageal tertiary contractures as irregular, multiple contractions that run in a wavy appearance

Fig. 1.3.9
Barium swallow (a) and enhanced CT image (b) of two patients with achalasia shows the classical “mouse-tail” appearance in patient (a) (arrowhead) and prestenotic dilatation with fluid residual in patient (b) (arrow)

Fig. 1.3.10
Lateral barium swallow image in a patient with Plummer–Vinson syndrome shows multiple anterior esophageal webs (arrowheads) with esophageal poststenotic dilatation
Signs on CT
Hiatus hernia is demonstrated by the stomach fundus or body lying within the posterior mediastinum (. Fig. 1.3.11).
Morgagni hernia is seen as the stomach or bowel within the anterior/inferior mediastinum, whereas Bochdalek’s hernia is seen as the stomach or bowel within the posterior/inferior mediastinum.
Esophagitis is visualized as uniform, circumferential wall thickening of the esophagus with a target sign formation.

Fig. 1.3.11
Axial (a) and coronal (b) enhanced CT images show herniation of the stomach into the posterior mediastinum (behind the heart and anterior to the vertebral column) through the esophageal hiatus (hiatus hernia)
Peptic Ulcer Disease
Peptic ulcer is a disease characterized by mucosal ulceration of the esophagus, stomach, or duodenum. Erosion is defined as an area of mucosal destruction that does not extend beyond the muscularis mucosae into the submucosa, whereas ulcer is defined as an area of mucosal destruction that extends beyond the muscularis mucosae into the submucosa or serosa (in perforation).
The gastric mucosa is divided into three types: cardiac mucosa, body-type (oxyntic) mucosa, and antral (pyloric) mucosa. The body-type mucosa contains parietal (oxyntic) cells that secrete hydrochloric acid and intrinsic factor and chief cells that produce lipase and the proteolytic enzymes pepsinogens I and II. The antral mucosa contains endocrinal cells that produce gastrin (G cells), somatostatin (D cells), histamine (ECL cells), and serotonin (enterochromaffin cells).
The main defensive mechanism against the harmful effects of the acid is the production of the mucus layer. Defects in the mucus layer result in gastritis and peptic ulceration.
Peptic ulcer initially starts as inflammation of the gastric mucosa (gastritis), which, when not properly treated, can progress into gastric ulcer. Causes of gastric ulcers include severe stress situations like burns (Curling ulcer), increased intracranial pressure (Cushing ulcer), alcoholism, cocaine abuse, nonsteroidal anti-inflammatory drug (NSAID) abuse, and bile salt reflux into the stomach in patients with gastroduodenostomy (Billroth I) and gastrojejunostomy (Billroth II).
Peptic ulcer disease and gastritis are linked to infection of the gastric or duodenal wall with Helicobacter pylori, a spiral-shaped gram-negative bacterium which is normally found in the gastric antrum. H. pylori gastritis is found in up to 80 % of patients with peptic ulcers.
Zollinger–Ellison syndrome (ZES) is a disease characterized by severe gastric ulcers due to parietal cell hyperplasia in the body and the fundus of the stomach, mostly due to gastrinomas (>80 %). Gastrinomas are gastrin-producing, non-B islet cell tumors that are commonly found within the gastrinoma triangle. The gastrinoma triangle is formed by a line joining the confluence of the cystic and common bile ducts superiorly, the junction of the second and third portion of the duodenum inferiorly, and the junction of the neck and body of the pancreas medially. Up to 25 % of gastrinoma cases are part of multiple endocrine neoplasia (MEN) syndrome type I, an autosomal dominant disorder with tumors of the parathyroid glands (87 %), pancreas (81 %), and pituitary gland (65 %). Ulcers are detected in the first part of the duodenum in 75 % of patients with ZES.
Radiological manifestations of gastric ulcer disease are defined according to the stage of the ulcer. There are signs of acute and chronic ulcers. The usual techniques to detect mucosal abnormalities are the double contrast barium meal and modern virtual gastroscopy. Virtual gastroscopy is a three-dimensional (3D) reconstruction rendering technique that uses multiplanar CT sections to reconstruct 3D images of the stomach interior that mimics the images seen in upper gastrointestinal endoscopy of the stomach.
Signs on Plain Radiograph
The sign of gastrointestinal or peptic ulcer perforation is usually diagnosed by the presence of free air under the diaphragm on erect abdominal or chest films (pneumoperitoneum) (. Fig. 1.3.12).

Fig. 1.3.12
Anteroposterior plain abdominal radiograph shows collection of air under the right diaphragm due to duodenal ulcer perforation (arrowheads)
Signs on US
In up to 30 % of cases, perforation of a peptic ulcer does not show free pneumoperitoneum but instead penetrate adjacent structures (confined perforation). In suspected cases of perforation, a sonogram of the epigastric region may show an extra-luminal inhomogeneous fluid collection seen within the subhepatic space. This fluid collection represents gastric contents leakage.
The stomach wall is usually thickened, and the stomach is atonic, dilated, and maybe fluid filled due to gastric outlet obstruction.
The presence of high echoic areas within the inhomogeneous fluid collection representing air is a pathognomonic finding of perforation.
Signs of Acute Ulcer on Barium Meal
Ring sign: the mucosal edge of the ulcer is covered with barium while the center is not.
Arc sign: it occurs when the barium covers part of the ulcer’s edge (. Fig. 1.3.13).
Smudge sign: shallow smudge barium spot represents the area of mucosal ulceration (. Fig. 1.3.13).
Prominent area gastrica: it is an area of columnar epithelium located in the stomach antrum, which is normally seen as 2–3 mm, sharply edged, polygonal radiolucencies on double barium meal. Prominent area gastrica suggests the possibility of H. pylori gastritis.
In ZES, there are markedly thickened mucosal folds (Rugae), mainly found in the body and the fundus of the stomach.

Fig. 1.3.13
Barium meal images of the duodenum in two different patients show duodenal acute ulcer arc sign in patient (a) (arrowhead) and smudge sign in patient (b) (arrow)
Signs of Chronic Ulcer on Barium Meal
Ulcer crater sign: it is seen as a round area filled with barium, with gastric folds radiating from the crater due to fibrosis. This sign arises due to deep chronic ulcer’s edge that mimics a volcano crater.
Incisura: it is a fold in the greater curvature due to stricture of the mucosal folds around an ulcer. Incisura may be found as a normal finding in double contrast barium enema as an area of angulation of the lesser curvature (. Fig. 1.3.14).
Meniscus sign: the mucosa around the ulcer’s crater makes a halo due to edema of the mucosa (. Fig. 1.3.15).

Fig. 1.3.14
Barium meal image in a patient with normal examination shows the incisura (arrowhead)

Fig. 1.3.15
Barium meal image of the duodenum in a patient with chronic duodenal ulcer shows the meniscus sign (arrowheads)
Signs on Virtual CT Gastroscopy
The images can be viewed on multiplanar reformation (MPR) images or on 3D reconstructed images.
In benign ulcers, there is thickening of the stomach wall with preservation of the wall stratification. Mild enhancement may be seen after contrast injection.
In malignant ulcers, there is marked wall thickening, with strong enhancement more than the adjacent normal gastric wall after contrast injection.
Signs on Conventional CT and MRI
Gastritis and H. pylori infection is detected as a marked thickening and nodularity of the stomach wall, especially in chronic gastritis (. Fig. 1.3.16). Biopsy of the nodules by endoscopy is important to exclude malignancy transformation. Up to 80 % of patients with stomach cancers that arise outside the cardia have positive antibodies against H. pylori.
In ZES, there is a hypodense nodule with or without calcification often seen in the duodenum or the pancreas on nonenhanced images. After contrast injection, gastrinoma shows intense contrast enhancement in the arterial phase (. Fig. 1.3.17). Liver metastasis may be seen. On MRI, gastrinoma shows low T1 and high T2 signal intensities with marked contrast enhancement on the early arterial phase of the scan.

Fig. 1.3.16


Axial CT illustration demonstrates thickening of the stomach wall with nodularity as a sign of chronic gastritis (arrowheads)
Related posts:
Stay updated, free articles. Join our Telegram channel
Full access? Get Clinical Tree
