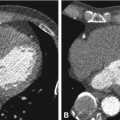
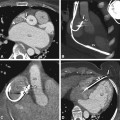
Fig. 9d.1
ECG electrode placement. Panel A shows a scanogram depicting the recommended ECG lead placement for best signal clarity. If the signal is low or the QRS peak is not noticeably stronger than the other ECG wave segments, using one of the two alternate positions (Panels B and C) may improve the ECG signal and its detection
9.2.2 ECG Monitor
Turn on the ECG machine and make sure that there are good connections to the gantry and leads. A good connection is confirmed if “CONNECTED” appears in the upper right display area of the monitor. Otherwise, check to make sure that the cable connecting the ECG machine to the backside of the gantry is plugged in properly and that the same cable is connected to the ECG machine. In case of low signal, check the electrode placement and choose an alternative position if needed (Fig. 9d.1). If there is “noise” within the ECG wave, it is recommended that you do not scan until this condition is corrected.
9.3 Scan Preparation
9.3.1 Breathing Instructions
Prior to the scan, have the patient practice the automatic breathing instructions. Scanning is sufficiently rapid that it is not necessary for the patient to hyperventilate. The scanning time should be no longer than 5–8 s on average. Let the patient take one breath in, blow it out, then take a breath in and hold it, while you watch the ECG monitor and take note of the patient’s heart rate during breath-holding. A patient who has any difficulty holding his or her breath may be put on 2–4 l min−1 of oxygen via a nasal cannula. Oxygen administration may also help to lower the heart rate.
When recording the breathing instructions for cardiac CT that are programmed in the scanner, make sure to give the breathing instructions slowly. The breathing instructions should be no shorter than 10 s. When recording the instructions, and after you say, “take a breath in and hold it,” be sure to wait for 3–5 s (of silence) prior to clicking on the “stop recording” button. This delay will give the patient enough time to hold his or her breath before the actual start of the scan and for the heart rate to stabilize; otherwise the patient may still be breathing in during the first several slices, which could lead to motion artifacts on the images.
9.3.2 Scout Scans
The following steps, summarized in List 9d.1, should be performed to choose the correct scan protocol and to acquire the scout scans.
List 9d.1. Choice of protocol and scout acquisition
1.
Landmark the patient at the sternal notch
2.
Select “new patient” and enter patient data
3.
Select the anatomical area (chest)
4.
Select the snapshot (cardiac) protocol from the main menu
5.
On the scout screen, check to make sure you are in “Active Gating” mode and that the gating is fine, then take the scout views
6.
Use the cardiac breathing protocol for the scout scans and all subsequent scans (Fig. 9d.2)
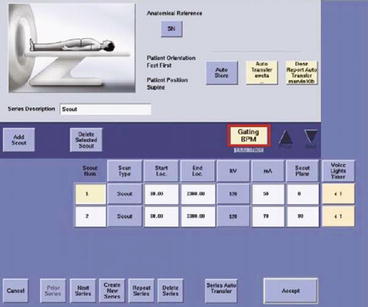

Fig. 9d.2
Planning the scout (scanogram) acquisition. Make sure that “Active Gating” (see red frame) has been selected when taking the two scout views (AP and lateral). The cardiac breathing protocol should be used for the scout scans and all subsequent scans
7.
Monitor the patient’s heart rate during the breath-holda
8.
When the two scout scans are completed, select “next series” to display the next step of the protocol
a The body’s natural physiologic response during breath-hold is to reduce the heart rate by approximately 5 beats per min. Knowing what the patient’s heart rate does during the breath-hold will help you determine what scanning mode to use during the cardiac scan (Fig. 9d.3).
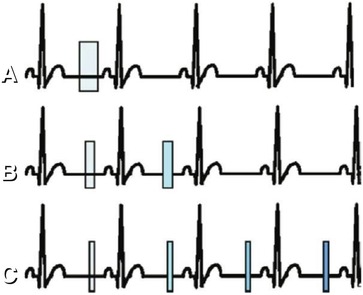

Fig. 9d.3
Alternative retrospective cardiac reconstruction methods. Panel A shows the “SnapShot Segment Mode” (halfscan): heart rate, 30–74 beats per min; one sector; reconstruction window, 175 ms; a retrospectively gated reconstruction using data from 2/3 of a gantry rotation to create an image from one cardiac cycle. Panel B shows the “SnapShot Burst Mode” (multisegment): heart rate, 75–113 beats per min; two sectors; reconstruction window, ~87 ms; a retrospectively gated reconstruction using data from up to two cardiac cycles within the same cardiac phase to create an image at a given table/anatomic location. Panel C shows the “SnapShot Burst Plus Mode” (multisegment): heart rate, >113 beats per min; two, three, or four sectors; reconstruction window, 44 ms; stable heart rates; a retrospectively gated reconstruction using data from up to four cardiac cycles within the same cardiac phase to create an image at a given table/anatomic location
If the heart rate is not displayed on the screen and you have a “red” gating box, the scanner is not reading the patient’s waveform. To correct this problem, try the following: (1) click on the red “Gating” box and turn off the gating, then turn it back on; (2) check all connections between the gantry and the ECG machine; and (3) check once again for proper placement of the leads on the patient.
9.4 Scan Modes, Bolus Timing, and Image Acquisition
9.4.1 CT Coronary Angiography Scan Modes
There are three different modes for retrospectively gated reconstruction that can be used for image acquisition, depending on the patient’s heart rate. These modes are described in Fig. 9d.3. Alternatively, in patients with low and stable heart rates, prospectively ECG-gated (i.e., triggered) axial acquisitions (nonhelical) can also be performed; this approach has the advantage of reducing the radiation exposure.
9.4.2 Bolus Timing
To calculate the exact arrival time of the contrast medium in the coronary arteries, the test bolus protocol described in Table 9d.1 is recommended. View the scout and place an axial monitoring scan 1 cm below the carina. If a noncontrast localizer series was previously done (e.g., for calcium scoring), you may also scroll through these images and determine the location for the axial monitoring scan by manually typing the location into the View/Edit screen.
Table 9d.1
Parameters of the test bolus scan
Parameter | Value |
|---|---|
Rotation time | 0.5 s |
Interval | 0 |
Thickness | 5 mm |
Prep delay | 5 s |
Interscan delay | 1.5 s |
SFOV | Large |
DFOV | 25 cm |
kV | 120 |
mA | 40 |
No. of scans | 14 |
Contrast agent amount | 15 ml |
Injection rate | 5 ml s−1, or the same injection rate as for the cardiac angiogram |
If you have a dual-head injector, it is recommended that you follow the contrast test bolus with a 20-ml saline chaser. Scan the patient with the cardiac breathing protocol and note the heart rate during the scan.
Once all of the test bolus images are reconstructed, highlight the view port in which they are loaded, select the measurement icon on the “Exam Rx Desktop,” then select “MIROI” (Multi-Image Region of Interest). Select the elliptic ROI from the pop-up box on the screen, and place the ROI in the ascending aorta and size it to fit completely within the aorta. Then click OK on the pop-up box and calculate the bolus arrival time as described in Fig. 9d.4. Click on “Next series” to display the gated cardiac helical acquisition protocol. Enter in the prep delay, based on the test bolus. Alternatively, a bolus tracking technique can be selected by clicking on “Smart Prep.” For bolus tracking, a threshold of 120–150 HU is recommended for initiation of the subsequent helical scan (Fig. 9d.5).
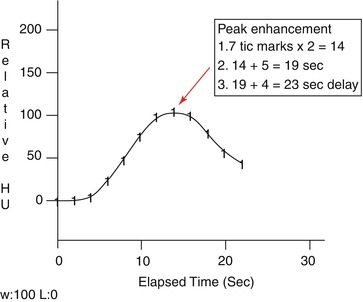
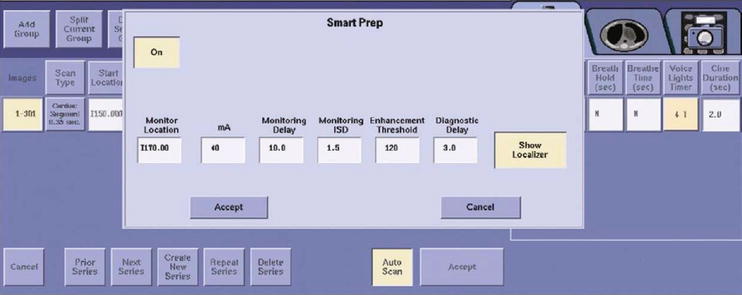

Fig. 9d.4
Time-to-peak curve derived from the test bolus acquisition. On the graph image, count each tic mark on the line graph to the peak of the curve, multiply the number of tic marks by 2, and then add 5 s. Remember that image no. 1 is at 5 s and the tic marks are 2 s apart. This time represents the time it takes for the contrast agent once injected to reach the root of the aorta, where the coronary arteries arise (time-to-peak enhancement). Once you have the time-to-peak enhancement, add an additional 4 s (to allow for filling of the distal coronary vessels); this number is now the pre-scan delay or prep group delay for the cardiac CT exam. In brief, prep delay is calculated as follows: (number of tic marks × 2) +5 s +4 s; alternatively, it can be expressed as: peak +9 s. This bolus time is a key parameter to use for the gated cardiac acquisition

Fig. 9d.5
Choosing the parameters for bolus tracking (“Smart Prep”). An enhancement threshold of 120–150 HU is recommended
9.4.3 Image Acquisition
Prescribe the location of the scan on the scout using graphic Rx, or type in the start and end locations using explicit Rx, on the basis of the noncontrast localizer images. Use the scan parameters described in Table 9d.2. Choose detector coverage, helical thickness, and rotation time as shown in Fig. 9d.6.
Table 9d.2
Image acquisition parameters
