Introduction
A continuous electrocardiogram, whether from a Holter recording, an intensive care unit monitor, an overnight polysomnogram, or even a short-term recording, provides a signal that can yield information about the morphology and time of onset of each heartbeat. This information, exported as a “beat file” provides the basis for multiple ways of quantifying and categorizing heart rate variability (HRV), in most cases based on intervals between normal to normal (N-N) heartbeats only. The various methods for quantifying HRV (eg, time domain, frequency domain, nonlinear) and their relationship to cardiac autonomic function have been described in multiple excellent reviews elsewhere.1-3 Less appreciated is the power of using graphical images, also derived from beat files, to obtain information about normal and abnormal cardiac autonomic function, sinus node function, and sleep-disordered breathing.
The periods between successive heartbeats can be converted to a time series of instantaneous heart rates (60,000 milliseconds in a minute/time between beats in ms). Heart rate (HR) patterns can be examined on multiple scales, each providing both unique and overlapping information. HR itself can be plotted on a beat-by-beat basis, or HR averages and ranges over longer periods can be plotted. Power spectral analysis can mathematically deconstruct heartbeat patterns into their underlying rhythmic components using fast Fourier transforms (FFTs).3 The structure of heartbeat patterns can be examined using Poincaré plots, which are plots of the interval between every pair of successive beats versus the next pair.
The current review will illustrate the types of information potentially available from these aspects of graphical HRV analysis (ie, 5-minute averaged HR patterns, hourly power spectral analysis, hourly Poincaré plots, and beat-by-beat HR tachograms). To accomplish this, we will primarily use representative plots from recordings selected from our database of subjects with and without known cardiovascular disease. From among the healthy subjects, we will examine graphical HRV in a younger adult with high HRV (the standard deviation of all normal-to-normal interbeat intervals [SDNN] = 198), an older adult with high HRV (SDNN = 167), and an older adult with low HRV (SDNN = 65). From among those with known cardiovascular disease, we will examine graphical HRV in a subject with very low HRV but normal HR patterns (SDNN = 63), a subject with periods of abnormal HR patterns (SDNN = 99), a subject with significant sleep-disordered breathing HR patterns (SDNN = 49), and a subject with atrial fibrillation (SDNN = 211).
Information from 5-Minute Averaged HR Patterns
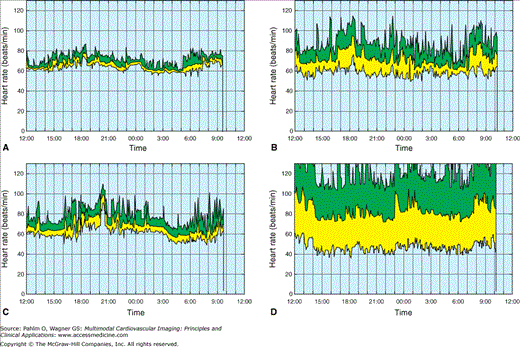
Commercial Holter scanner reports often show plots of 5-minute averaged HR patterns. The presence or relative absence of a circadian rhythm of HR is clearly visible on these plots. Under normal circumstances, a clear decrease in HR during the night, a distinct rise in HR on awakening, and a relatively higher HR during the daytime are seen. Lack of circadian rhythm of HR is the primary determinant of low values for total HRV and suggests severe autonomic dysfunction and/or a complete lack of physical activity. In Fig. 16–1, the average HRs and their ranges for every 5 minutes are shown for four healthy subjects. The circadian rhythm of HR can be appreciated qualitatively by following the center line of the plots. A qualitatively normal circadian rhythm is clearly seen for the younger subject (see Fig. 16–1A) and the older subjects with high HRV (see Fig. 16–1B) and average HRV (see Fig. 16–1C), and approximate bed and wake times can be seen from the decrease in HR in the evening and the sharp increase in the morning, but in the older adult with low HRV (see Fig. 16–1D), circadian rhythm is markedly attenuated and bed time is less clear.
Figure 16–1.
Plots of 5-minute average heart rate and maximum and minimum heart rate for each 5 minutes in (A) a young healthy man with high heart rate variability (HRV), (B) an older healthy man with high HRV, (C) an older healthy man with average HRV, and (D) an older man with low HRV. Green is heart rates above the average. Yellow is hearts below the average.
Figure 16–2 shows 5-minute averaged HR plots for subjects with known cardiovascular disease. The patients in Fig. 16–2A,B have a diminished circadian rhythm, but a circadian rhythm is clearly visible in Fig. 16–2C. No circadian rhythm for HR is visible for the subject with atrial fibrillation (see Fig. 16–2D).
Figure 16–2.
Plots of 5-minute average heart rate and maximum and minimum heart rate for each 5 minutes in (A) a cardiac patient with low heart rate variability (HRV), (B) a cardiac patient with abnormal HRV, (C) a cardiac patient with sleep-disorder breathing heart rate patterns, and (D) a cardiac patient with atrial fibrillation.
In Figs. 16–1 and 16–2, the top line of each plot shows the highest instantaneous HR in each 5-minute period, and the bottom line shows the lowest. The range of HRs within each period is a rough surrogate for the amount of HRV within each period. When the subjects with high HRV (see Fig. 16–1A,B) are compared with the subjects with lower HRV (see Fig. 16–1C,D), HR ranges are clearly less in subjects with lower HRV. HR ranges are still lower in the subject shown in Fig. 16–2A. Thus, examination of the range of HRs within each 5-minute period provides a qualitative sense of the amount of HRV present.
However, these HR ranges must be interpreted with caution, and examination of the HR ranges and circadian patterns of these ranges, as shown in these plots, could arouse suspicion of additional underlying problems beyond the lack of normal circadian rhythm. The clearest example is Fig. 16–2D (atrial fibrillation). Note the complete lack of a circadian rhythm and the extremely wide HR range. Abnormalities in cardiac rhythm may also be suspected in Fig. 16–2B,C, where there are periods of low HR range interspersed with periods of much higher HR ranges.
Information from Power Spectral Analysis
Another way of displaying HR patterns is by frequency domain or power spectral analysis. This involves using FFTs or autoregressive methods to decompose the variations in HR into underlying frequencies that together constitute the whole HR pattern, roughly analogous to decomposing a single note in a symphony into the underlying sounds of the different instruments that are playing at once.1,3 Normally, this process is performed on short segments of the signal (often 5 minutes) and then averaged over time. Only N-N interbeat intervals are used. If <80% of the time of segment is accounted from by N-N interbeat intervals (ie, >20% noise or ectopic beats), that segment is not usable for power spectral analysis. The reason for this is that the beat before and the beat after a nonnormal beat is excluded in power spectral analysis; thus, having >20% noise in a 5-minute segment means excluding >60% of the beats in that segment a priori. In a display of the results of power spectral analysis, the amount of variance (or amplitude, which is the square root of variance) at each underlying frequency is plotted on the y-axis, and the underlying frequency is plotted on the x-axis. Thus, the greater the HRV is, the greater the variance in HR and, therefore, the larger the area under the power spectral curve.
The various frequency domain HRV measures found in the literature are measures of the area under the FFT curve (or power) in groups of predefined underlying frequencies or “bands.” These are usually reported as ultra low–frequency (ULF) power, very low–frequency (VLF) power, low-frequency (LF) power, and high-frequency (HF) power.3 ULF power reflects variance in HR with a period of between 5 minutes and 24 hours and primarily reflects circadian HR patterns and long-term activity.3 VLF power (variations from 20-second to 5-minute cycles) is believed to reflect the activity of the renin-angiotensin and parasympathetic systems, although it is exaggerated by periodic breathing patterns.4 LF power (variations from 3-9 cycles/min) reflects the combined activity of the sympathetic and parasympathetic nervous systems and especially the activity of the baroreflex.3 Beat-to-beat HR changes are quantified by HF power (variations at respiratory frequencies) and primarily reflect parasympathetic modulation of HR.3 Differences in the amount of power in the different FFT bands are often used to compare cardiac autonomic function between subjects or within subjects after interventions, but as will be emphasized throughout this chapter, without graphical analysis of HR patterns, these numbers may prove to be misleading.5
Many commercial Holter scanning programs provide a single summarized plot of HRV power averaged over the entire recording. This plot is usually displayed as either amplitude versus frequency or ln amplitude versus ln frequency. The linear scale is more easily interpreted. Although 24-hour HRV plots are useful, more detailed information about changing autonomic function during the recording period can be obtained by plotting the HRV power spectral plot on an hourly basis. This, too, is available in some commercial Holter scanning systems. Notably, however, when hourly plots are used, information about the amount of ULF power is lost. Some of the information that can be gleaned by examining hourly FFTs is described in the following sections.
Just as the circadian rhythm plots can suggest bed and wake times, examination of hourly power spectral plots can also identify these times in most people and sometimes even distinguish between quiet rest and sleep. The hour during which the subject became supine can often be identified as the hour when a distinct peak appears in the HF band. This peak appears because when people lie down, sympathetic activity declines and HR is under predominantly parasympathetic control, which leads to a large increase in respiratory sinus arrhythmia, which is vagally mediated.6 Respiratory sinus arrhythmia, which is a speeding up of HR on inhalation and slowing down on exhalation, obviously occurs at the same frequency as respiration (ie, usually between 9 and 24 cycles/min). This frequency corresponds to the underlying oscillations of the HF power spectral HRV band (0.15-0.4 Hz). Moreover, the center frequency of this peak corresponds to the average breathing frequency during that period, and the magnitude of this peak reflects the degree of parasympathetic control of HR during that time. Often, supine rest can be distinguished from sleep because the center frequency of this peak declines at sleep onset compared with quiet rest and remains at that value during the night. Similarly, upon arising, this peak generally disappears. The reappearance of the HF peak during the middle of the day suggests a nap.
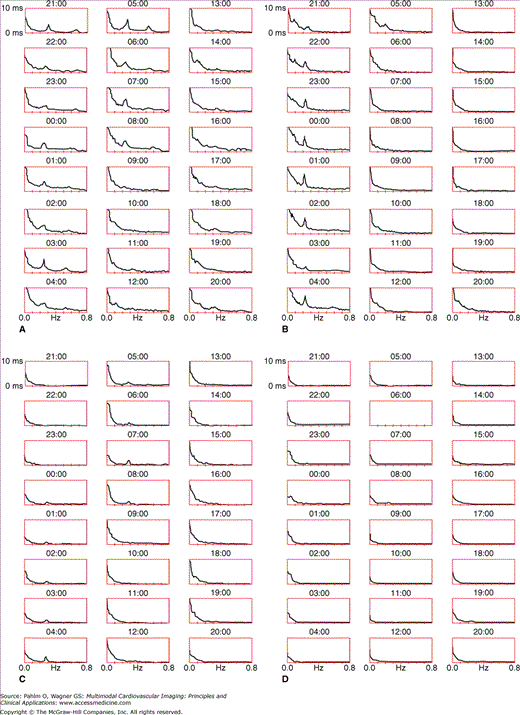
The 24 hourly power spectral amplitude plots for the healthy subjects originally shown in Fig. 16–1 are seen in Fig. 16–3. As indicated on the figure, hours with clearly visible HR peaks corresponding to times in bed and hours without such peaks corresponding to times out of bed can clearly be identified for all but the subject with low HRV (see Fig. 16–3D).
Figure 16–3.
Plots of 5-minute averaged heart rate variability (HRV) spectral amplitudes for the same subjects shown in Fig. 16–1: (A) a young healthy man with high HRV, (B) an older healthy man with high HRV, (C) an older healthy man with average HRV, and (D) an older man with low HRV.
Figure 16–4 shows 24 hourly spectral amplitude plots for the individuals with known cardiovascular disease originally shown in Fig. 16–2. Although the HF peak is extremely small for the subject with low HRV originally seen in Fig. 16–2A, close inspection can identify times in bed. In Fig. 16–4B, there are hours during the night with clear HF peaks that correspond to time in bed, but the HRV pattern is unclear in the hours immediately preceding and following them. The subject in Fig. 16–2C has clearly defined HF peaks during normal sleep hours, starting at 00:00, but additional HF peaks with a higher center frequency at 18:00 to 23:00 suggest that this subject was lying down for much of the time. Not surprisingly, no HF peak can be identified for the subject with atrial fibrillation.
Figure 16–4.
Plots of 5-minute averaged heart rate variability (HRV) spectral amplitudes for the same subjects shown in Fig. 16–2: (A) a cardiac patient with low HRV, (B) a cardiac patient with abnormal HRV, (C) a cardiac patient with sleep-disorder breathing HR patterns, and (D) a cardiac patient with atrial fibrillation.
Under normal circumstances, the HF peak of the power spectral plot, especially during sleep, is visible and distinct, as shown in most of the plots. As seen in Fig. 16–2A, even in patients with extremely low HRV, a clear, if small, HF peak can often be identified for the nighttime period, suggesting diminished but persevered vagal control of the heart. The absence of any such peak (as in Fig. 16–1D) suggests extreme parasympathetic dysfunction. Abnormalities in the shape of the HF peak suggest an underlying problem. For example, a disorganized peak in the HF band that has no clear center frequency (as in Fig. 16–2B) might suggest extremely irregular respiration or suggest the presence of either erratic sinus rhythm (ie, a high degree of sinus arrhythmia of nonrespiratory origin) or significant scanning error due to uneven detection of beat onsets.5,7
The association of sleep-disordered breathing with excessive sympathetic activation and the subsequent improvement in cardiac autonomic function with treatment have been well documented.8 Clearly, sleep-disordered breathing is associated with multiple adverse outcomes, and just as clearly, it is very much underdiagnosed.8-10 Graphical analyses of HRV offer a simple way to screen for this underlying condition. When sleep-disordered breathing is present, the patient experiences repeated episodes of loss of airflow and then abrupt awakenings to resume breathing. Unless autonomic dysfunction is extremely severe, each of these awakenings is accompanied by a sharp increase in HR, sometimes by as much as 25 to 30 beats per minute. Similarly, although generally briefer and more frequent, HR arousals can be caused by periodic limb movements (usually around every 20 seconds). Because sleep-disordered events occur at a frequency of between every 20 seconds to approximately every 90 seconds, this creates an oscillation in HR in the VLF band (which includes all HR oscillations at between every 20 seconds and every 5 minutes). This oscillation is also referred to as cyclic variation of HR (CVHR). Not surprisingly, this oscillation adds power at that underlying frequency in the HRV power spectral plot, and the center frequency of that peak also indicates the underlying frequency of the CVHR. The plot from the older man with high HRV (see Fig. 16–3
Stay updated, free articles. Join our Telegram channel

Full access? Get Clinical Tree


