Abstract
Objective
Although FibroScan (FS), based on Vibration-Controlled Transient Elastography (VCTE), is a widely used non-invasive device for assessing liver fibrosis and steatosis, its current standard-VCTE examination remains timely and difficult on patients with obesity. The Guided-VCTE examination uses continuous shear waves to locate the liver by providing a real-time predictive indicator for shear wave propagation and uses shear wave maps averaging to increase the signal-to-noise ratio in difficult to assess patients. We aimed to evaluate the effectiveness of the new indicator, as well as compare examination times and success rates with both standard-VCTE and Guided-VCTE examinations.
Methods
We recruited 130 patients all with varying BMI in this multicenter study. Sensitivity, specificity, positive predictive values and negative predictive values assessed the new indicator effectiveness. Success rates were compared using Wilcoxon signed rank tests rates and time-to-event analyses were used to investigate examination times. Agreement and repeatability of both methods were assessed using Wilcoxon signed-rank test.
Results
The new indicator was highly effective, with a 97% sensitivity for predicting valid liver stiffness measurements (LSM). LSM and controlled attenuation parameter results remained in good agreement between two examinations. The Guided-VCTE examination significantly increased the success rate of individual measurements and significantly reduced the time required for localization in the study cohort, especially in patients with grade 2 obesity (BMI ≥35 kg/m²). Additionally, the proportion of patients scanned in less than 4 minutes was significantly higher with the Guided-VCTE examination.
Conclusion
Guided-VCTE is a new effective technique that simplifies further FS use, particularly for patients with obesity.
Introduction
Background
The burden of chronic liver diseases is increasing globally, led by metabolic dysfunction–associated steatotic liver disease (MASLD), which affects more than 25% of the global population [ ]. While percutaneous liver biopsy is still used to assess and stage liver fibrosis and liver steatosis, non-invasive tests are more desirable, which include composite scores [ ], blood biomarkers [ ] and imaging modalities [ ]. The most widely used imaging modality is Vibration-Controlled Transient Elastography (VCTE) [ ], which is the core technology behind FibroScan (FS) devices (Echosens, France). FS devices are used worldwide in research and routine clinical practice to non-invasively assess several important markers of liver health, including liver stiffness measurement (LSM), controlled attenuation parameter (CAP) [ ], and spleen stiffness measurement (SSM) [ ]. A large number of clinical studies [ ] showed that LSM, CAP, and SSM assessed by VCTE correlates well with liver fibrosis, liver steatosis, and portal hypertension, respectively.
Guidance phase during VCTE examination
During a VCTE examination, the operator relies on the ultrasound signal (A-mode and TM-mode) to identify an area suitable for stiffness and CAP measurement. These two modes ensure that the probe is correctly positioned to take a measurement on a sufficiently thick portion of the organ to be measured, visible over the entire depth explored. They also allow the operator to ensure that the measurement will not be disturbed by the presence of other structures of no interest, such as blood vessels.
A guidance tool based on the quality of the ultrasound signal (“Liver Targeting Tool” – LTT) [ ] makes it possible to locate an optimal zone of ultrasound propagation in the liver. Although this tool is suitable for guiding CAP measurements based on ultrasound waves only, it is suboptimal to detect an area of homogeneous shear wave propagation.
Limitations of VCTE examination
VCTE has some limitations, such as limits in its technical performance based on patient body weight, with reduced performance in patients with obesity [ ]. Although, the introduction in 2010 of a probe designed specifically to assess patients with overweight or obesity, has significantly improved the applicability and reliability of the FS examination in this subpopulation [ , ], BMI remains the main factor associated with the failure of a FS measurement [ ], especially in extreme obesity [ ].
Studies also suggest that a novice operator can perform a reliable FS examination after a single training session. However, the more experienced the operator, the higher the success rate and the shorter the duration of the examination. This learning curve is steeper for non-physician operators (nurses/clinical research assistants) [ ].
In this paper, we propose a new VCTE technique, called Guided-VCTE, which is an improvement of the Vibration-Guided-Transient-Elastography [ ]. Guided-VCTE relies on the use of shear waves not only to measure liver stiffness, but also to help the operator locate the liver. In addition to the ultrasound images and ultrasound-based indicators, a real-time predictive indicator of shear wave propagation is displayed to the operator during the Guided-VCTE procedure. To improve stiffness measurement in patients with high BMI, this new technique also takes advantage of continuous shear wave propagation to implement shear wave map (SWMP) averaging, thereby improving signal-to-noise ratio.
Aim
In this study, we aimed to assess the effectiveness of the Guided-VCTE real-time predictive indicator and to assess the applicability and repeatability of the Guided-VCTE technique compared with the standard VCTE in a multicenter clinical study of patients with varied BMI.
Materials and methods
FibroScan operating mode during standard VCTE examination
In VCTE, shear waves are generated using a servo-controlled electro-dynamic actuator located in the probe handle. An ultrasound transducer (2.5, 3.5 or 5.0 MHz depending on the probe model) is mounted on the shaft of an electrodynamic actuator at the tip of the probe which is placed in contact with the skin in intercostal position, in front of the right lobe of the liver. Three probe models (M, XL and S) may be used by the operator depending on patient morphology. The system automatically recommends the appropriate probe.
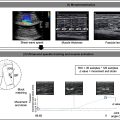
A standard-VCTE (STD-VCTE) exam is comprised of sequential one-dimensional ultrasound imaging and VCTE phases ( Fig. 1a ). During the one-dimensional ultrasound imaging phase, the probe is positioned on the patient with minimal force, and ultrasound acquisitions are carried out at a rate of 20 Hz. The operator locates the liver using ultrasound images (A-mode and TM-mode) and an ultrasound indicator called the “Liver targeting tool”, the LTT. Ultrasound attenuation (CAP) is computed during this phase [ ].

After locating the liver and applying the appropriate force, the operator can initiate stiffness measurements by pressing the probe button. This is known as the VCTE phase. Upon pressing the button, the vibrator generates a transient low frequency pulse that induces the propagation of a shear wave into the organ. For liver examination, the shear wave frequency is 50 Hz, and the peak-to-peak amplitude of the vibration is 1.0, 2.0 and 3.0 mm for S, M and XL probes, respectively. Ultrasound pulse-echo sequences are acquired at a 6 kHz pulse repetition frequency during the vibration for a total duration of 80 ms for a single VCTE measurement acquisition. The maximal repetition rate of VCTE measurement is 1 time per second.
The displacements induced in the tissues during the shear wave propagation are computed using a correlation technique applied to successive ultrasound signals. The individual shear wave speed is extracted from the SWMP and the stiffness is derived using the equation, E = 3ρV², where E is the Young’s modulus, ρ the density and V the shear wave speed. Stiffness estimates which do not meet minimal quality criterion are deemed invalid. The quality criterion is based on the SWMP quality and ranges between 0 and 1. A threshold of 0.85 is used to determine the validity of the measurement [ ].
All guidelines recommend performing 10 valid measurements. However, several studies support that 10 valid measurements are not required for measurement accuracy [ ]. Since the data in this clinical study are post-processed, some examinations with 10 valid measurements may end up with less than 10 valid measurements after post-processing. Therefore, a minimum number of 8 valid measurements per examination is required to ensure a sufficient number of patients for statistical analyses. The final stiffness result is the median of the valid measurements. The interquartile range (IQR) is provided as an indication of the dispersion of the results. Results are considered unreliable when the IQR over median ratio exceeds 30% (IQR/med > 30%).
FibroScan operating mode during Guided-VCTE examination
During the Guided-VCTE examination, the one-dimensional ultrasound imaging phase is replaced by a vibration-guided phase ( Fig. 1b ).
Standard-VCTE relies solely on one-dimensional ultrasound signals during the localization phase, whereas Guided-VCTE also consists of inducing and analyzing a continuous shear wave vibration when the probe is in contact with the patient’s skin. Localization shear waves are generated at a rate of 10 times per second to provide real-time feedback to the operator. Ultrasound acquisitions are carried out simultaneously at a 2 kHz pulse repetition frequency. The vibration frequency is reduced to 40 Hz during localization to facilitate shear wave penetration, and the amplitude of the shear wave is decreased by a factor of 2 to enhance patient comfort.
To aid the operator in localizing an optimal stiffness measurement area, an indicator predictive of stiffness measurement validity is displayed alongside ultrasound images (Guided-VCTE-Indicator). This indicator is based on the analysis of low-resolution real-time SWMP, using the same algorithm as VCTE, and is predictive of shear wave propagation in the medium.
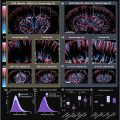
An improvement to Guided-VCTE is the use of shear wave maps averaging (SWMP-Av) during VCTE measurements. When the operator presses the probe button, three successive VCTE acquisitions are triggered instead of one. The acquisitions are executed sequentially with a delay of a few milliseconds in between each acquisition. The total duration of 300 ms is short enough to assume that the liver does not move significantly during the acquisitions to be averaged. This is a prerequisite for averaging the associated shear wave propagation maps. Averaging enhances the signal-to-noise ratio of the SWMP ( Fig. 2 ). The stiffness measurement is then performed on the averaged SWMP using the same kind of algorithms as those used for standard-VCTE.

Clinical study
The clinical study (NCT05567328) is a French, prospective, interventional, multicenter clinical investigation. The studied population consisted of adult patients with liver disease (>18 years of age) followed in either the Hepatology or Diabetology and Nutrition department at designated sites throughout France ( Table 1 ). All etiologies of liver diseases were combined, and BMI assessed.
| Site 1 N = 26 | Site 2 N = 74 | Site 3 N = 30 | |
|---|---|---|---|
| Demographics | |||
| Median (IQR) or n (%) | |||
| Age (years) | 55.0 (20.0) | 62.0 (24.0) | 59.0 (17.0) |
| Female sex | 17 (65%) | 24 (32%) | 14 (47%) |
| BMI (kg/m²) | 44.0 (9.0) | 34.0 (12.1) | 35.9 (8.4) |
| LSM obtained by STD-VCTE (kPa) | 7.2 (4.4) | 8.0 (10.1) | 8.9 (9.1) |
| LSM obtained by GUIDED-VCTE-AVG3 (kPa) | 7.1 (4.1) | 9.3 (9.6) | 8.0 (8.1) |
| CAP obtained by STD-VCTE (dB/m) | 312.0 (44.0) | 305.0 (90.0) | 325.5 (88.8) |
| CAP obtained by GUIDED-VCTE-AVG3 (dB/m) | 330.0 (44.2) | 307.0 (86.0) | 309.0 (72.0) |
| Fibrosis stage based on LSM by STD-VCTE | |||
| F0/F1 | 15 (60%) | 37 (51%) | 13 (43%) |
| F2 | 4 (16%) | 6 (8%) | 3 (10%) |
| F3 | 1 (4%) | 10 (14%) | 5 (17%) |
| F4 | 5 (20%) | 20 (27%) | 9 (30%) |
| Fibrosis stage based on LSM by GUIDED-VCTE-AVG3 | |||
| F0/F1 | 16 (62%) | 33 (45%) | 15 (50%) |
| F2 | 4 (15%) | 6 (8%) | 3 (10%) |
| F3 | 2 (8%) | 14 (19%) | 4 (13%) |
| F4 | 4 (15%) | 21 (28%) | 8 (27%) |
| Etiologies | |||
| n (% of total number of etiologies) | |||
| Alcohol-related liver disease | 1 (4%) | 6 (8%) | 0 (0%) |
| Auto immune hepatitis | 0 (0%) | 1 (1.5%) | 1 (3%) |
| Cholestasis | 0 (0%) | 1 (1.5%) | 0 (0%) |
| Hepatitis B | 0 (0%) | 6 (8%) | 1 (3%) |
| Hepatitis C | 0 (0%) | 9 (12%) | 2 (7%) |
| MASLD/MASH | 25 (96%) | 29 (39%) | 15 (50%) |
| Primary biliary cirrhosis (PBC) | 0 (0%) | 1 (1.5%) | 0 (0%) |
| Liver transplantation | 0 (0%) | 0 (0%) | 1 (3%) |
| Other liver disease or combination of chronic liver diseases | 0 (0%) | 21 (28.5%) | 10 (34%) |
Patients were consecutively selected at each site by the investigator during their routine clinical practice. All patients underwent scanning with both a commercial FS with standard-VCTE (STD-VCTE-FS) as a reference and a prototype FS equipped with Guided-VCTE (GUIDED-VCTE-FS).
The study recruited 130 patients from 3 sites ( Table 1 ). The first 90 patients (phase 1) underwent two examinations: an exploratory examination with GUIDED-VCTE-FS and a reference examination with STD-VCTE-FS. The next 40 patients (phase 2) underwent four examinations: two consecutive exploratory examinations with GUIDED-VCTE-FS and two consecutive examinations with STD-VCTE-FS. At the operator level, the examination had to start alternatively with GUIDED-VCTE-FS or STD-VCTE-FS to avoid potential bias in searching for the optimal measurement area. All examinations at each site were performed by the same operator and with the same probe, one after the other.
This multicenter trial was approved by the Ethical Committee “CPP Comité de protection des personnes EST I” (France). The nature of the study was explained to all patients, each of whom provided written informed consent before the beginning of the study, in accordance with the principles of the Declaration of Helsinki (revision of Edinburgh, 2000).
Statistical analysis
To evaluate the impact of SWMP-Av, we compared the success rates (defined by the number of valid measurements out of the total number of measurements) of STD-VCTE-FS, GUIDED-VCTE-FS without average mode (GUIDED-VCTE-AVG1) and GUIDED-VCTE-FS with average mode (GUIDED-VCTE-AVG3) using Wilcoxon signed rank tests.
Guided-VCTE indicator effectiveness was assessed with a receiver operating characteristics (ROC) analysis using VCTE binary validity criterion as reference. Discrimination was evaluated with area under the ROC curves (AUROC) and sensitivity, specificity, positive predictive values (PPV) and negative PV (NPV) at the cut-off at 0.85 were computed.
To evaluate the agreement and repeatability of LSM and CAP, Wilcoxon signed-rank test was performed to test for differences between the two examinations. The strength of their correlation was assessed using the Spearman correlation coefficient (ρ). Absolute agreement was assessed using the Intraclass Correlation Coefficient (ICC). ICC<0.5 indicates poor agreement, 0.5≤ICC<0.75 moderate agreement, 0.75≤ICC<0.9 good agreement and ICC≥0.9 excellent agreement [ ]. A Bland-Altman plot was used to assess bias and agreement between the two examinations.
The Wilcoxon rank sum tests were used to compare absolute differences between the GUIDED-VCTE-FS and STD-VCTE-FS examinations and those of repeatability of each device. Additionally, the repeatability of GUIDED-VCTE-FS was compared to that of STD-VCTE-FS using the Wilcoxon signed rank test.
Time-to event analyses were performed to assess and compare the times to reach:
- •
the 1st valid LSM after the operator places the probe on the patient,
- •
the 8th valid LSM after the operator places the probe on the patient.
Patients who did not have a valid LSM measurement and remained event-free had a right-censored time, which was the period of observation until the time the operator terminated the examination. Standard Kaplan-Meier curves were drawn and the time it takes for 50% of patients to have reached the 1 st or 8 th valid LSM were computed. Log-rank test was used to test differences between GUIDED-VCTE-AVG3 and STD-VCTE.
The examination duration is defined as the time elapsed between the initial placement of the probe on the patient and its removal at the conclusion of the examination. To evaluate examination time reduction, several examination durations were tested, and the proportions of patients scanned in less than each duration with GUIDED-VCTE-AVG3 and STD-VCTE were calculated and compared with tests of proportions.
Analyses concerning stiffness were assessed in patients with at least 8 valid LSM and IQR/Median ≤ 30% for all examinations. Analyses concerning CAP were assessed in patients with a CAP gauge of at least 100% for all examinations. Analyses concerning SWMP-Av, times and examination durations are presented in all patients (all BMI combined) and in patients with BMI ≥ 35 kg/m² (since close to the median BMI of the population).
The agreement and absolute different analyses, as well as the indicator effectiveness analyses, were conducted on patients from phase 1 and 2. The SWMP-Av and time-to-event analyses were performed on patients from phase 1, while the repeatability analyses were conducted on patients from phase 2 ( Fig. 3 ).

Related posts:
 Advances in the Application of Artificial Intelligence in the Ultrasound Diagnosis of Vulnerable Carotid Atherosclerotic Plaque
 Changes in Muscle Quality Following Short-Term Resistance Training in Older Adults: A Comparison of Echo Intensity and Texture Analysis
 Validation of Muscle Ultrasound Speckle Tracking and the Effect of Nordic Hamstring Exercise on Biceps Femoris Displacement
 Combined Nanodrops Imaging and Ultrasound Localization Microscopy for Detecting Intracerebral Hemorrhage
 Other Important Issues: Training Challenges, Certification, Credentialing and Billing and Coding for Services
 How to Inject Chemotherapeutic Agents
Stay updated, free articles. Join our Telegram channel

Full access? Get Clinical Tree


