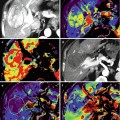
Fig. 28.1
Recurrence and postreatment progression of treated oropharynx cancer. (a) Suspected tumor recurrence was not well identified on postcontrast TSE T1-weighted image (a, top image) and ADC map (a, right bottom image). However, perfusion parametric map (a, left bottom image) was able to identify a suspicuous region (arrow) and was also useful to guide biopsy, which was positive for malignancy. (b) After the first cycle of chemotherapy, postcontrast TSE T1-weighted image (b, top image) showed an area of irregular enhancement with mass effect on the left oropharyngeal space (arrow). Both perfusion and ADC map (b, bottom left and right images, respectively) demonstrated more clearly tumor progression (arrows) in a patient that was not responding to treatment
28.2.2.2 Diffusion-Weighed Imaging (DWI) and Diffusion Tensor Imaging (DTI)
Diffusion-weighted imaging (DWI) has been extensively used outside the brain in recent years,due to its ability in evaluating the rate of water diffusion in different tissues. This technique may be quantified by means of apparent diffusion coefficient (ADC), which has been used in the HN region for tumor characterization, as ADC tends to be lower in malignant tumors than in normal tissues or benign lesions, secondary to its hypercellularity [25–27].
Most commonly, echo-planar-imaging (EPI) sequences are used in the HN region. The challenge is to ensure good quality acquisitions, as EPI sequences are prone to distorsion and susceptibility artifacts, which are frequent in HN region due to air-soft tissue-bone interfaces, involuntary or deglutition motions (breathing or swallowing), physiologic vascular pulsation and dental fillings with metallic materials. Therefore, it is interesting to reduce scanning time to no longer than 5 minutes. The use of parallel imaging or advanced strategies, such as periodically rotated overlapping parallel lines with enhanced reconstruction (PROPELLER), make this objective possible. In some difficult cases, turbo spin-echo-based sequence can be used instead of EPI sequence [25, 27]. In order to perform ADC quantification, it is necessary to obtain at least two b values. More commonly a low b value between 0 and 100 s/mm2, and a high b value between 800–1,000 s/mm2 are obtained. The inclusion of low b values under 300 s/mm2 could overestimate ADC measurements for the combination of perfusion and diffusion information. Le Bihan et al. [28] described the capability to distinguish molecular diffusion from perfusion, acquiring multiple b values lower than 100 s/mm2 and values greater than this threshold using intravoxel incoherent motion (IVIM) model of analysis of diffusion signal decay, that provides perfusion and diffusion information in a single sequence. Calculation and quantification of IVIM-derived parameters, such as D* (perfusion contribution to signal decay), D (real diffusion of water molecules) and f (perfusion contribution to the diffusion signal) are being tested for the evaluation of several diseases and organs. These parameters are different among various types of HN tumors. The application of the IVIM model in the HN area has been studied by some authors and its clinical role is not well defined yet [25, 29, 30] (Fig. 28.2).
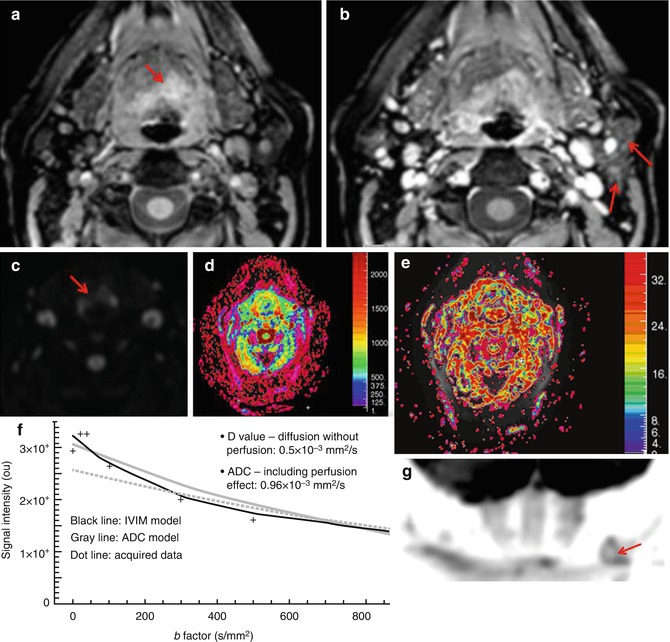
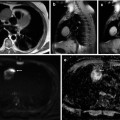
Fig. 28.2
Supraglottic oropharynx cancer with ipsilateral nodal metastasis (T3N1b stage). (a, b) Postcontrast THRIVE images show an enhancing expansive lesion at the left supraglottic space (arrow, a) that extended both to hypopharynx and left pyriform sinus, with involvement of ipsilateral lymph nodes (arrows, b). (c) DWI with a b value of 1,000 s/mm better depicts the mass as it shows restriction of diffusion consistent with malignancy (red arrow). (d, e) A biexponential model of analysis of the diffusion signal decay was used to obtain parametric maps of D (diffusion without perfusion contamination) and perfusion fraction, respectively.(f) The diffusion signal decay of the mass is shown in the graph (x-axis represents the b values and y-axis the signal intensity). Notice the great difference between ADC (0.96 × 10⁻³ mm2/s) and D (0.5 × 10⁻³ mm2/s) values due to the effect of the mass perfusion. The perfusion fraction of the mass was high (35 %), and it was estimated using only the diffusion signal decay for b values lower than 100 s/mm2. (g) Coronal MIP of DWIBS sequence with inverted gray scale demonstrates the restriction of free water motion ofleft lymphadenopathy (arrow)
ADC has shown a role in the differentiation between benign and malignant tumors in HN region, different thresholds have been proposed for this task (range 1.22–1.30 × 10⁻³ mm2/s). However, even more different values of the ADC have been used for characterization of tumor type. The most frequent tumor in the HN area, SCC, usually shows an intermediate grade of malignancy, while other tumors present a higher cellular density and lower ADC values such as malignant lymphomas (Fig. 28.3). Some authors propose the distinction of subtypes of SCC and different histopathological subtypes of lymphomas according to ADC values. Non-Hodgkin lymphomas demostrate lower ADC values than Hodgkin lymphoma. However, there are still some limitations in the utility of DWI to differentiate poorly differentiated SCC from lymphomas and necrotic tumors from infections with necrotic areas [25, 27, 28, 31–38].
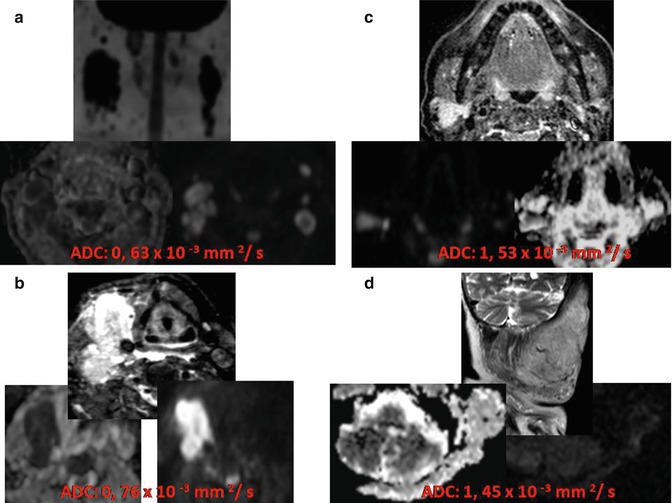
Fig. 28.3
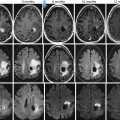
Differences in ADC value can be considered for determining the chance of malignancy of an HN lesion. (a) Extensive bilateral lymphadenopathies in HN region demonstrating high signal on high b value and low ADC values due to lymphoma. (b) Undifferentiated occult carcinoma with right lymphadenopathy presenting also high signal on high b value and low ADC, but higher than lymphoma. Two benign lesions: a right pleomorphic adenoma (c) and a left plexiform neurofibroma (d); both benign lesions have higher ADC values very different from the low values observed in malignant lesions
The application of DWI is useful for the characterization of salivary gland tumors. It has been shown useful in the distinction between pleomorphic adenoma, which shows high ADC values, from Warthin tumors, with lymphoid origin, and other heterogeneous tumors and carcinomas. Furthermore, some authors have also proposed that the use of DWI could avoid biopsies in cases of pleomorphic adenomas [39]. Another important clinical application of this technique is the evaluation of lymph nodes, because malignant lymphadenopathies show significant lower values than benign or reactive nodes. Despite the high sensitivity and specificity of DWI, PET/CT is the method of choice to determine cervical node involvement. The limitation of DWI in the evaluation of lymph node includes small size of some cervical malignant lymph nodes and the presence of some inflammatory, granulomatous, or infectious diseases that presents with reactive nodes, which could be associated with high cellular density, homogeneous and intense lymphoid infiltration, or fibrous stroma, descending all of these factors ADC measurements of lymph nodes (Fig. 28.4). The presence of necrosis in lymphadenopathy could make its adequate characterization difficult, because ADC values can increase. For that reason, it is recommended to exclude necrotic areas from ADC measurements [25, 27, 31, 33–36, 38, 39].
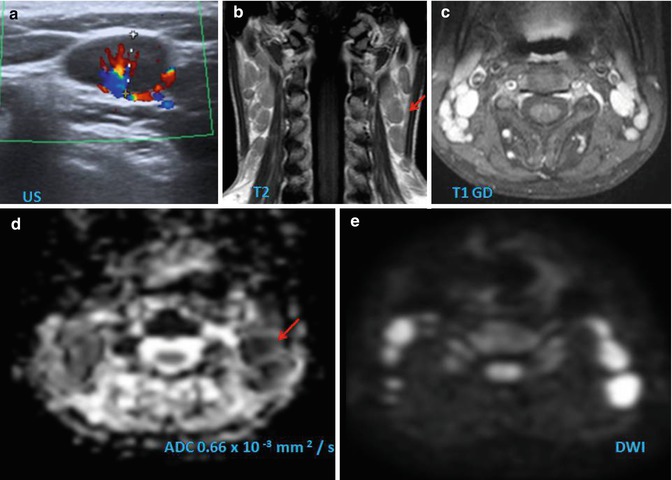
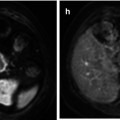
Fig. 28.4
This case can be considered a pitfall of morphological imaging. This child presents multiple bilateral lymphadenopathies, which are hypoechoic and show hilar hypervascularization on Doppler ultrasound (a). The lymph nodes present low to isosignal intensity to muscle on T2-weighted image (arrow, b) and an intense and homogenous enhancement on fat-suppressed TSE T1-weighted sequence after administration of contrast agent (c). On DWI, the nodes demonstrate restricted diffusion, demonstrated as low measurement of ADC values (arrow, d) and high signal on high b value (e). Although these findings can be also found in malignant lymphadenopathies or lymphoma, the clinical history and histological analysis confirm the diagnosis of Still’s disease
Another particular use of DWI is the characterization of cystic lesions in children. During childhood, there is a high incidence of congenital lesions and cysts. These lesions should be distinguished from malignant tumors, which are often very aggressive at these ages. Cystic lesions of HN can be routinely diagnosed with conventional MRI sequences, but in certain situations such as infected branchial cleft cysts or epidermal cysts, DWI can play an important complementary role. Epidermal cysts are typically associated with restricted diffusion and low ADC values due to their keratinous content. These lesions are frequently found in HN region during the first decade of life. Fewer differences in ADC values among cystic lesions are caused by protein component variations in the fluid and the changes in the viscosity of the contents [31, 40].
Another advanced technique derived from DWI, diffusion tensor imaging – DTI – may be useful in surgical planning in patients with HN mass lesions, providing information about the localization of nerve bundles and their relation with the mass, helping the surgeons to preserve these fibers and prevent them to be removed [41].
28.2.2.3 MR Spectroscopy
Another advanced technique associated to MRI is proton MR spectroscopy (MRS). This technique has the ability to detect specific metabolites in the analyzed tissues. Despite the difficulties to obtain good-quality MRS spectra in HN region, some studies have demonstrated elevated Cho/Cr ratios in HN malignant tumors compared with normal tissues. Other cervical lesions with cellular proliferation, such as glomus tumors, schwannomas, and inverted papillomas, also show increased Cho/Cr ratios [42, 43]. Although, the main potential clinical application of proton MRS is therapy monitoring in patients with HN cancer, its use is very limited due to technical difficulties to be applied in a clinical setting.
28.2.2.4 Blood Oxygen Level-Dependent (BOLD) Technique
Hypoxia is a pivotal factor ot the pathophysionome of HN cancer, since it can promote tumor progression and resistance to therapy. BOLD MRI may provide a noninvasive assessment of tumor hypoxia by monitoring changes in solid tumor concentration. BOLD is capable to distinguish a focal increase in blood flow, by the detection of changes of local T2* signal, secondary to a decrease of oxyhemoglobin and increase of deoxyhemoglobin contents. This process is known as BOLD effect. BOLD is able to detect differences in tissue oxygenation using physiologic and pharmacologic challenges such as hyperoxia, hypoxiaor hypercapnia. The measurement of tumor oxygenation using BOLD studies can be correlated with tumor microvasculature. In patients with primary HN tumors, positive nodal status was correlated with a widened oxygenation distribution in the tumors [44]. However, BOLD MRI is still far from the clinical arena.
28.2.2.5 New Contrast Media
Other MRI contrast agents than gadolinim chelates have been investigated specially for assessment of nodal status. Typically they are composed of nanometer-sized iron oxide (FeO3) particles coated with dextran or ultrasmall particulate iron oxide (USPIO). These agents are phagocytized by macrophages, and they are especially used in the study of the lymph nodes. Tumor lymphadenopathies show a pattern of reduced contrast uptake, while nodes with benign hyperplasia have a normal contrast enhancement. These agents are not sensitive for detecting micrometastases. SPIO-enhanced MRI is emerging as an important tool for planning the extent of surgery, although its clinical use is still limited due to lack of FDA approval [45].
28.2.3 Molecular Imaging
Sensitivity of PET in detecting primary tumors is similar to that of the conventional diagnostic imaging (CDI) with the exception of tumors located in the oral cavity, with a sensitivity up to 98 % [46, 47]. A limitation of PET is its inability to define the depth of invasion and the relation to neighboring structures. Clinical examination and structural imaging can compensate this deficiency. In the current era of multimodality imaging devices, many groups, including our own, are performing diagnostic computed tomography (DCT) with intravenous contrast as part of the PET/CT acquisition protocol. In the study by Veit-Haibach et al., PET/DCT was superior in TNM staging of HN cancer compared to contrast-enhanced CT only and PET/CT [48]. This was based on a more reliable T staging, partly due to better primary tumor delineation on co-registered PET/DCT in patients with metallic artifacts. PET/DCT could lead to a change in patient management in a substantial number of patients when compared to CT and PET/CT. Moreover, PET/CT is able to detect an unknown primary tumor, in situations where there is a strong clinical suspicion of a primary tumor despite a negative biopsy and in cases where more extensive disease can be demonstrated than could be observed on clinical examination or on other imaging techniques [49] (Fig. 28.5).
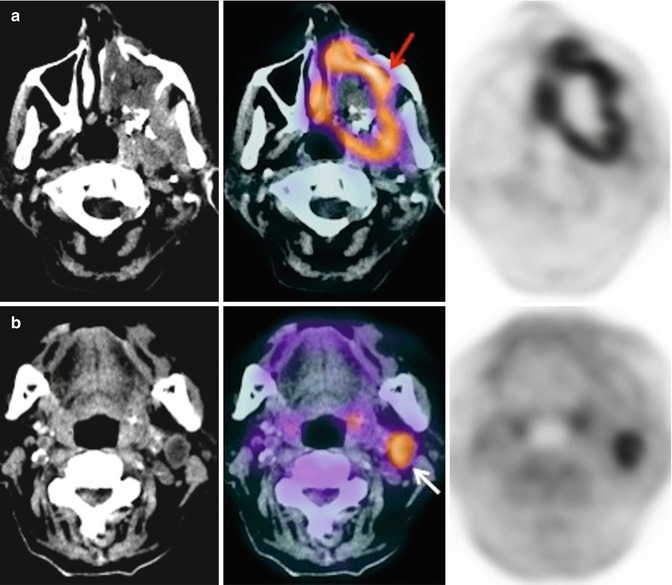
Fig. 28.5
An 80-year-old woman with fever and constitutional syndrome. The patient was treated with antibiotics for suspected left maxillary sinusitis, without symptom improvement. With the suspicion of a malignant disease, a 18F-FDG-PET/CT study was requested. Extensive lesion was observed in left maxillary sinus (a, red arrow) and ipsilateral cervical adenopathy (b, white arrow). The biopsy of the adenopathy confirmed a squamous cell carcinoma of the maxillary sinus with lymph node involvement
PET/MRI has the potential to improve diagnostic imaging in patients in whom the soft tissue contrast provided by CT is considered insufficient. Further studies are needed to evaluate the clinical role of PET/MRI in HN cancer [50]. CDI requires an alteration in the size or architecture of nodes for disease detection [51]. This is not a requirement for PET positivity. In a review published by Schöder et al., the utility of PET and CT in assessing cervical lymph nodes in patients with HNSCC was compared [52]. PET was found to have a higher sensitivity and specificity compared with MRI or CT in the detection of cervical nodal disease in HNSCC (sensitivity 87–90 % versus 80–93 %, specificity 80–93 % versus 21–100 %) [46]. Similar findings were achieved in the study performed by Iyer et al. [53]. Murakami et al., according to receiver operating characteristic (ROC) analysis, established that the size-based SUVmax cutoff values were 1.9, 2.5, and 3.0 for lymph nodes <10 mm, 10–15 mm, and >15 mm, respectively [54]. These cutoff values yielded 79 % sensitivity and 99 % specificity for nodal-level staging. Jeong et al. prospectively compared PET and PET/CT in assessing cervical nodal status in HN cancer patients [55]. PET/CT provided additional information for anatomic localization with regard to metastatic lymph node level and a correct differentiation between malignant nodes and benign lesions leading to a change in extent of neck dissection in 10.6 % of patients. Addition of CT fusion led to a 15 % increase in accuracy of nodal staging compared with PET alone. In a meta-analysis including 32 studies (1,236 patients), 18F-FDG-PET sensitivity was 79 % (95 % CI = 72–85 %) and specificity was 86 % (95 % CI = 83–89 %) [56]. For cN0 patients, sensitivity of 18F-FDG-PET was only 50 % (95 % CI = 37–63 %), whereas specificity was 87 % (95 % CI = 76–93 %). In studies in which both 18F-FDG-PET and CDI were performed, sensitivity and specificity of 18F-FDG-PET were 80 and 86 %, and sensitivity and specificity of CDI were 75 and 79 %, respectively. PET/DCT demonstrates a significantly better performance than both contrast-enhanced CT and PET/CT protocols in detecting nodal metastases, especially in the depiction of small (<15 mm) nodal metastases. Rodrigues et al. demonstrated a fourfold increase in nodal detection [57] (Fig. 28.6).
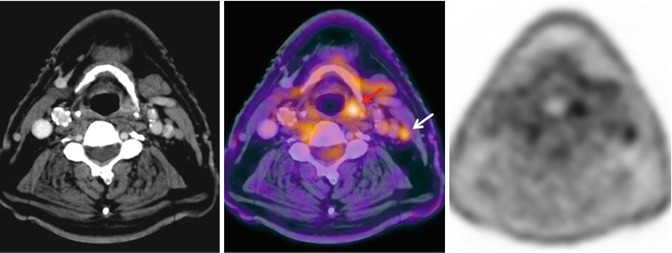
Fig. 28.6
A 78-year-old man with hypopharynx squamous cell carcinoma, T2N0M0 in CT. 18F-FDG-PET/CT showed intense uptake in the lesion in the left pyriform sinus (red arrow) and in an ipsilateral millimeter-sized lymph node (white arrow). FNA of the lymph node confirmed metastatic disease
Recently, Prestwich et al. assessed the utility of 18F-FDG-PET/CT as an adjunct to CDI in patients with locally advanced HNSCC [58, 59]. The N stage was changed in 40 % of cases. In conclusion, although PET/CT has a higher diagnostic accuracy and specificity than CDI for evaluation of lymph nodes (N stage), its information is not reliable enough to avoid lymphadenectomy in negative cases [60]. Several studies have estimated sensibility of PET/CT in the detection of distant metastases. In a prospective study, PET/CT detected additional metastases in 6 % of patients, compared with thoracic CT [61]. Ng et al. compared PET and body CT for M staging. Sensitivity for PET and CT were 76.9 and 50 %, respectively, with impact on treatment in 13.1 % of cases [62]. Lonneaux et al. published their experience in the use of PET or PET/CT in the staging of patients with HNSCC [63]. All patients had CT or MRI imaging of the HN region and thoracic CT with discordant TMM stages in 43 % of patients. In cases of discrepancy, 18F-FDG-PET showed better accuracy and changed treatment in 13.7 %. The change in M stage occurred in 8.6 % of cases. The most common locations of distant metastasis were the lungs, followed by bone (Fig. 28.7) and liver.
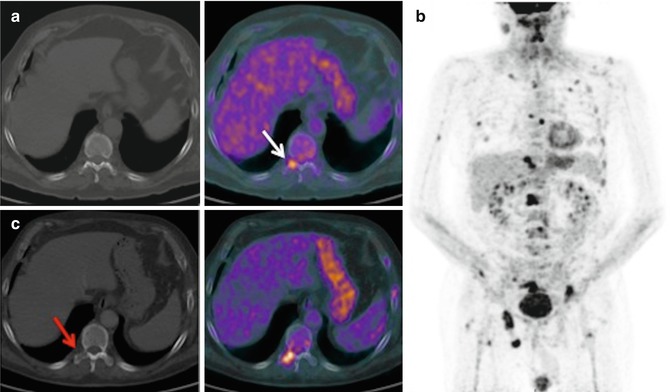
Fig. 28.7
A 68-year-old man with right pyriform sinus carcinoma treated with laryngeal microsurgery, chemotherapy, and radiotherapy. In the staging 18F-FDG-PET/CT, pathologic FDG uptake was observed in D11 (a, white arrow) and L1 vertebral bodies, without CT correlation. In post-chemotherapy 18F-FDG-PET/CT (b), bone progression of the known vertebral metastasis and multiple new lesions were observed. With disease progression, the lesion of T11 vertebral body was apparent on CT as a lytic area (c, red arrow)
28.3 Treatment Response
The early treatment response assessment using PET/CT has been analyzed in few studies, some of which show a correlation between the decrease in 18F-FDG uptake and improved locoregional control. There are insufficient data on the use of PET/CT in the assessment of induction chemotherapy. It aims to optimize the most appropriate treatment for each patient after neoadjuvant therapy, selecting the responder patients that could benefit from concurrent chemoradiotherapy. Nonresponder patients would be candidates for more aggressive surgery after induction [64]. Response rates at the site of primary disease are generally high with concurrent chemoradiotherapy. Therefore, the aim of post-therapy PET/CT is the detection of residual disease in neck lymph nodes. Most studies on post-therapy 18F-FDG-PET in HNSCC included heterogeneous patient populations, and all the data come from retrospective analyses. Selection criteria were different: patient selection, disease sites, treatment strategies, treatment protocols, time for PET in response assessment, and the use of PET/CT versus PET. Only a few recent studies analyze the role of combined PET/CT in this setting [65]. Most authors state that posttreatment PET should not be performed before 10–12 weeks after the end of therapy. At this time, most inflammatory changes have decreased, and therefore, the possibility of false-positive results is lower [66]. The true value of post-therapy 18F-FDG-PET in patients treated with radiotherapy or chemoradiotherapy is the high negative predictive value [58, 59, 67–69] (Fig. 28.8). Many patients who might otherwise proceed to biopsy or neck dissection can be observed with clinical follow-up and periodic imaging studies. However, it would be advisable to perform prospective studies with similar selection criteria, to establish the true accuracy of PET/CT in this indication [66]. A recent cost-effectiveness analysis supports the use of PET/CT as the more cost-effective strategy for surveillance of neck after completion of definitive chemoradiotherapy compared to up-front neck dissection in N2 disease [70]. There is a growing trend to consider tumor metabolic information when planning treatment and predicting outcome. Metabolic tumor volume (MTV) is determined either using a fixed background SUV cutoff, all voxels containing SUV values above this threshold constituting the MTV, or using the SUVmax values of the individual tumor sites involving the region growing up to a prefixed percentage of the SUVmax. When multiplying MTV by the mean SUV, total lesion glycolysis (TLG) is obtained. This could prove to be another biomarker of potential interest for prognosis assessment in cancer patients. Chung et al. established a cutoff of 40 mL as the best discriminative value for MTV, to predict short-term outcome to radiotherapy or chemoradiotherapy in pharyngeal cancer [71]. Patients with MTV >40 mL showed a significantly lower number of complete response/no recurrence than did patients with MTV ≤40 mL.
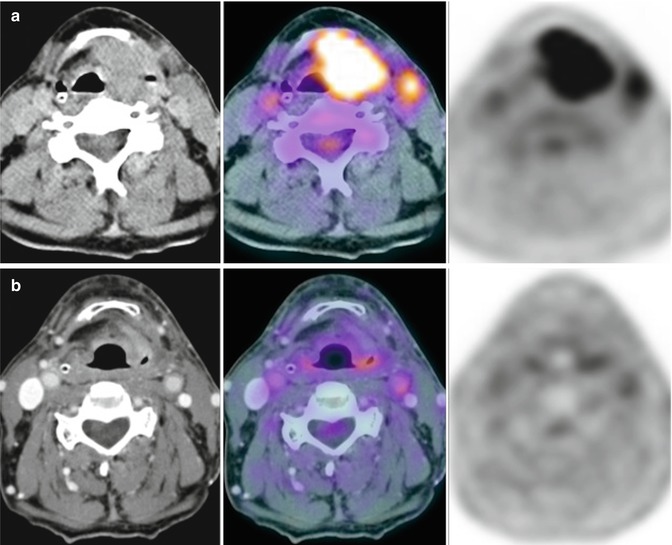
Fig. 28.8
A 70-year-old man with squamous cell carcinoma of the larynx T3N2bM0 was clearly depicted with 18F-FDG-PET/CT (a) performed before chemoradiation. 18F-FDG-PET/CT scan at 10 weeks after the completion of treatment (b) showed complete response which was confirmed after laryngeal microsurgery with biopsy and left functional neck dissection
In the postreatment setting, DWI has shown promise in the distinction between benign posttreatment changes and residual or recurrent SCC. Persistent tumor usually shows lower ADC values than postherapeutic fibrosis [33].Interestingly, these results also occurs in the early postreatment period when PET is limited. The best strategy for therapy monitoring with DWI is to perform consecutive ADC measurements during the course of therapy, as a relative decrease in lesion ADC during treatment is a stronger marker than a single low ADC measurement of the suspicious lesion [33]. In addition, DWI has been proposed to predict response to therapy [27


Related posts:


Stay updated, free articles. Join our Telegram channel
Full access? Get Clinical Tree
