Fig. 7.1
Schematic drawing of normal hepatic circulation. Liver has a unique dual blood supply from the portal vein (PV) and hepatic artery (HA), and a single venous outflow, the left, middle, and right hepatic veins (α) via central veins, draining into the inferior vena cava (β)
7.7.2 Diagram of Liver with Transient Hepatic Attenuation Difference
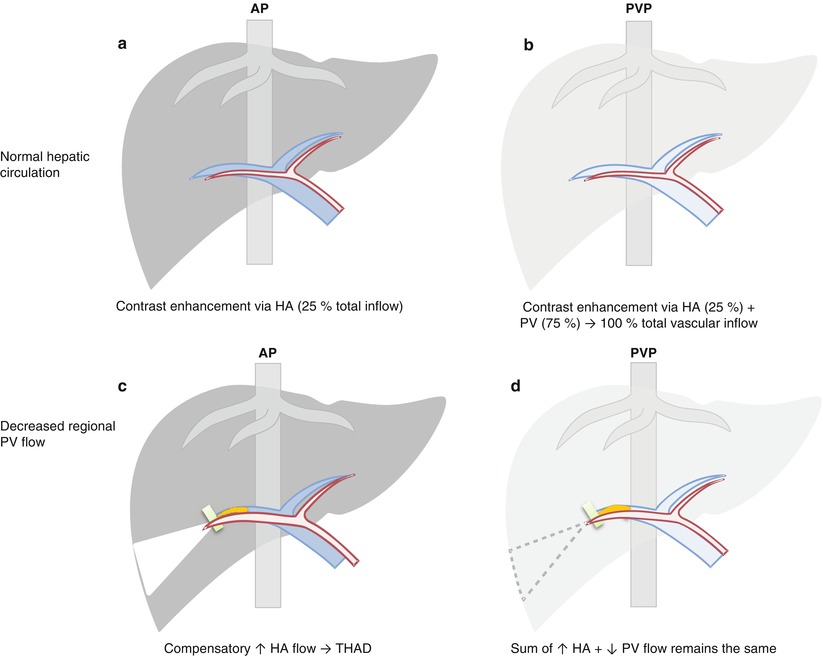
Fig. 7.2
Diagram of liver with transient hepatic attenuation difference (THAD). (a, b) Normally in arterial phase (AP), liver enhancement is minimal as contrast material reaches liver via hepatic artery (HA) only, and the major inflow from portal vein (PV) is not yet effectively opacified. In portal venous phase (PVP), liver enhancement approaches maximum through fully opacified PV, as well as HA still opacified with contrast. (c, d) Decreased regional PV flow results in compensatory increase in regional HA flow. In AP, contrast within the regionally increased HA inflow shunts into the portal vein tributaries due to a large pressure gradient, producing a hyperenhancing region (triangle in c) – THAD, contrasted by minimally enhancing background liver. This region becomes iso-attenuating in PVP as the sum of HA and PV flow is maintained
7.7.3 Rapid-Filling Hemangioma Associated with Arterioportal Shunt
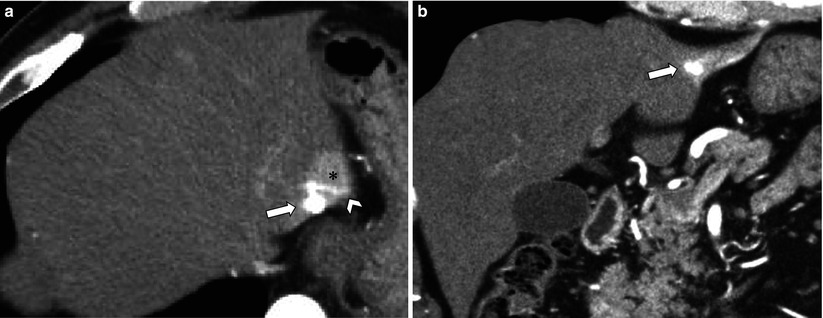
Fig. 7.3
Small rapid-filling hemangioma associated with arterioportal shunt (APS). (a, b) Axial (a) and coronal (b) arterial phase CT images show small rapid-filling hemangioma (arrow) with a relatively large region of transient hepatic attenuation difference (asterisk). Also note contrast refluxes into a peripheral branch of portal vein (arrowhead)
7.7.4 Hepatocellular Carcinoma Associated with Transient Hepatic Attenuation Difference
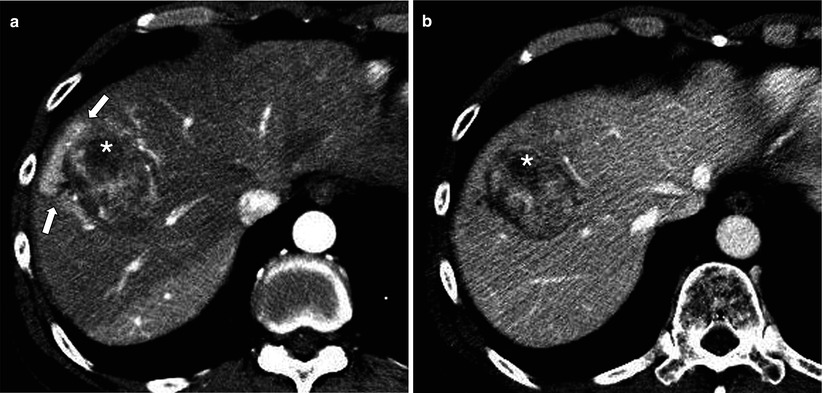
Fig. 7.4
Hepatocellular carcinoma (HCC) associated with transient hepatic attenuation difference (THAD). (a) Arterial phase CT image shows HCC (asterisk) with adjacent THAD (arrows) probably secondary to branch portal vein obstruction or transtumoral arterioportal shunt. (b) The region of THAD becomes iso-attenuating to the parenchyma in portal venous phase
7.7.5 Fatty Sparing due to Arterioportal Shunting
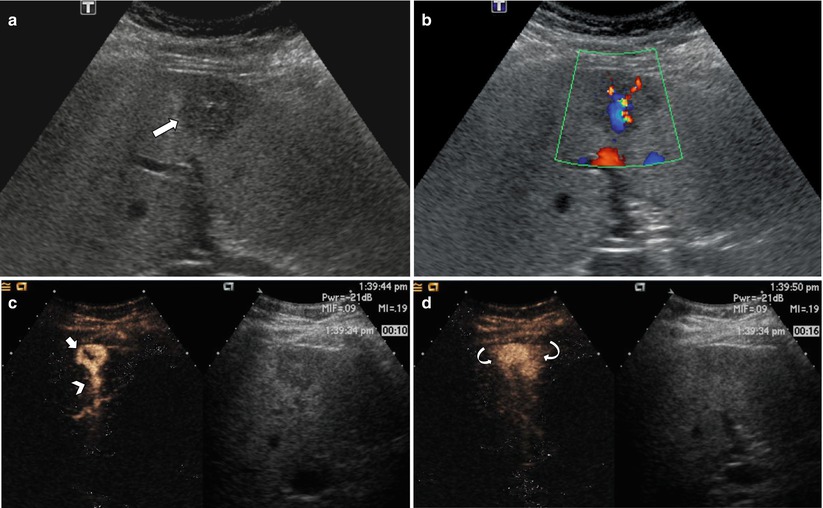
Fig. 7.5
Rapid-filling hemangioma with fatty sparing due to arterioportal shunt (APS) on contrast-enhanced ultrasound (CEUS). (a) Grayscale image shows a peripheral geographic hypoechoic region (arrow) in the background fatty liver. (b) Color Doppler image shows underlying vascular shunt (red, arterial branch; blue, draining portal vein). (c) CEUS image at 10 s postinjection shows a hemangioma (short arrow) with peripheral globular enhancement within the hypoechoic region. Also note filling of PV branch (arrowhead) in this early phase. (d) At 16 s postinjection, the hemangioma is homogeneously filled, with surrounding wedge-shaped transient hepatic attenuation difference (curved arrows) corresponding to the area of fatty sparing on gray scale
7.7.6 Transient Hepatic Attenuation Difference from Arterioportal Fistula
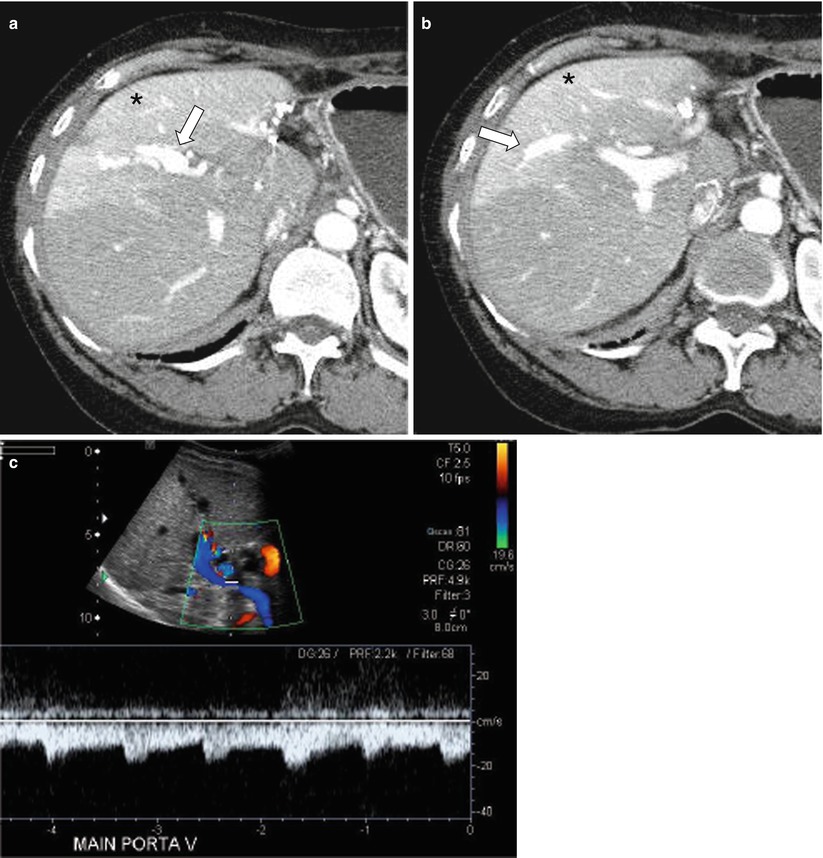
Fig. 7.6
Transient hepatic attenuation difference (THAD) from arterioportal fistula post-liver biopsy. (a, b) Arterial phase axial CT images demonstrate early, artery-like strong opacification and dilatation of the right anterior portal vein (arrow) and a resultant THAD in the corresponding portal venous tributaries (asterisk). (c) Duplex ultrasound demonstrates arterialized, reversed flow in the right and main portal veins
7.7.7 Infiltrative Hepatocellular Carcinoma with Regional Involvement
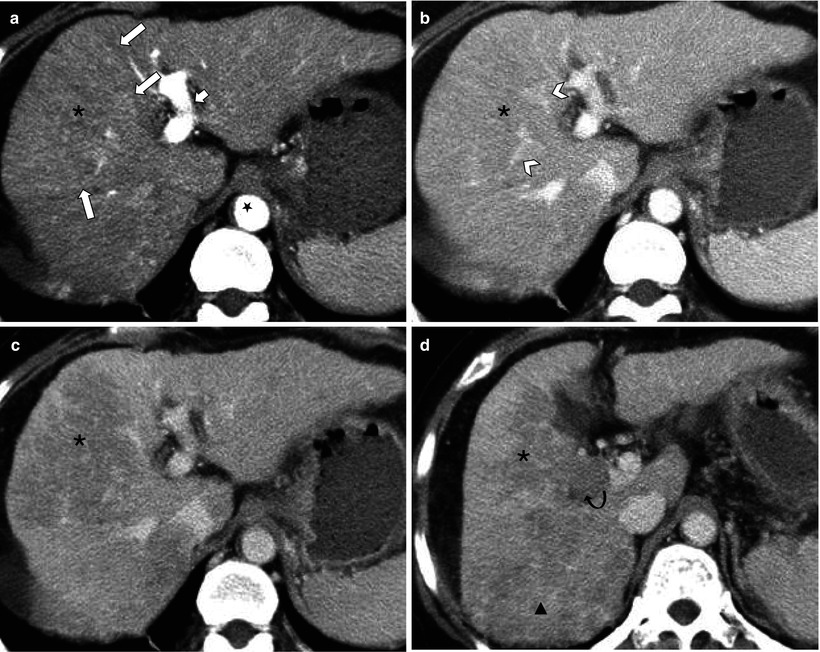
Fig. 7.7
Infiltrative hepatocellular carcinoma (HCC) with regional involvement. (a) There is a large wedge-shaped area of homogeneous hyperperfusion (asterisk) with straight border (arrows) in arterial phase. Also note left portal vein (short arrow) enhances as intensely as aorta (star) suggesting gross arterioportal shunt. (b) This area becomes iso-attenuating in portal venous phase and demonstrates undisturbed vessels within (arrowheads). The appearance on (a) and (b) resembles transient hepatic attenuation difference (THAD). (c) In 3-min delay phase, however, the area (asterisk) clearly shows washout consistent with infiltrative HCC. (d) Caudal image to C demonstrates contiguous tumor extending into right portal vein (curved arrow) and further tumor with washout posteriorly (triangle)
7.7.8 Lobar Infiltrative Hepatocellular Carcinoma
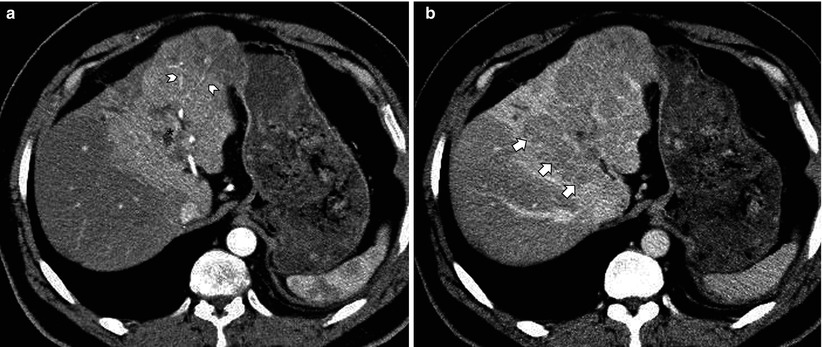
Fig. 7.8
Lobar infiltrative hepatocellular carcinoma (HCC). (a) In arterial phase, there is a large region of left lobar hyperperfusion containing undisturbed arteries (arrowheads) mimicking transient hepatic attenuation difference (THAD) due to left portal vein tumor thrombus (asterisk). (b) 3-min delay phase image, however, demonstrates washout consistent with HCC (short arrows) involving most of the left hepatic lobe, as opposed to iso- or slight hyperattenuation in case of THAD
7.7.9 Hepatic Infarction
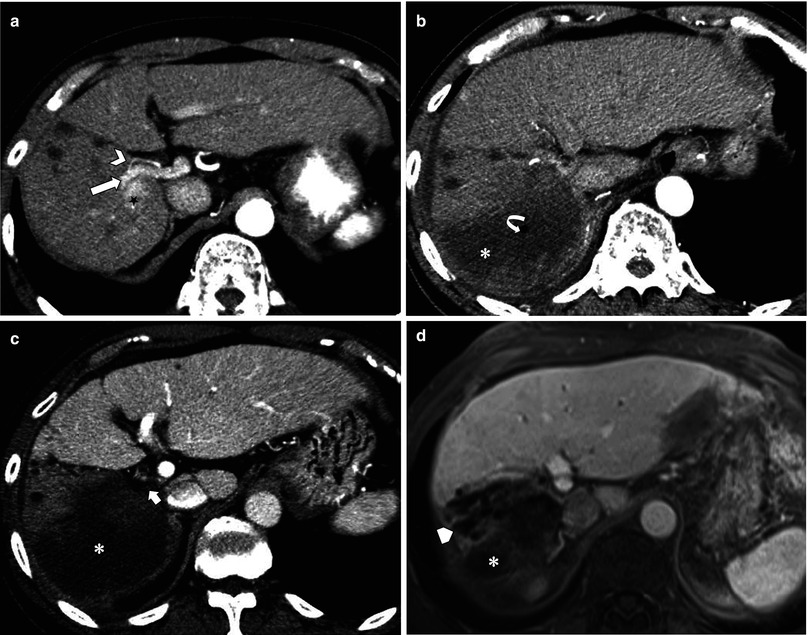
Fig. 7.9
Hepatic infarction post-radiofrequency ablation (RFA) complicated by hepatic artery (HA) and portal vein (PV) thrombosis. (a) Pre-RFA CT shows hepatocellular carcinoma (star) adjacent to right HA (arrowhead) and right PV (arrow). (b ,c) Post-RFA CT. In arterial phase (b), posterior branch of right HA is not identified due to occlusion, associated with hypoattenuation of entire right posterior segment (asterisk). Air bubble (curved arrow) from tissue necrosis is also noted. Portal venous phase (c) shows the thrombosed right PV (short arrow) and a large region of non-perfusion (asterisk). (d) 1 year later, the infarcted area shows expected atrophy (asterisk) along with progression of multiple dilated intrahepatic ducts (pentagon), presumably from biliary stricture as a sequela of ischemic injury
7.7.10 Schematic Drawing of Zonal Perfusion Changes
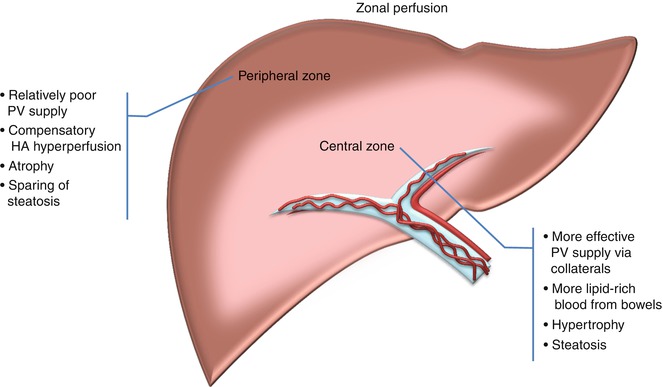
Fig. 7.10
Schematic drawing of zonal perfusion changes. In the setting of chronic main portal vein obstruction, portal cavernoma forms and allows relatively effective portal venous (PV) supply of fat-rich blood from bowel to the perihilar central zone. Consequently, the central zone shows relative hypertrophy and steatosis compared to the peripheral zone, which becomes atrophic with fatty sparing. More diminished PV inflow to the peripheral zone also results in compensatory hepatic arterial hyperperfusion leading to areas of transient hepatic attenuation difference
7.7.11 Chronic Portal Vein Obstruction with Zonal Perfusion
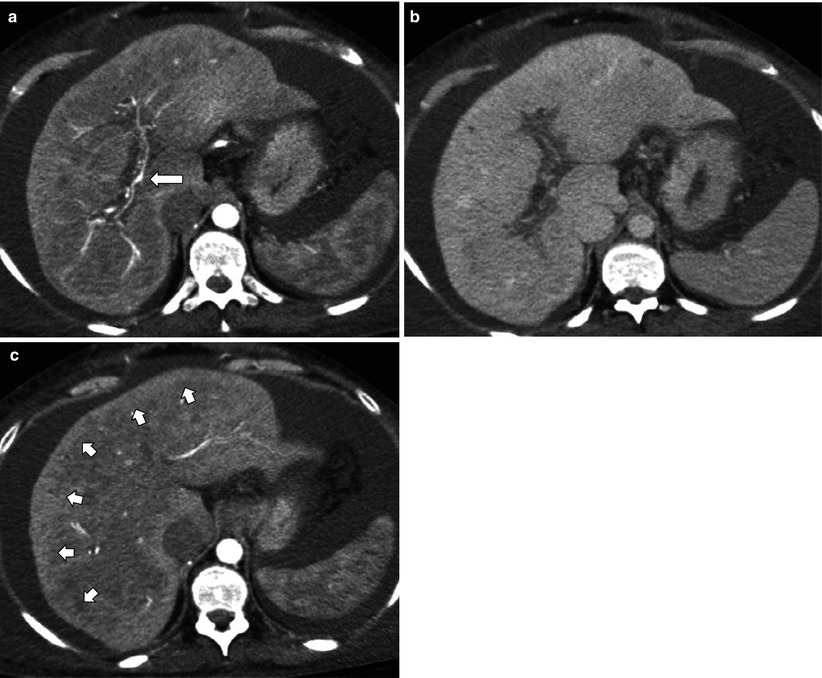
Fig. 7.11
Chronic portal vein obstruction with zonal perfusion. (a, b) Arterial (a) and portal venous (b) phase CT images show occlusion of entire portal vein. Only hepatic artery (arrow) and collaterals are visualized within the portal venous fissures. (c) Arterial phase image demonstrates a thin peripheral zone with hyperenhancement (short arrows) compared to central zone, due to relatively poorer portal flow and consequent arterial hyperperfusion and atrophy
7.7.12 Zonal Perfusion Changes from Chronic Main Portal Vein Obstruction
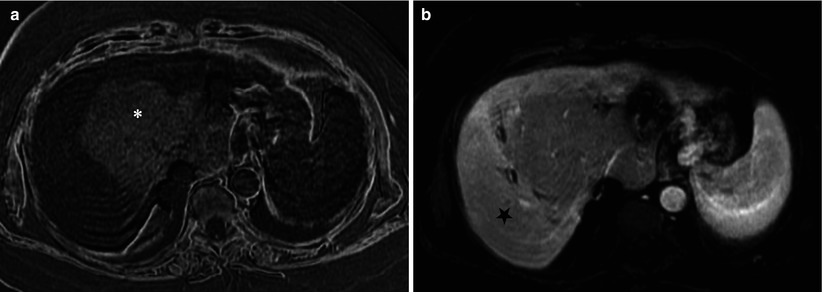
Fig. 7.12
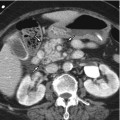
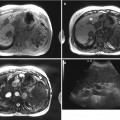
Zonal perfusion and morphologic changes from chronic main portal vein obstruction. (a) Subtraction MR image of in and opposed phases clearly demonstrates the zonal differences: hyperintensity reflecting marked steatosis of central zone with mass-like hypertrophy (asterisk), also called as partial nodular transformation. (b) Arterial phase dynamic gadolinium-enhanced image shows relative arterial hyperperfusion to the peripheral zone (star)
7.7.13 Portal Biliopathy
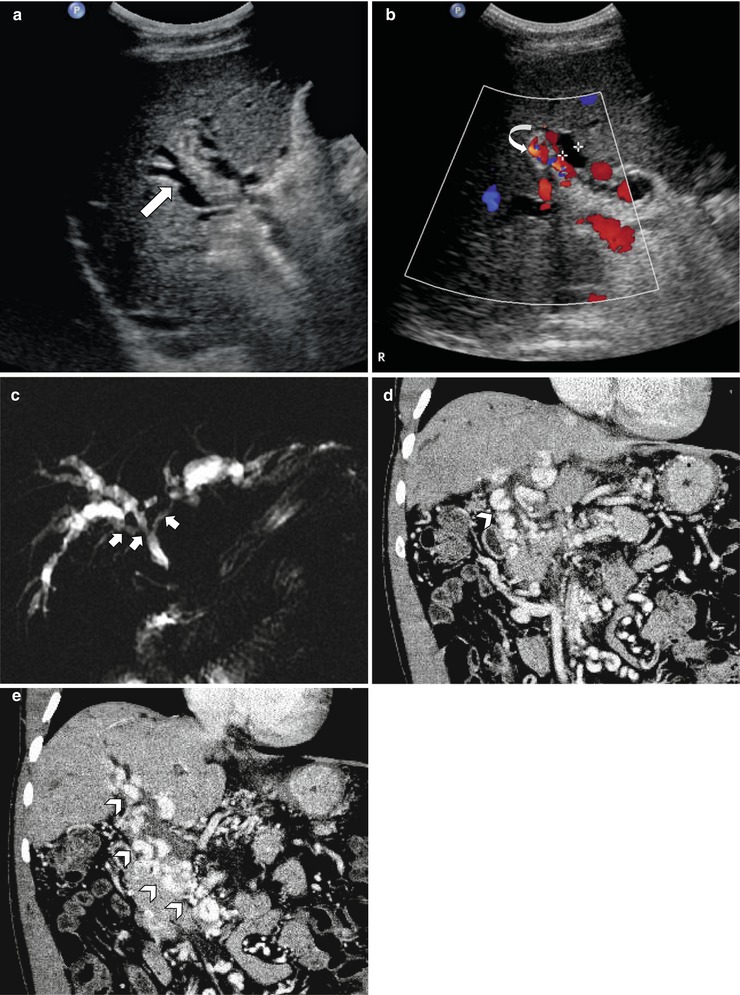
Fig. 7.13
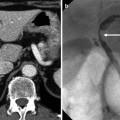
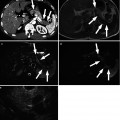
Portal biliopathy in a patient with idiopathic portal vein thrombosis. (a) Greyscale ultrasound shows dilated intrahepatic bile ducts (arrow) with no accompanying portal vein identified. (b) Color Doppler image demonstrates flow signal from multiple collateral vessels (curved arrow) at the portal alongside dilated ducts. (c) MR cholangiogram gives a global view of undulating or smooth segmental narrowing (short arrows) of the central biliary tree by collateral vessels with resultant bilateral intrahepatic biliary dilatation. (d, e) Portal venous phase coronal CT images demonstrate extensive paracholedochal collateral vessels (arrowheads) secondary to chronic occlusion of main portal vein and superior mesenteric vein, corresponding to areas of undulating narrowing in (c)
7.7.14 Common Areas of Non-portal Venous Supply
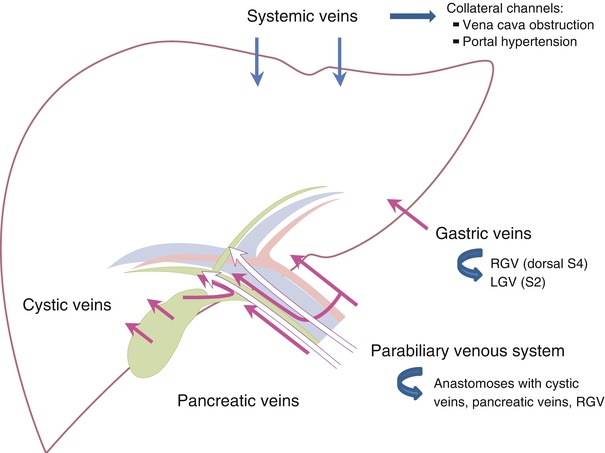
Fig. 7.14
Common areas of non-portal venous supply. Left gastric vein (LGV) into left lateral superior subsegment (S2), right gastric vein (RGV


Stay updated, free articles. Join our Telegram channel

Full access? Get Clinical Tree


