Fig. 4.1
Hepatocarcinogenesis. There are two pathways of carcinogenesis for hepatocellular carcinoma in cirrhosis: multistep pathway and de novo pathway. One or more regenerative nodules may show a number of changes in shape and size of nuclei and the cytoplasm of the hepatocytes (signs of atypia) and change into dysplastic nodules. Dysplastic nodules show an increased number of cells and cellular density. In addition, atypia within dysplastic nodules can give rise to early hepatocellular carcinoma, which represents a very early stage of HCC development with indistinct margin and finally develops into small and progressed HCC with different degrees of differentiation. LGDN = low-grade dysplastic nodule, HGDN = high-grade dysplastic nodule, EHCC = early hepatocellular carcinoma (HCC), WDHCC = well-differentiated HCC, MD or PDHCC = moderate-differentiated or poorly-differentiated HCC
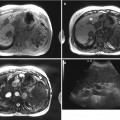
4.5.2 Small Progressive HCC Showing Typical Enhancement Pattern
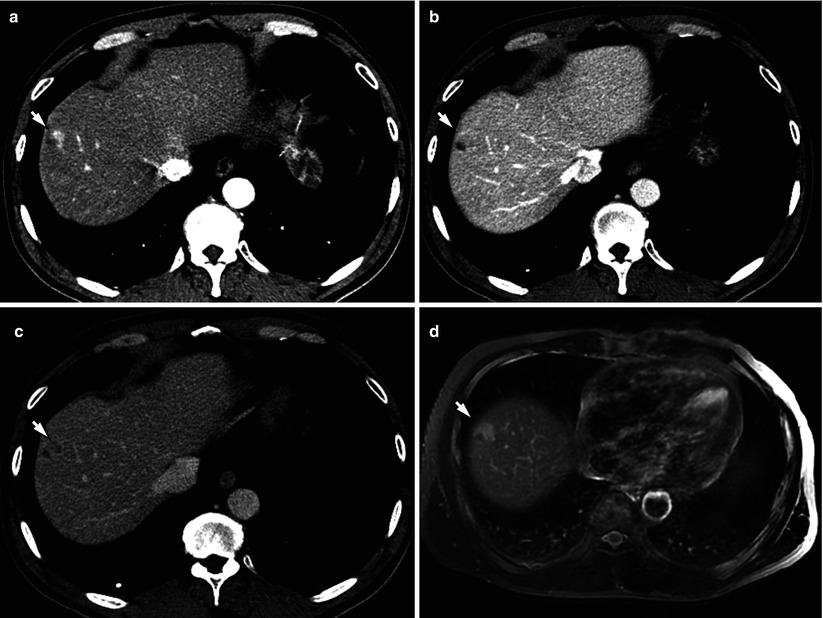
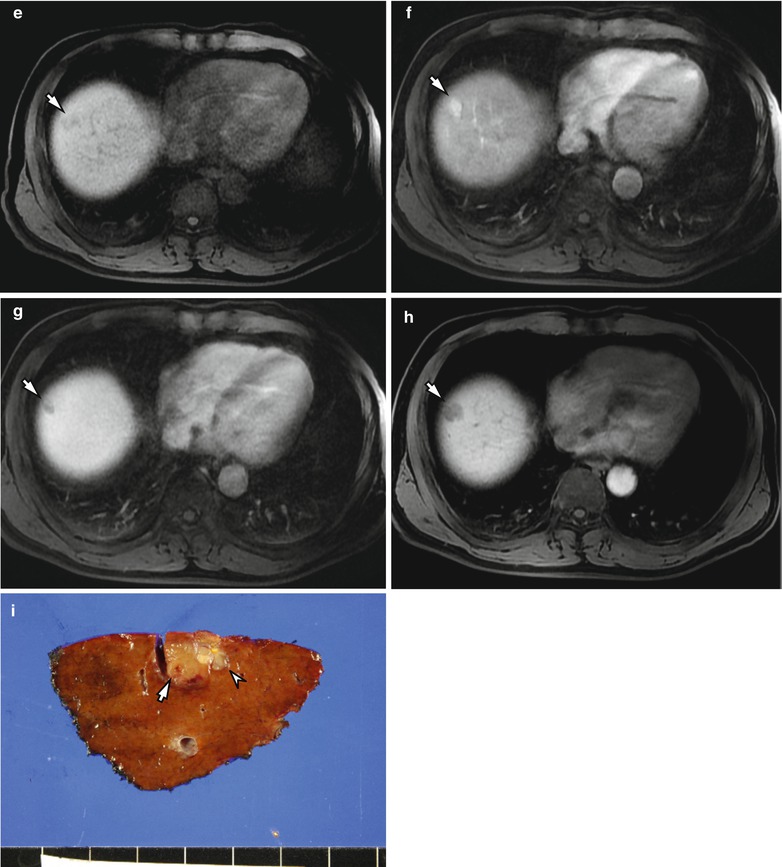
Fig. 4.2
Small progressive HCC showing typical enhancement pattern in a 59-year-old male. (a) Arterial phase CT scan demonstrates a hyperenhancing nodule (arrow) in right anterior superior segment (S8). (b, c) Portal phase (b) and delayed phase (c) CT scans show washout of the lesion (arrow). (d) Axial T2-weighted image shows that the nodule shows a hyperintensity (arrow). (e) Precontrast T1-weighted image shows a hypointense nodule (arrow) in S8. (f) Gadoxetic acid-enhanced T1-weighted image during arterial phase shows that the nodule shows a strong enhancement (arrow). (g, h) The nodule shows a hypointensity during portal phase (arrow) (f) and delayed phase (arrow) (g). (i) Specimen photograph shows a nodular HCC lesion (arrow) with small whitish nodular components (arrowhead) (multinodular confluent type)
4.5.3 Small HCC of Indistinctly Nodular Type (Early HCC)
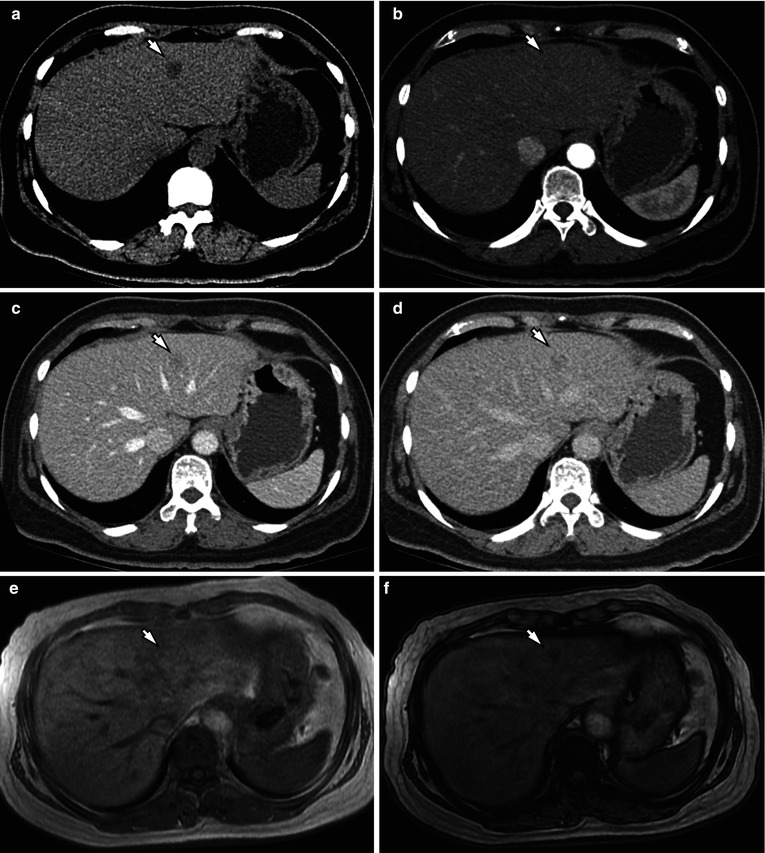
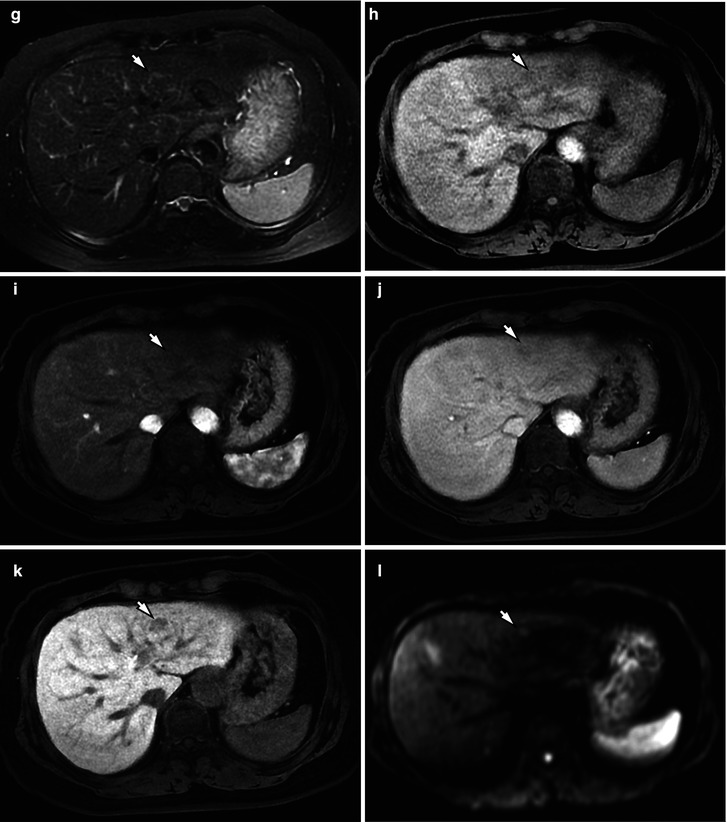
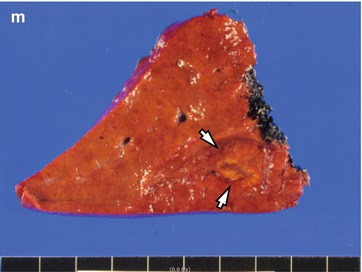
Fig. 4.3
Small HCC of indistinctly nodular type (early HCC) in a 57-year-old female. (a) Precontrast CT scan shows a hypoattenuating nodule (arrow) in left lateral inferior subsegment (S3). (b) Arterial phase CT scan demonstrates that the nodule (arrow) shows subtle hypoenhancement. (c) Portal phase CT scan demonstrates a nodule (arrow) with slight hypoattenuation. (d) Delayed phase CT scan shows a hypoattenuating nodule (arrow) compared with the surrounding liver parenchyma. (e) In-phase T1-weighted image demonstrates that the nodule (arrow) shows isointensity to adjacent liver parenchyma. (f) Opposed-phase T1-weighted image demonstrates a signal drop of the nodule (arrow) compared with in-phase T1-weighted image. (g) Fat-suppressed T2-weighted image demonstrates that the nodule (arrow) shows isointensity to adjacent liver parenchyma. (h) Fat-suppressed T1-weighted image shows a slightly hypointense nodule (arrow) in S3. (i) Gadoxetic acid-enhanced T1-weighted image during arterial phase demonstrates that the nodule (arrow) shows a strong enhancement. (j) Gadoxetic acid-enhanced T1-weighted image during portal phase demonstrates that the nodule (arrow) shows a hypointensity. (k) Gadoxetic acid-enhanced T1-weighted image during hepatobiliary phase demonstrates that the nodule (arrow) shows a hypointensity compared with adjacent liver parenchyma. Note that hepatobiliary phase image provides better lesion conspicuity than arterial or portal phase images. (l) High b-value (b = 800) diffusion-weighted image demonstrates a hyperintensity of the nodule (arrow). (m) Specimen photograph shows a vaguely nodular HCC (arrows) with an indistinct margin
4.5.4 Typical Nodular-Type HCC Showing Typical Enhancement Pattern and Pseudocapsule
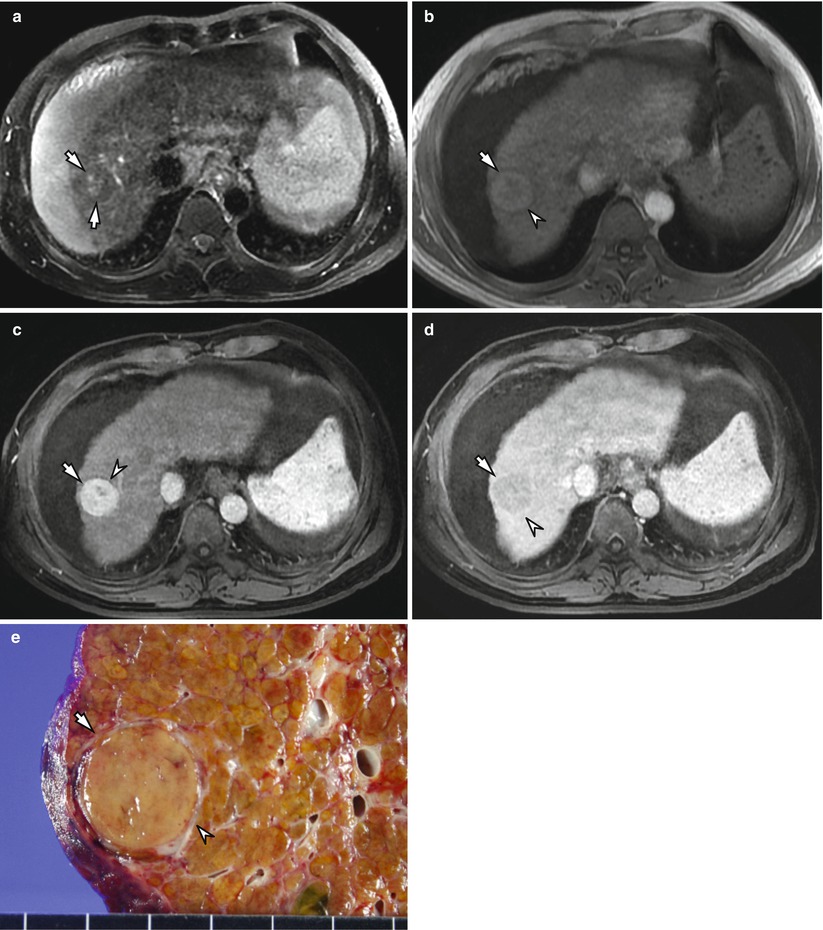
Fig. 4.4
Typical nodular-type HCC showing typical enhancement pattern and pseudocapsule in a 51-year-old male with liver cirrhosis and ascites. (a) Fat-suppressed T2-weighted image shows a nodule containing small hyperintense focus (arrows) in S8. Note that main component of the nodule shows a nearly isointensity compared with adjacent liver parenchyma. (b) Precontrast T1-weighted image also demonstrates a hypointense lesion (arrow) with a hypointense rim (arrowhead). (c) Postcontrast T1-weighted image during arterial phase demonstrates that the HCC lesion (arrow) shows a homogeneous and strong enhancement with a hypointense rim (arrowhead). (d) Postcontrast T1-weighted image during portal phase demonstrates a washout of the lesion (arrow) as well as hyperenhancing rim (arrowhead). (e) Specimen photograph shows a well-encapsulated HCC lesion (arrow) with a peripheral pseudocapsule (arrowhead)
4.5.5 Advanced Nodular-Type HCC
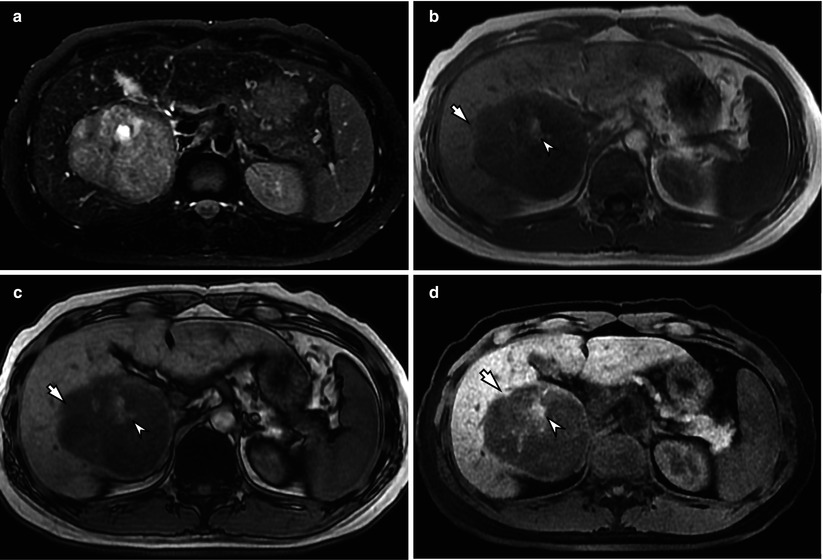
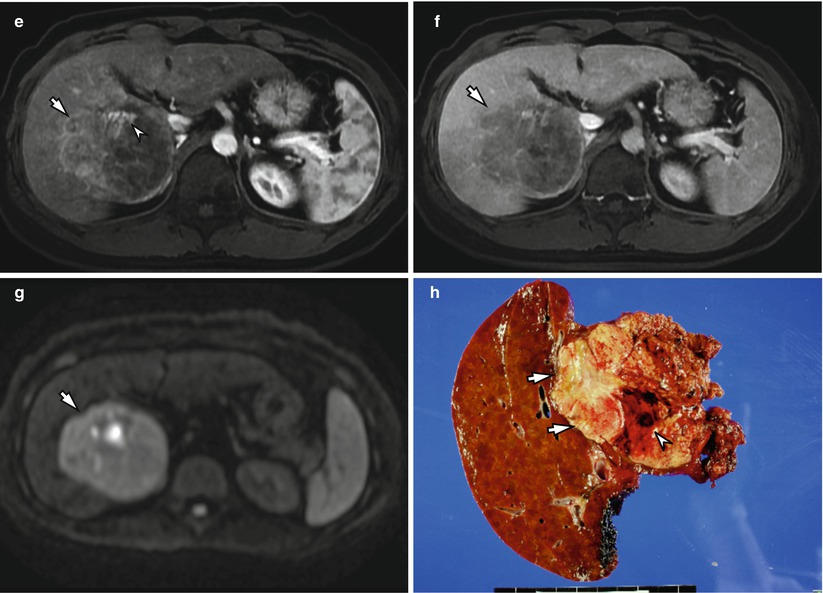
Fig. 4.5
Advanced nodular-type HCC showing intratumoral hemorrhage in a 35-year-old male. (a) Fat-suppressed T2-weighted image shows a large nodular mass (arrow) containing small hyperintense focus (arrowhead) in right posterior inferior segment (S6). Note that main component of the nodule shows an intermediate hyperintensity compared with adjacent liver parenchyma. (b) In-phase T1-weighted image demonstrates that the main portion of the lesion (arrow) shows a hypointensity to adjacent liver parenchyma. The hyperintense portion of the lesion (arrowhead) indicates intratumoral hemorrhage. (c) Opposed-phase T1-weighted image demonstrates a signal drop of the nodule (arrow) compared with in-phase T1-weighted image (b) which suggests presence of fat component within the tumor. Hemorrhagic portion shows a hyperintensity (arrowhead). (d) Precontrast fat-suppressed T1-weighted image shows a hyperintense nodule (arrowhead) with a hypointense rim (arrow). Note that the liver shows surface irregularity and a decreased volume of the right lobe. (e) Postcontrast T1-weighted image during arterial phase demonstrates a hyperenhancing nodule (arrowhead) with a hypointense rim (arrow) in segment 8. (f) Postcontrast T1-weighted image during portal phase demonstrates that the nodule shows a washout (arrow). Note that the nodule shows a hyperenhancing rim (arrowhead). (g) High b-value (b = 800) diffusion-weighted image demonstrates a hyperintensity of the lesion (arrow). (h) Specimen photograph shows a large nodular-type HCC (arrows) with an intratumoral hemorrhage (arrowhead)
4.5.6 Massive-Type HCC
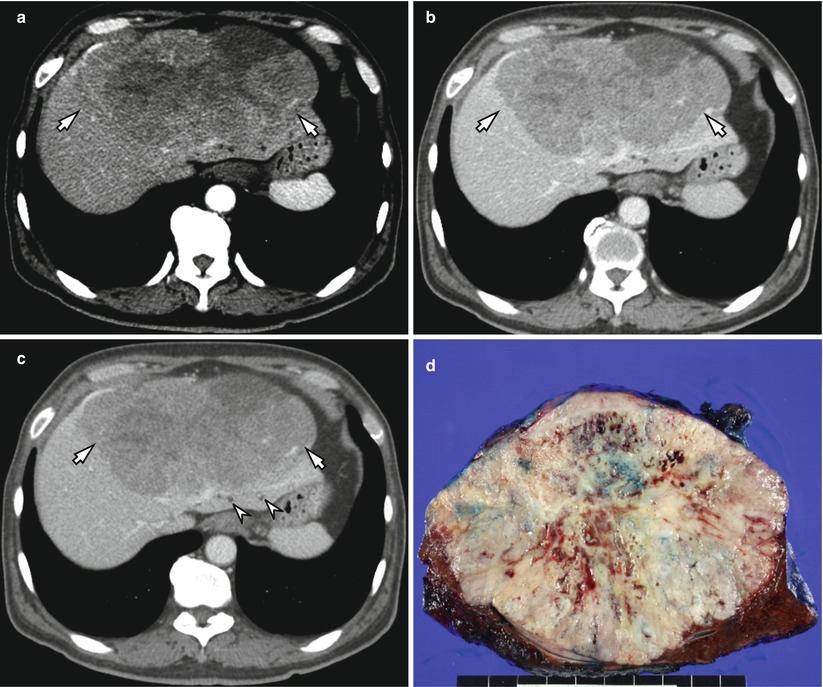
Fig. 4.6
Massive-type HCC in a 63-year-old male. (a) Contrast-enhanced arterial phase CT scan shows a heterogeneously enhancing tumor with lobulated margin (arrow). (b, c) Contrast-enhanced portal phase (b) and delayed phase (c) CT scans show washout of the tumor (arrows). Note that there are dilated bile ducts (arrowheads) posterior to the mass, probably due to compression by the tumor. (d) Specimen photograph shows a massive-type HCC lesion with lobulated margin and internal hemorrhage
4.5.7 Diffuse-Type HCC
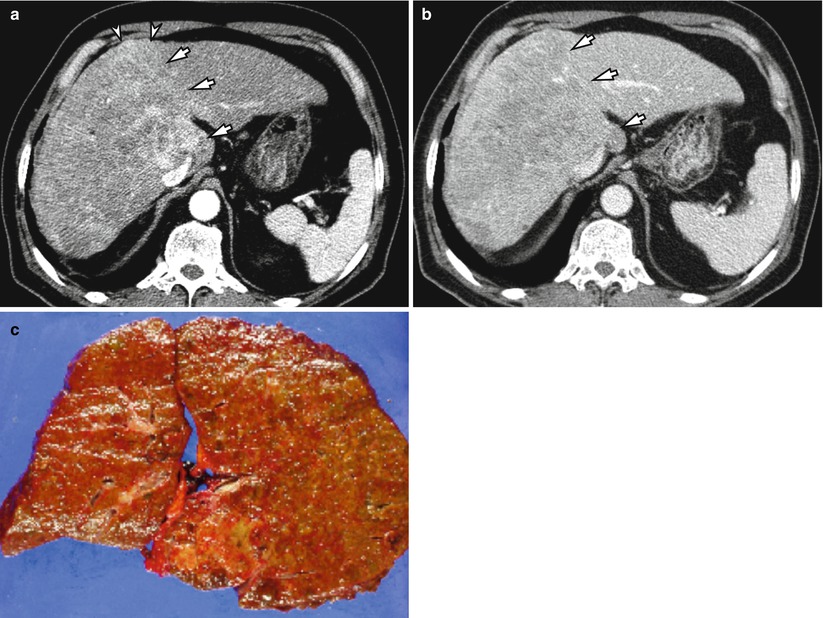
Fig. 4.7
Diffuse-type HCC in a 71-year-old male. (a) Arterial phase CT scan shows heterogeneous enhancement of the right lobe and caudate lobe (arrows) with slight contour bulging (arrowheads). Note that left lateral segment shows relatively homogeneous enhancement with smooth outer margin. (b) Portal phase CT scan shows washout (arrows) of the diffuse HCC. The presence of tumor is relatively better demonstrated on portal phase image (b) compared with arterial phase image (a). (c) A photograph of the resected specimen shows diffuse nodular changes of the liver, mimicking cirrhotic liver
4.5.8 Multistep Hepatocarcinogenesis and Changes of Intranodular Blood Supply
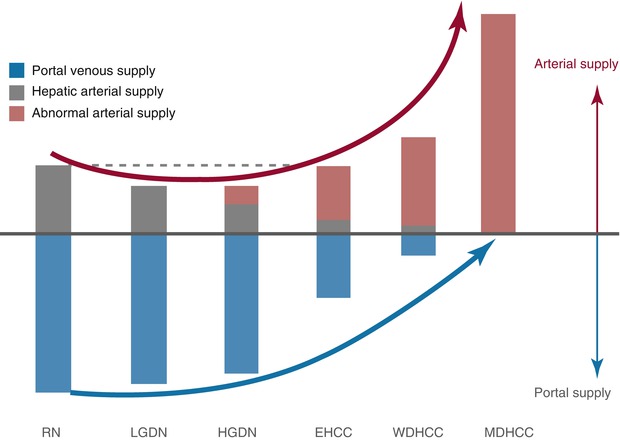
Fig. 4.8
Multistep hepatocarcinogenesis and changes of intranodular blood supply. As malignancy grade progresses, intranodular portal supply gradually decreases during early stage of hepatocarcinogenesis and finally disappears in moderately differentiated HCCs. On the contrary, arterial supply first decreases during the early stage of hepatocarcinogenesis and then acutely increases, and finally the entire nodule is fed only by artery in moderately differentiated HCCs (Courtesy of Osamu Matsui, MD, Kanazawa, Japan, modified from Matsui et al. 2011)
4.5.9 Typical Appearance of a Large Nodular-Type HCC with a Pseudocapsule
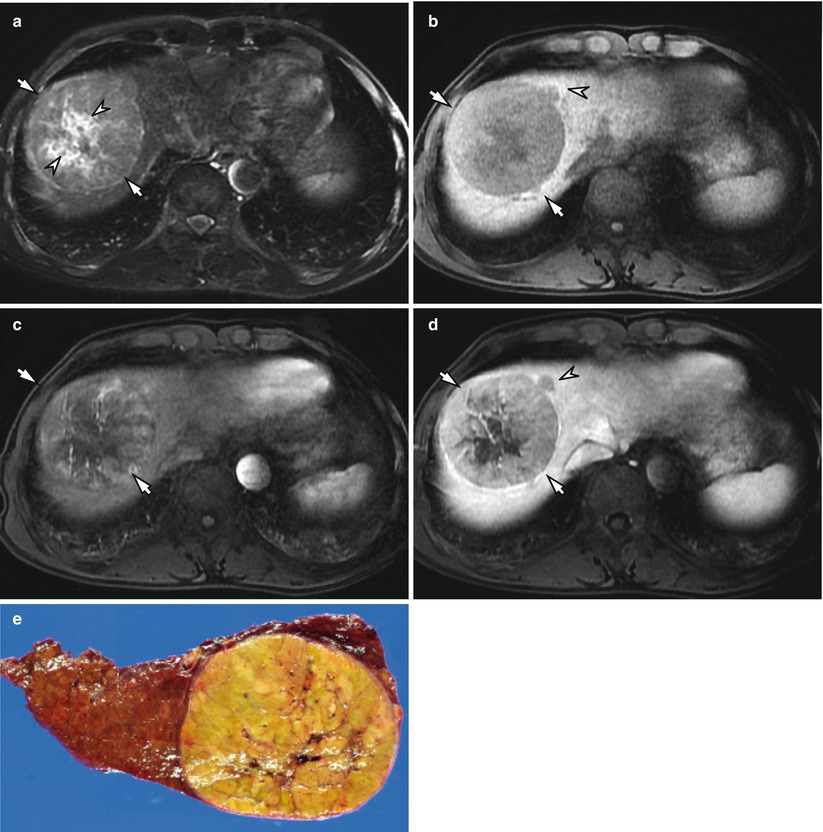
Fig. 4.9
Typical appearance of a large nodular-type HCC with a pseudocapsule in a 57-year-old male. (a) Fat-suppressed T2-weighted image shows a large nodular mass with intermediate high signal intensity in S8. Note that the lesion is surrounded by a hyperintense rim (arrows) and contains central necrosis (arrowheads) with hyperintensity compared with the main component of the tumor. (b) Precontrast fat-suppressed T1-weighted image shows a hypointense tumor (arrow) with a pericapsular extension (arrowhead). (c) Arterial phase scan of dynamic MRI shows a heterogeneously enhancing nodule in S8. (d) Portal phase scan shows washout and a hyperattenuating capsule (arrows) and pericapsular extension (arrowhead). (e) Specimen photograph shows a well-encapsulated HCC lesion
4.5.10 HCC with Corona Enhancement
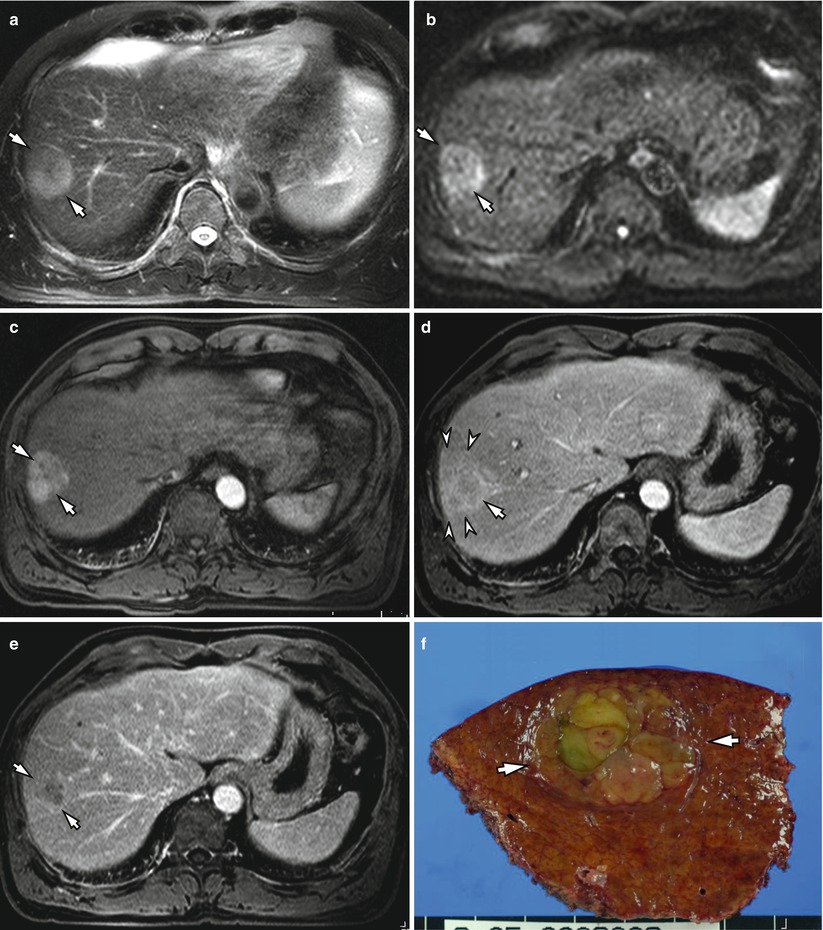
Fig. 4.10
HCC with corona enhancement in a 79-year-old male. (a) Fat-suppressed T2-weighted image shows a nodular mass with heterogeneously high signal intensity in segment 8 (arrows). (b) High b-value (b = 800) diffusion-weighted image demonstrates a hyperintensity of the lesion (arrow). (c) Contrast-enhanced T1-weighted image during arterial phase shows a heterogeneously hyperenhancing tumor (arrows). (d) Portal phase image shows a partial washout of the tumor (arrow) with peritumoral corona enhancement (arrowheads). (e) Equilibrium phase scan shows a washout of the tumor (arrows). (f) Specimen photograph shows an HCC lesion (arrows) with a well-defined margin. Note that the tumor is composed of several different components (This picture was used in the chapter written by J.M. Lee et al., Imaging Findings of Cirrhotic Liver, in Multislice-CT of the abdomen, 2012)
4.5.11 Heterogeneously Enhancing HCC with Multinodular Component and a Mosaic Appearance
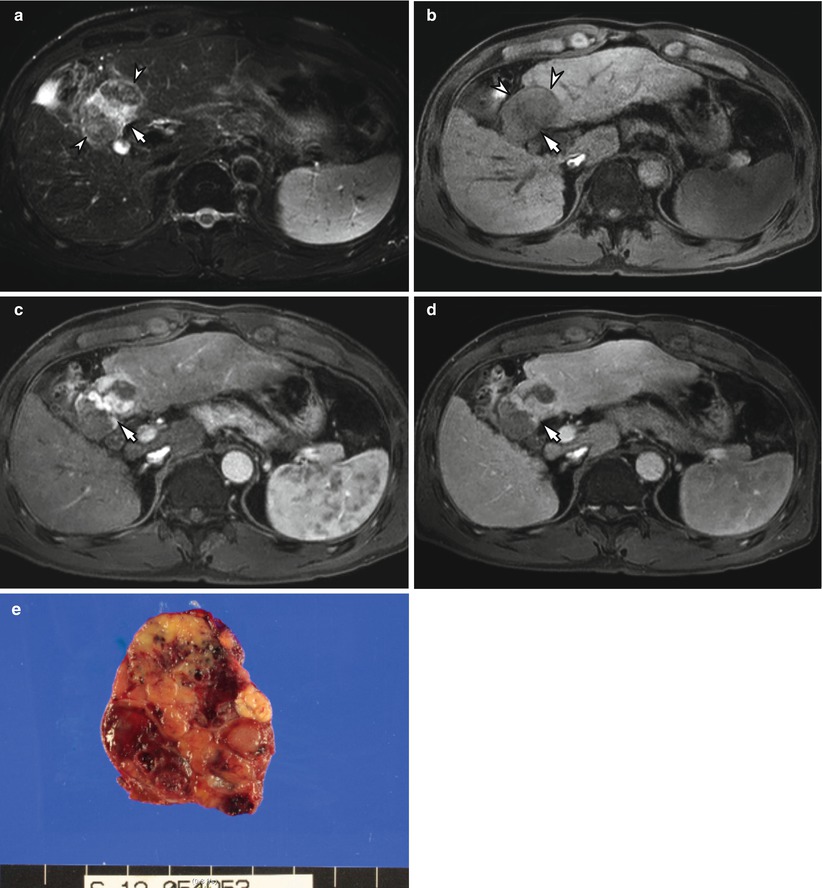
Fig. 4.11
Heterogeneously enhancing HCC with multinodular component and a mosaic appearance in a 55-year-old male. (a) Fat-suppressed T2-weighted image shows a nodular mass with heterogeneously high signal intensity in segment 4. Note that the tumor shows a central hyperintense portion (arrow) as well as peripheral isointense portions (arrowheads). (b) Precontrast fat-suppressed T1-weighted image shows a hypointense tumor (arrow) with a more hypointense rim (arrowheads). (c) Arterial phase T1-weighted image demonstrates that the mass is heterogeneously hyperenhancing (arrow) compared to the liver and shows a mosaic appearance. (d) Delayed phase CT scan shows washout of the tumor (arrow). (e) Specimen photograph shows a well-encapsulated HCC with confluent areas of tumor nodularity separated by fibrous tissue
4.5.12 Typical Hypervascular HCC with a Mosaic Appearance and a Peripheral Capsule
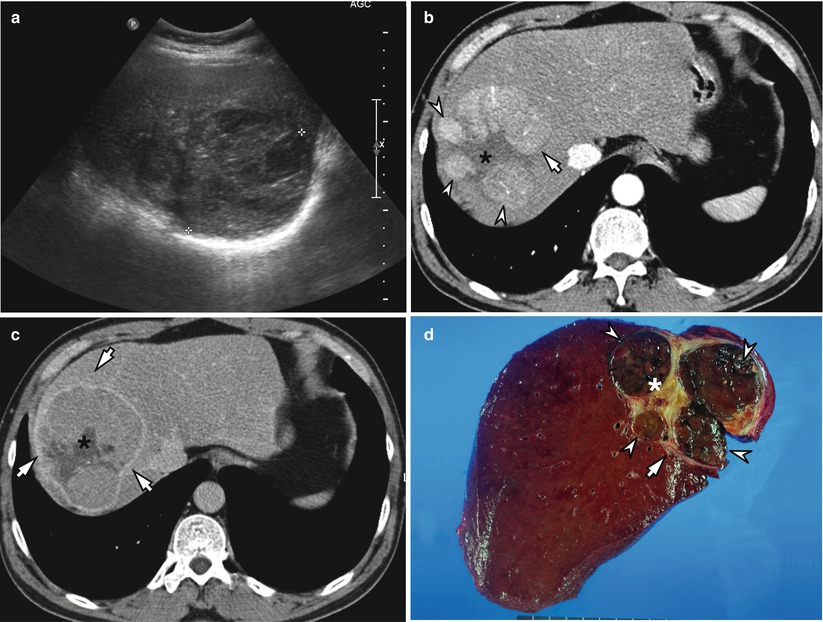
Fig. 4.12
Typical hypervascular HCC with a mosaic appearance and a peripheral capsule in a 55-year-old male. (a) Gray scale ultrasound (US) scan shows a large nodular mass with heterogeneously hypoechogenicity in right lobe of the liver. (b) Arterial phase CT scan shows a heterogeneously enhancing tumor (arrow) with a hypoattenuated center (asterisk). Note that the tumor is composed of several nodular components (arrowheads) with enhancement and central portion without showing enhancement. (c) Delayed phase CT scan shows washout of the tumor with a hyperenhancing peripheral pseudocapsule (arrows) and nonenhancing necrotic portion (asterisk). (d) Specimen photograph shows a well-encapsulated HCC (arrow) lesion with confluent areas of tumor nodularity (arrowheads) separated by fibrous tissue and necrosis (asterisk). (This picture was used in the chapter written by JM Lee et al., Imaging Findings of Cirrhotic Liver, in Multislice-CT of the abdomen, 2012)
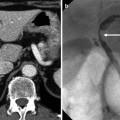
4.5.13 Diffuse HCC with Portal Vein Thrombosis
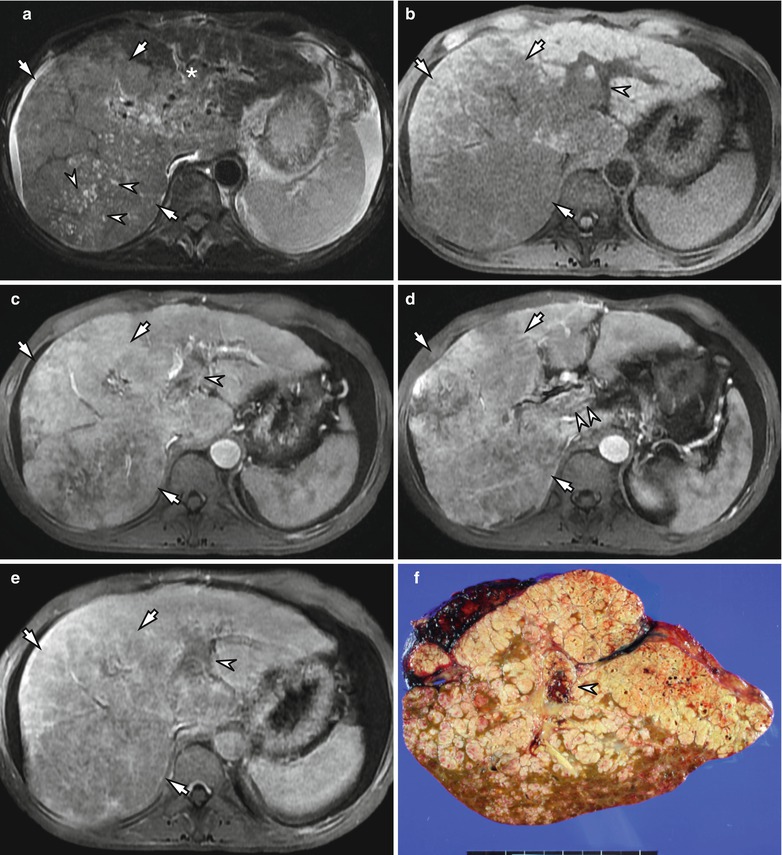
Fig. 4.13
Diffuse HCC with portal vein thrombosis in a 43 year old male. (a) Fat-suppressed T2-weighted image shows a diffuse hyperintense lesion involving right lobe, caudate lobe, and medial segment of left lobe of the liver (arrows). Note that the tumor shows several foci of hyperintensity representing necrotic portions (arrowheads) as well as thrombosis in the left portal vein (asterisk). (b) On precontrast T1-weighted image, right lobe of the liver shows hypointensity compared with the left lobe. The left portal vein is filled with thrombosis (arrowhead). (c) Arterial phase scan of dynamic MRI shows enhancing thrombus (arrowhead) within the portal vein that appears expanded. Heterogeneous enhancement is noted in the right lobe mass lesion (arrows). (d) Arterial phase scan at inferior level to C shows that there are linear enhancing vascular structures within the portal vein thrombosis (arrowheads). There is continuity between the right lobe mass (arrows) and the portal vein thrombosis. (e) Portal phase scan shows a washout of the diffuse HCC (arrows), as well as tumor thrombus within the portal vein (arrowhead). (f) Specimen photograph shows a diffuse HCC with portal vein invasion (arrowhead)
4.5.14 Small HCC Showing Discordant Enhancement on Dynamic CT and Dynamic MRI
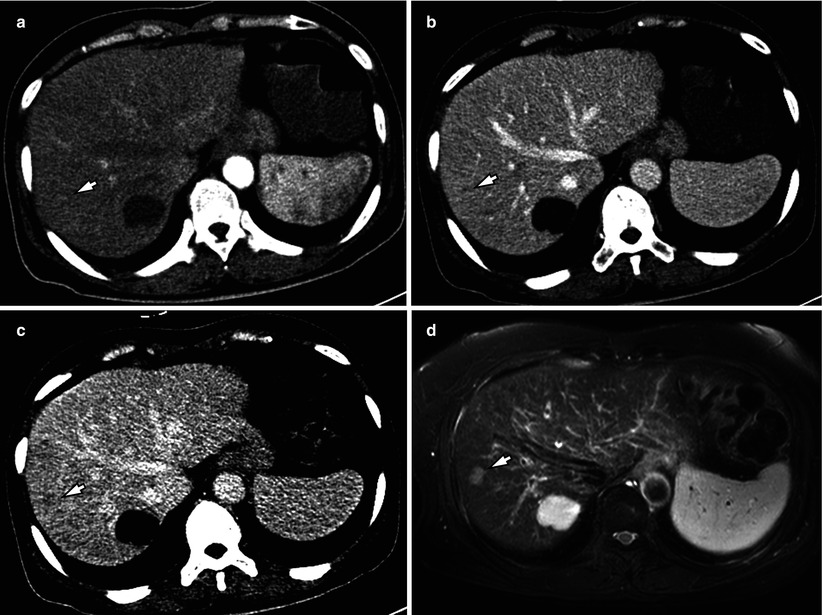
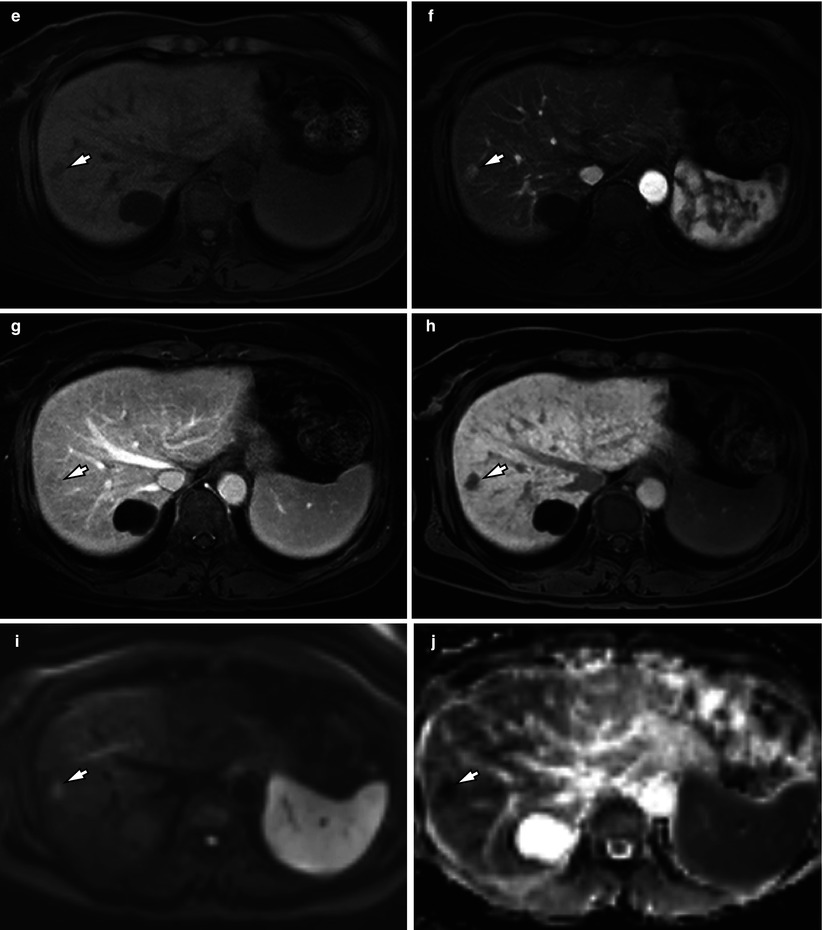
Fig. 4.14
Small HCC showing discordant enhancement on dynamic CT and dynamic MRI in a 54-year-old female. (a) Contrast-enhanced arterial phase CT scan shows nearly isoattenuated nodule (arrow) in S8 of the liver. (b) On the portal venous phase CT scan, the lesion shows a slight hypoattenuation (arrow). (c) Delayed phase CT scan shows a hypoattenuating nodule (arrow) more clearly than arterial phase or portal phase CT scans. (d) Fat-suppressed T2-weighted image shows a nodular lesion with high signal intensity in S8 (arrow). (e) Precontrast fat-suppressed T1-weighted image shows a hypointense tumor (arrow). (f) On arterial phase T1-weighted image after administration of gadoxetic acid, the nodule (arrow) demonstrates hyperenhancement. (g) Portal phase scan shows washout of the tumor (arrow). (h) Hepatobiliary phase T1-weighted image shows a clear hypointensity of the tumor (arrow) which represents decreased contrast uptake by the tumor. (i) High b-value (b = 800) diffusion-weighted image demonstrates a hyperintensity of the lesion (arrow). (j) ADC (apparent diffusion coefficient) map shows a restricted diffusion of the tumor (arrow)
4.5.15 Poorly Differentiated HCC Showing Atypical Arterial Hyperenhancement
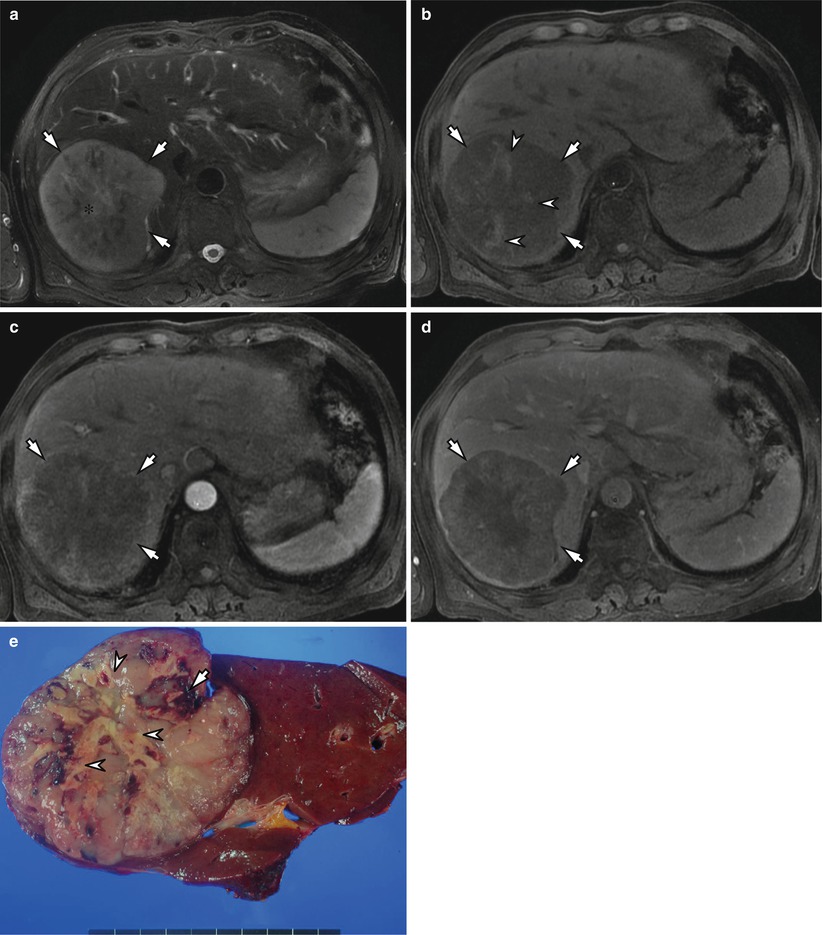
Fig. 4.15
Poorly differentiated HCC showing atypical arterial hyperenhancement in a 79-year-old male. (a) Fat-suppressed T2-weighted image shows a diffuse hyperintense mass in right posterior segment of the liver (arrows). Note that the tumor shows a central hyperintensity representing necrotic portion (asterisk). (b) Precontrast fat-suppressed T1-weighted image shows a hypointense tumor (arrows) containing hyperintense foci which represent hemorrhage (arrowheads). (c) Arterial phase T1-weighted image shows that the main portion of the lesion shows hypointensity and peripheral portion of the tumor shows weak hyperenhancement (arrows). (d) Portal phase T1-weighted image shows a hypointense lesion with a well-defined margin (arrows). (e) Specimen photograph shows a nodular-type HCC with necrotic foci (arrowhead) and hemorrhage (arrow)
4.5.16 Small HCC of Indistinctly Nodular Type (Early HCC) and Dysplastic Nodule
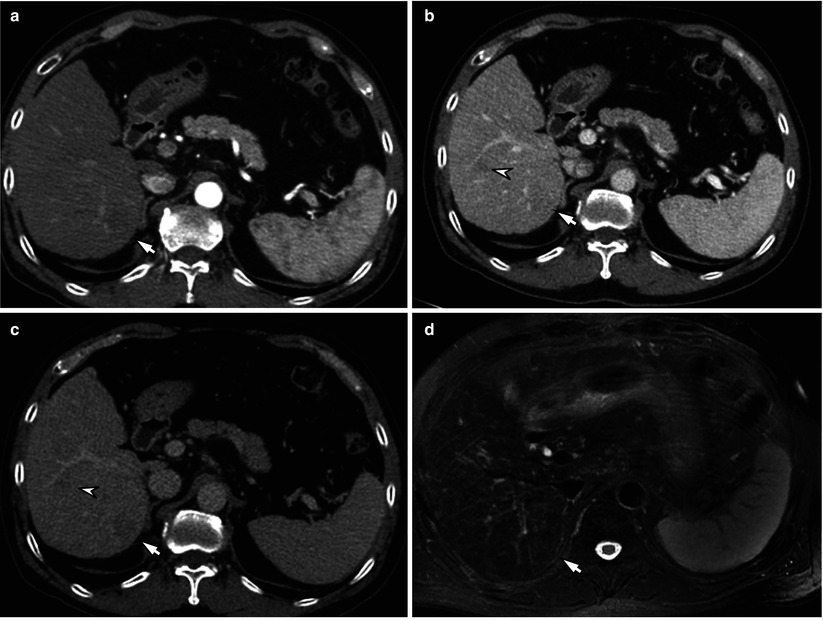
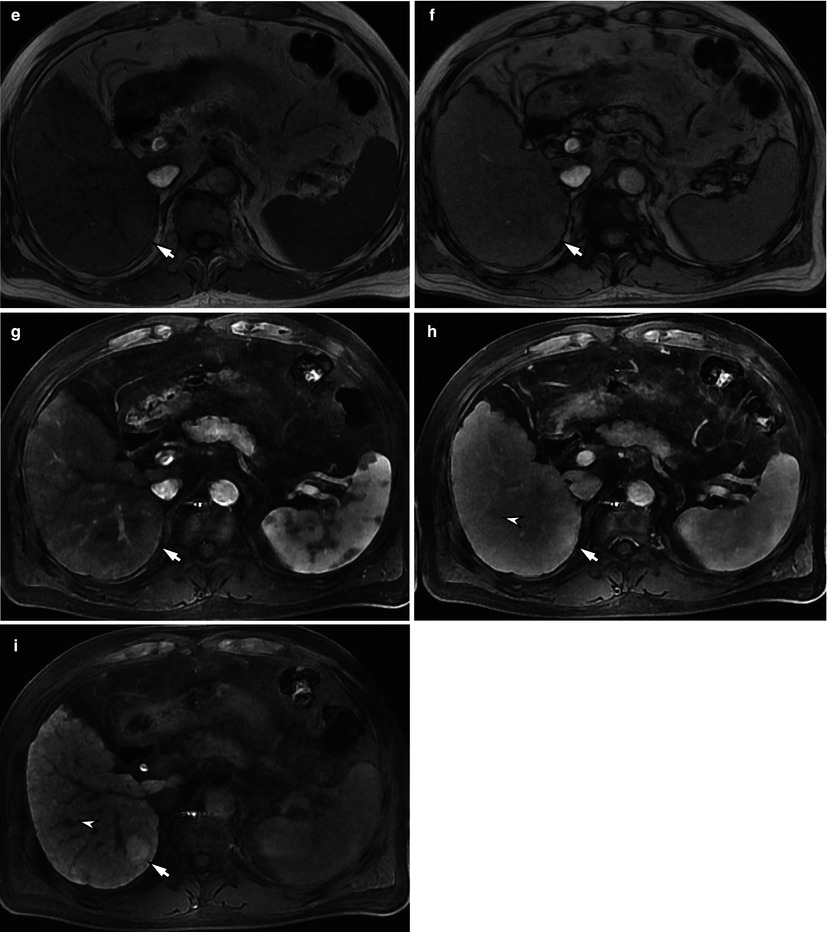
Fig. 4.16
Small HCC of indistinctly nodular type (early HCC, arrowhead) and dysplastic nodule (arrow) in a 66-year-old male. (a) Arterial phase CT scan demonstrates a nodule with subtle hypoenhancement in right posterior inferior segment (S6) (arrow). (b) Portal phase CT scan demonstrates additional hypoattenuated nodule (arrowhead) in right anterior inferior segment (S5) as well as hypoattenuated nodule in S6 (arrow). (c) Delayed phase CT scan shows that both nodules (arrow and arrowhead) show hypoattenuation compared with the surrounding liver parenchyma. (d) Fat-suppressed T2-weighted image demonstrates that the nodular lesion in S6 (arrow) shows near isointensity. (e, f) In-phase (e) and opposed-phase (f) images show that the nodule in S6 (arrow) shows hyperintensity compared with adjacent liver parenchyma. (g) On arterial phase T1-weighted image after administration of gadoxetic acid, the nodule in S6 (arrow) demonstrates no hyperenhancement. (h) Portal phase scan shows no washout of the tumor (arrow) in S6. Note that additional lesion (arrowhead) shows subtle hypointensity. (i) On hepatobiliary phase T1-weighted image, the lesion in segment 5 shows a clear hypointensity of the tumor (arrowhead), which represent decreased contrast uptake by the tumor. However, the nodule in S6 (arrow) shows hyperintensity which represents increased contrast uptake of the tumor. Biopsy of the lesions in S5 (arrowhead) and S6 (arrow) turned out to be an early HCC and dysplastic nodule, respectively
4.5.17 Large HCC with Fatty Metamorphosis
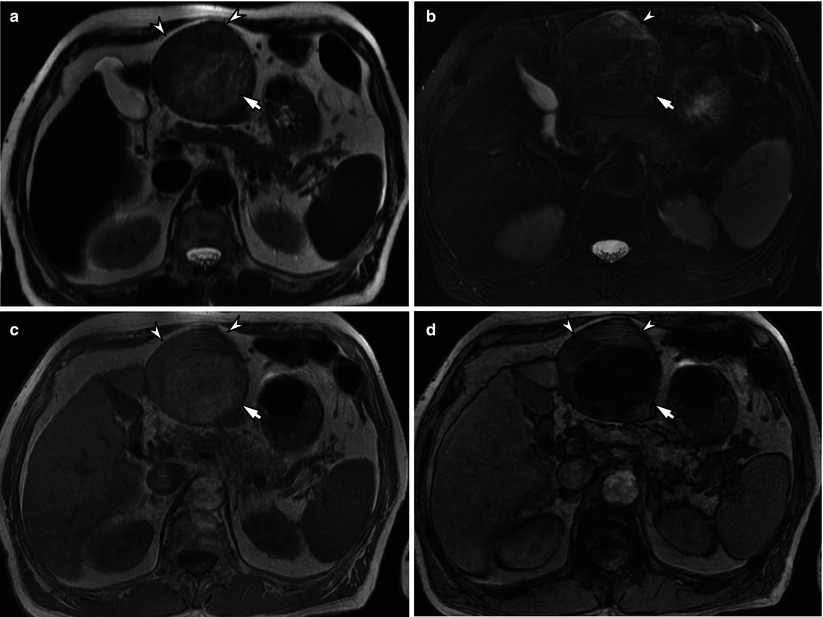
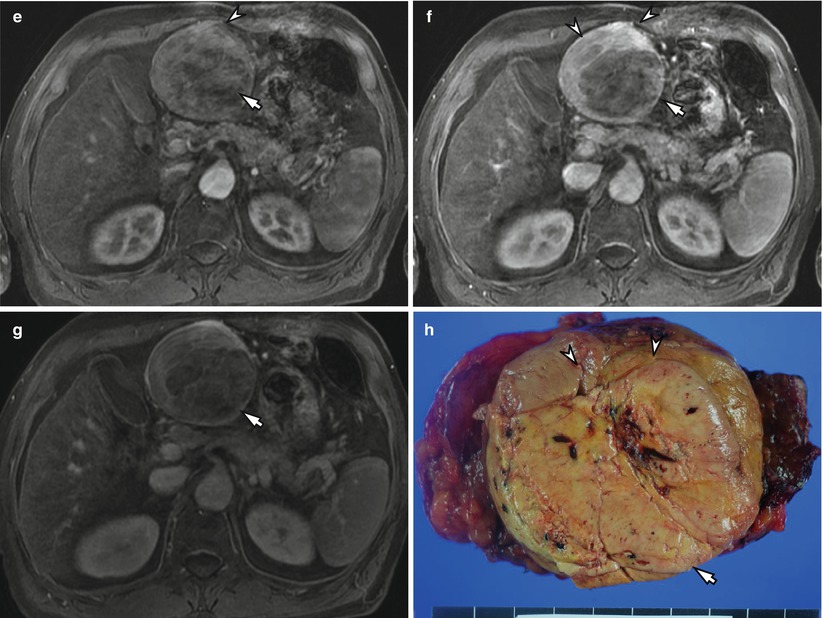
Fig. 4.17
Large HCC with fatty metamorphosis. (a) T2-weighted image demonstrates a heterogeneously hyperintense nodular lesion in left medial inferior subsegment (S3) (arrowheads) with a well-defined margin. The posterior portion (arrow) of the lesion shows hyperintensity than anterior portion of the tumor. (b) Fat-suppressed T2-weighted image demonstrates that the posterior portion (arrow) of the lesion shows a signal drop compared with T2-weighted image (a), which suggests a presence of fat. (c) In-phase T1-weighted image shows a well-encapsulated, round mass (arrowheads) with heterogeneously hyperintensity in S3. Note that posterior portion of the lesion (arrow


Related posts:


Stay updated, free articles. Join our Telegram channel
Full access? Get Clinical Tree
