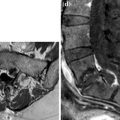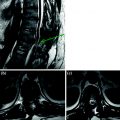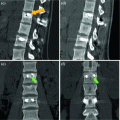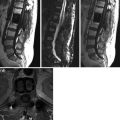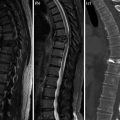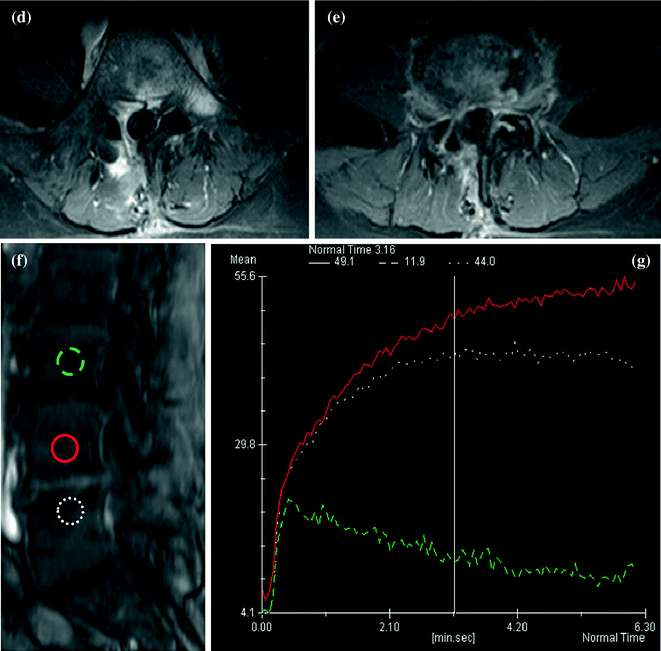
Fig. 1
a–f. SE T1 (a) and FSE T2 fat sat (b) sagittal, CE fat sat SE T1 sagittal (c) and axial (d–e), PWI (f–g). Septic spondylodiscitis in L4–L5 with involvement of disk and adjacent vertebral bodies: T1 hypointensity (a), T2 hyper intensity (b) and CE (c–e). PWI with diagram intensity/time in ROI inside normal and pathological regions. In pathological areas there is increase of perfusion index (f–g)
< div class='tao-gold-member'>
Only gold members can continue reading. Log In or Register to continue
Stay updated, free articles. Join our Telegram channel

Full access? Get Clinical Tree


