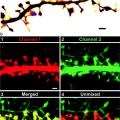
Fig. 1.
The principle of uPAINT is based on the real-time imaging and tracking of single fluorescent ligands while they label their membrane biomolecules targets. A low concentration of fluorescent ligands is introduced in the extracellular medium such that a constant rate of membrane molecules is being labeled during the imaging sequence. Oblique illumination of the sample is used to excite predominantly fluorescent ligands, which have bound to the cell surface while not illuminating the molecules in the above solution.
One of the key features of uPAINT is to image in real time single fluorescent ligands binding to their target. For this purpose, high affinity luminescent ligands are placed in the recording medium at the appropriate concentration under the microscope so that single molecules can be imaged and their trajectories can be isolated. Oblique illumination is required in order to selectively excite fluorescent ligands that have bound to their target and not those present in solution above the cellular membrane. Akin to any single molecule based super-resolution method, image analysis is an important step. Furthermore, as thousands of long lasting trajectories can be obtained on single cells with uPAINT, the amount of information generated per cell is considerable. It thus requires adequate dynamic analysis and visualization strategies to be handled. The following sections describe each of these steps and discuss the protocols in order to successfully achieve results from uPAINT experiments.
2 Materials
There are different types of equipment needed for successful uPAINT experiments. They are used for labeling, acquisition and image processing. Examples of equipment and their suppliers used in our laboratories are listed below.
2.1 Reagents
1.
Fluorescence free immersion oil (FF Cargille).
2.
Fluorescent Tetraspec beads (Invitrogen) for image registration.
3.
Protein labeling kit for obtaining fluorescent ligands, e.g., antibodies coupled to NHS ester Atto dyes (ATTO-TEC GmbH) or NHS ester Cy3/Cy5 dyes (Amersham CyDye™ Antibody Labeling Kits, GE Healthcare Life Sciences).
4.
Salt based recording medium: 100 mM NaCl, 5 mM KCl, 10 mM Glucose, 2 mM CaCl2, 2 mM MgCl2, at pH 7.4 (Hepes 20 mM/NaOH).
5.
Ringer medium: 150 mM NaCl, 5 mM KCl, 2 mM CaCl2, 2 mM MgCl2, 10 mM HEPES, 11 mM Glucose, at pH 7.4 (if performing exogenous labeling; see Subheading 3.3).
7.
Phosphate Buffer Solution (PBS).
8.
Bovine Serum Albumin (BSA).
9.
Dimethyl Sulfoxide (DMSO).
10.
Gel filtration column filled with G-25 Sephadex (Sigma-Aldrich).
11.
Dulbecco’s Modified Eagle Medium (DMEM).
12.
Fetal Bovine Serum (FBS).
13.
Rat collagen I or human fibronectin.
14.
Poly-lysine solution.
15.
Amaxa Nucleofactor II Device (Lonza).
16.
Neurobasal Medium.
2.2 Instrumentation
1.
Inverted microscope (Olympus IX 71, Nikon TiE or equivalent).
2.
High NA (1.45 or 1.49) oil immersion objectives.
3.
Continuous Wave (cw) lasers for excitation depending on the fluorophore to be imaged, e.g., 23 mW HeNe laser (Thorlabs), frequency doubled Nd:Yag (Coherent) or solid state lasers.
4.
Low noise highly sensitive electron multiplying CCD camera, e.g., QuantEM or Cascade (Photometrics).
5.
Several optical and opto-mechanical components including mirror and lenses.
6.
Fast shutter (Uniblitz) or AOTF (AA optoelectronic).
7.
For each dye, an appropriate set of filters (Chroma or Semrock) is required.
8.
Fluorescence free immersion oil (FF Cargille).
9.
Ludin opened sample holder (Life Imaging Services).
10.
Microscope temperature (37°C) control system (Life Imaging Services).
11.
Fluorescent Tetraspec beads (Invitrogen) for image registration.
12.
Computer for image acquisition.
13.
Software for image acquisition (Metamorph).
14.
Computer for image processing and visualization.
15.
Software for image processing and visualization (Metamorph, ImageJ, Matlab).
3 Methods
3.1 Optical Setup
Image acquisition of single molecules with high signal-to-noise ratio is a critical step for efficient reconstruction of super-resolved images. The final nanometric resolution will directly depend on this signal-to-noise ratio (9, 10).
3.1.1 Microscope
This protocol was optimized using an inverted microscope equipped with a 1.45 NA 100× oil immersion objective. Highly fluorescent organic dyes (e.g., ATTO647N or Cy3) are detected using a sensitive and rapid EM-CCD camera. Fluorescence excitation sources are CW lasers (e.g., frequency doubled Nd:Yag laser, solid state laser or He:Ne laser). Excitation laser beams enter through the fluorescence epiport of the microscope and illuminate a wide field area of 10–20 μm in diameter of the sample by focusing the beam in the back aperture of the objective. For uPAINT, oblique illumination is required to avoid exciting the out of focus fluorescent ligands in the solution. This is achieved by translating the focused beam with respect to the axis of the objective, on the periphery of the back aperture of the objective (Fig. 2), akin to total internal fluorescence microscopy. Illumination intensities are of a few kW/cm2. For each type of dye used, an appropriate set of fluorescent filters is required. The total detection efficiency of a typical experimental single molecule setup is in the range of 5–10%.
Fig. 2.
Schematics of the optical setup.
3.1.2 Resolution and Trajectory Lengths
With this detection efficiency, 1,000 counts are commonly detected in 50 ms from a typical single fluorophore (11). This translates in a typical pointing accuracy (or localization precision) of 40–50 nm. We emphasize that different definitions of the pointing accuracy are often used. Here, we use the Full Width at Half Maximum (FWHM) of the distribution of the localizations obtained from a fixed molecule which is repetitively imaged. With this definition and using the Rayleigh criterion to define the resolution at which two molecules can be discriminated, the resolution is equal to the pointing accuracy. Some authors alternatively use the standard deviation of fixed molecule localizations for defining the pointing accuracy or localization precision, which provides values 2.3 times lower than the definition used here. We generally prefer our definition, since, in the latter case, the pointing accuracy gives lower values than the resolution (factor of 2.3), which might induce confusing comparisons of different sets of data.
If longer integration times are used (at the price of fewer data points in a trajectory), improved pointing accuracies are obtained. For a shot noise limited detection, the pointing accuracy will improve with the inverse of the integration time (10) yielding ∼20–30 nm resolution for 150 ms integration time. It is worth mentioning that when mobile molecules are imaged, the movements of the molecules might affect the pointing accuracy.
The number of points of a single molecule trajectory depends on the photo-physical properties of the imaged dye. In practice, and for a given dye, it depends on the excitation intensity and integration time used. Typically, one uses close to video rate imaging (50 ms integration times) at saturation intensities (∼1 kW/cm² for the most common dyes). With these parameters, one can obtain typically 10–15% of the trajectories lasting more than 1 s, in the case of ATTO647N dyes (7) (Fig. 3).
Fig. 3.
Distribution of single molecule trajectory lengths measured with ATTO647N on a live cell. Adapted from (7).
With uPAINT, and unlike standard single molecule methods, single point source emitter detection is ensured by the real time imaging of each individual ligand binding to its target membrane molecule regardless of the number of fluorophores it carries. Thus, one can take advantage of this feature to improve the pointing accuracy by coupling multiple dyes per ligand. For instance, with four fluorophores per ligand instead of one, the average pointing accuracy is improved by a factor of 2 under identical excitation intensity. Optionally, in order to lengthen the obtained trajectories, one can reduce the excitation intensity while keeping the same pointing accuracy as when a single dye molecule is used (7).
3.1.3 Oblique Illumination, Choice of the Angle
By creating a thin sheet of light above the coverslip surface, oblique illumination allows selecting individual fluorescent ligands which have bound to the cell surface while rejecting the great majority of molecules in solution. This improves signal to noise ratios and avoids photobleaching of unbound fluorescent ligands. The choice of the angle depends on the thickness of the cells to be imaged. A typical choice is ∼5° such that the resulting sheet of light has a thickness of Δx ∼2 μm in the center of the field of view. Assuming 3-dimensional isotropic diffusion of the fluorescent ligands freely diffusing in the solution, the diffusion coefficient D is well known and relates the ligand hydrodynamic diameter d and the fluid viscosity η by the Stokes-Einstein relation:  , where k B is the Boltzmann constant and T is the temperature. For ligand hydrodynamic sizes of d ∼5–10 nm, D is of the order of ∼40–80 μm²/s and the average time they spend in the 2D sheet of light is 2Δx 2/2D which lies below ∼100 ms. This indicates that such unbound fluorescent molecules should not appear statistically in more than one or two consecutive images if 50 ms integration times are used. Such unwanted events can be rejected in the analysis by omitting the first two molecular detections in each trajectory (see below).
, where k B is the Boltzmann constant and T is the temperature. For ligand hydrodynamic sizes of d ∼5–10 nm, D is of the order of ∼40–80 μm²/s and the average time they spend in the 2D sheet of light is 2Δx 2/2D which lies below ∼100 ms. This indicates that such unbound fluorescent molecules should not appear statistically in more than one or two consecutive images if 50 ms integration times are used. Such unwanted events can be rejected in the analysis by omitting the first two molecular detections in each trajectory (see below).3.2 Fluorescent Labels
High affinity fluorescent ligands for the molecule to be studied are needed with uPAINT (see Note 1). We describe here a procedure when an antibody is used as a label, either to study endogenous proteins when a high quality antibody is available or GFP expressed proteins using anti-GFP for instance. Other types of fluorescent labels can also be used depending on the proteins studied, such as Ni2+ tris-nitrilotriacetic acid (TrisNTA) when the target protein bears an extracellular poly-histidine tag (7, 12). The protocol for antibody labeling with ATTO647N-NHS-ester (Atto-Tech) is a modified version of the manufacturer’s procedure. Keep in mind that coupling a too low quantity of antibodies decreases the efficiency of the reaction. An amount of 200–300 μg is the minimum quantity required to obtain a good coupling.
1.
 Introduction: Nanoimaging Techniques in Biology
 Two-Color STED Imaging of Synapses in Living Brain Slices
 Secondary Ion Mass Spectrometry Imaging of Biological Membranes at High Spatial Resolution
 High Data Output Method for 3-D Correlative Light-Electron Microscopy Using Ultrathin Cryosections
 Functional AFM Imaging of Cellular Membranes Using Functionalized Tips
 Nanoimaging Cells Using Soft X-Ray Tomography


For coupling, antibodies should be in an amine-free buffer. If the buffer contains amines, dialysis should be performed and antibodies should be resuspended in PBS 1×. For many commercial antibodies, addition of BSA is required during the experiments in order to decrease nonspecific labeling. If this is the case, BSA should not be mixed to the antibodies during the antibody/dye labeling procedure to prevent preparing fluorescent BSA proteins.
Related posts:
Introduction: Nanoimaging Techniques in Biology
Two-Color STED Imaging of Synapses in Living Brain Slices
Secondary Ion Mass Spectrometry Imaging of Biological Membranes at High Spatial Resolution
High Data Output Method for 3-D Correlative Light-Electron Microscopy Using Ultrathin Cryosections
Functional AFM Imaging of Cellular Membranes Using Functionalized Tips
Nanoimaging Cells Using Soft X-Ray Tomography
Stay updated, free articles. Join our Telegram channel
Full access? Get Clinical Tree
