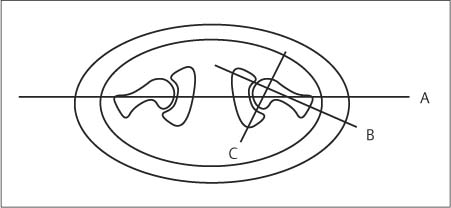
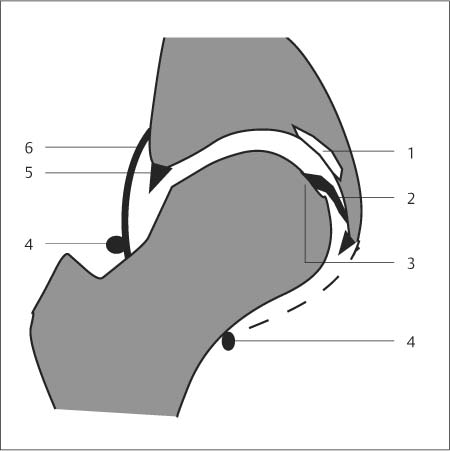
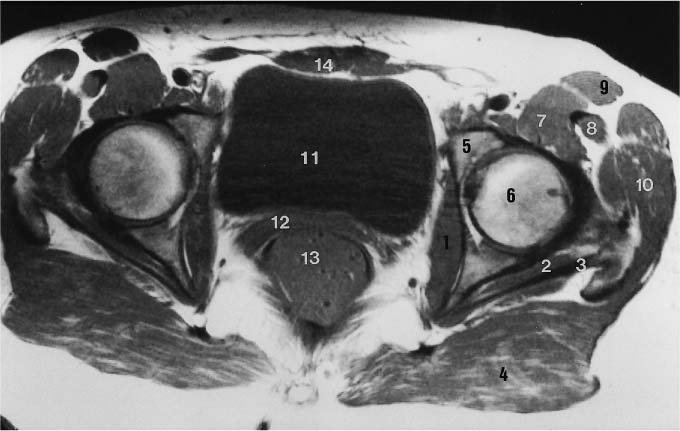
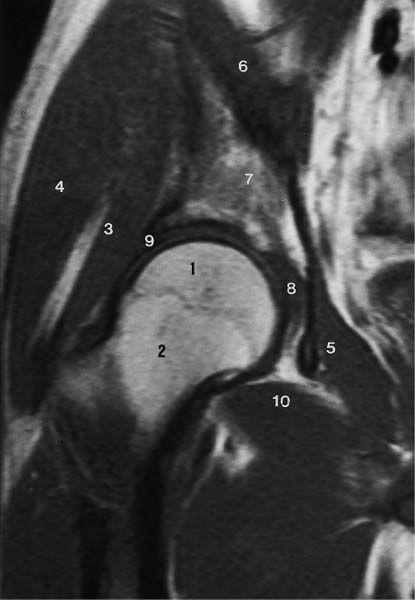
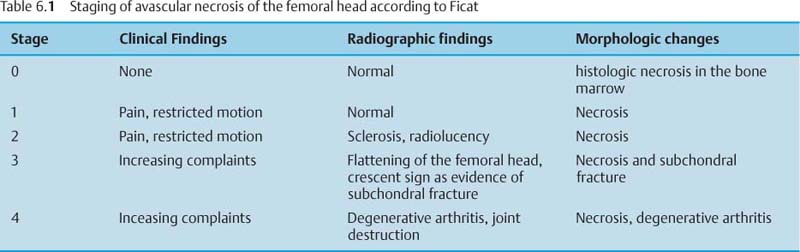
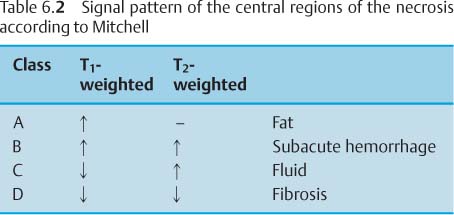
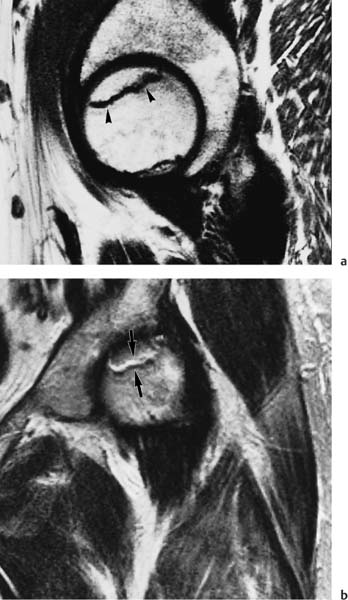
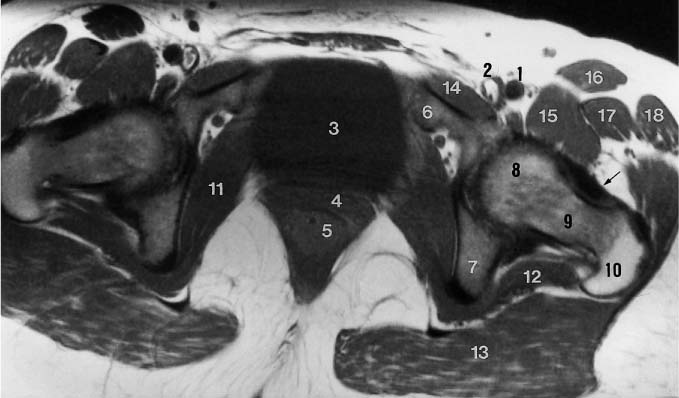
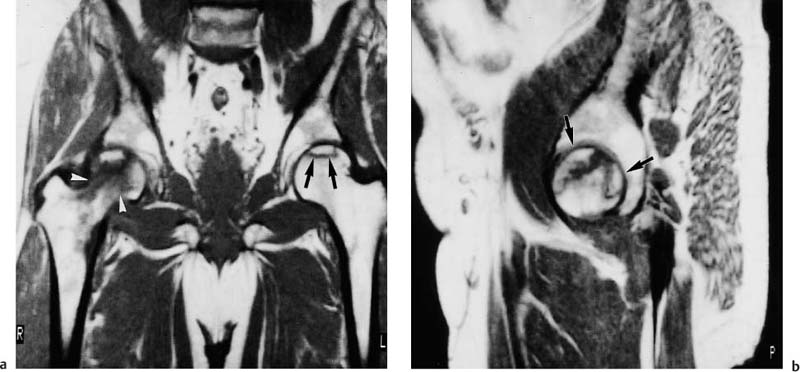
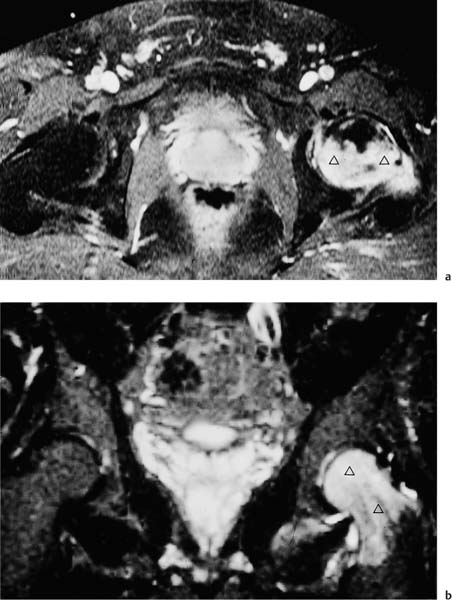
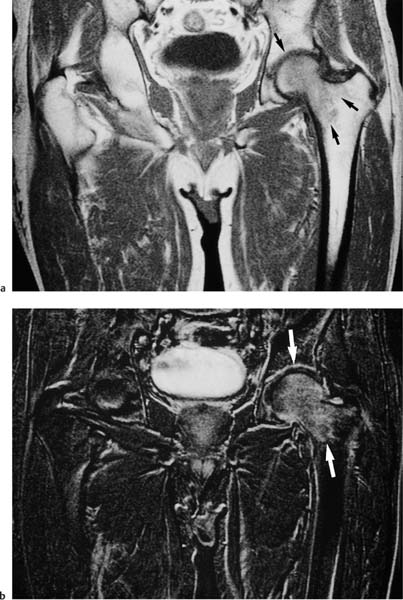
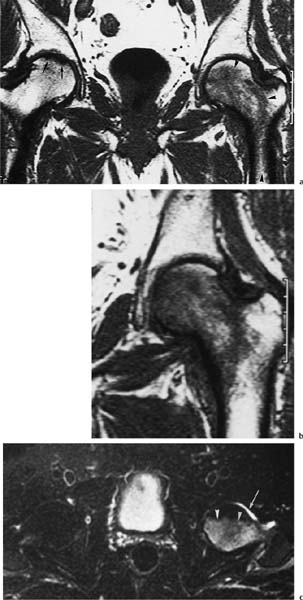
6 Hip and Pelvis Soon after its clinical introduction, MRI was used to examine the pelvis and, especially, the hips. It became apparent that the avascular necrosis of the femoral head could be detected early, before any visible radiographic findings (48). Furthermore, the sensitive visualization of inflammatory changes of the bone marrow, such as those seen with septic arthritis, proved diagnostically useful. The technical advances of MRI, above all the markedly improved spatial resolution and shorter time for examination of the musculoskeletal system, allowed a more refined visualization of even small anatomic structures. New entities, such as bone marrow contusions, were discovered by MRI and different patterns of edema were recognized which advanced the understanding of several diseases. The general availability of MRI today makes it feasible to utilize it early in evaluating cases with radiographic findings that are inconclusive or do not explain the patient’s complaints. The goal of reaching a definitive diagnosis quickly and cost effectively has led to MRI as the initial ‘problem solving’ technique, bypassing conventional tomography, bone scintigraphy and CT. As is true when MRI is applied in other areas, the prerequisite for its appropriate use in disorders of the osseous pelvis and hips is a meticulous examination technique and an understanding of the clinical conditions and their correlation with imaging findings (19). As in other anatomic regions, the examination technique for examining the pelvis is determined by the clinical question. The patient should be positioned with both hips in a neutral position. Analogous to the radiographic examination, both patellae should be anterior, ensuring that the hip is not rotated externally, which would otherwise occur spontaneously since this is the more comfortable position for the patient. To make it easier for the patient to maintain this position, pillows can be placed under the legs. Pelvis and hip are generally examined with the body coil or a suitable phased-array coil. If an especially high spatial resolution is desired, for instance for a detailed visualization of the cartilage, surface coils can be used. The section thickness should be 3 – 5 mm. To select the sections, fast axial T1-weighted sections with a coarser matrix are recommended. For most clinical questions, T1-weighted and T2- weighted SE sequences are appropriate (35, 36). For inflammations, tumors and bone marrow edema, STIR sequences or T2-weighted sequences with spectral fat suppression can improve sensitivity and image contrast. GRE sequences are advantageous for a detailed visualization of the articular cartilage (47). In general, the combination of axial, coronal and sagittal sections achieves an adequate visualization of the anatomic structures. For particular questions, it might be worthwhile to orient the sections parallel or perpendicular to the axis of the femoral neck or sacrum (Fig. 6.1). For a differentiated and detailed delineation of the articular cartilage of the acetabulum and femoral head, Rosenberg and co-workers (47) recommend T1- weighted 3D GRE pulse sequences (TR = 26 – 35 ms, TE = 8 – 14, flip angle = 45 degrees, FFE of 0.5 T). Fat saturated sequences, which have been found advantageous for the knee, were not applied by these authors, but it can be assumed that GRE sequences with fat saturation are also suitable for examining the hip. It is noteworthy that no chemical shift artifacts appear along the interface of the fat containing bone marrow and hyaline articular cartilage. When T1-weighted and T2-weighted SE and 3D GRE sequences are compared, the cartilage thickness measured on the frozen anatomic specimen agrees best with the T1-weighted 3D GRE technique. By applying traction with a weight of 15 kg, Rosenberg et al. (47) could visualize the articular cartilage of the acetabulum and femoral head separately. Using T1-weighted 3D GRE sequences, the relative high signal of the hyaline cartilage could be distinguished from the synovial fluid, which extends into the joint space during traction. By contrast, SE and T2-weighted 3 D GRE sequences could not visualize the articular surfaces separately. Fig. 6.1 Schematic drawing of the imaging plane of the hip. A = Coronal plane B = Oblique coronal plane parallel to the axis of femoral neck C = Oblique sagittal plane, perpendicular to B Fig. 6.2 Schematic drawing of the anatomic structures of the hip in the adult. 1 = Fat in the acetabular fossa 2 = Ligament of the femoral head 3 = Fovea of the femoral head 4 = Zona orbicularis 5 = Acetabular labrum 6 = Iliofemoral ligament Nishi and co-workers (44) used contrast-enhanced MRI (IV injection of contrast medium) under continuous leg traction to improve the visualization of the acetabular labrum. Analogous to other joints, the hip shows an increased signal intensity in the synovial fluid after IV injection of Gd-based contrast medium. With motion of the hip, the diffusion of the contrast medium into the synovial fluid increases, rendering a clear distinction between acetabular labrum and surface of the articular cartilage, while this is not possible without traction and contrast enhancement. The pelvis has to transmit the weight of the body to both feet and at the same time allow extensive movements of the hips. The sacroiliac joint and symphysis pubis only permit little movement. The hip bone is formed by the ilium, ischium, and pubis, and encloses the acetabulum. In infants, the acetabulum is united by a Y-shaped cartilage. The hip is a ball-and-socket joint, formed by the articulation of the spherical femoral head with the acetabulum. The hyaline cartilage covering the semi-lunar surface of the acetabulum is shaped like an inverted horseshoe. It contains a non-articulating central depression, the acetabular fossa. Within the acetabular fossa, MRI visualizes fat and the round ligament of the femoral head, which is delineated by lower signal intensity (Figs. 6.2 and 6.5). The femoral head is almost completely coated by hyaline cartilage, sparing only the depression of the acetabular fovea, where the round ligament of the femoral head inserts. Fig. 6.3 Axial T1-weighted SE image at the level of the femoral head. 1 = Obturator internus 2 = Gemellus inferior 3 = Obturator internus tendon 4 = Gluteus maximus 5 = Acetabulum 6 = Femoral head 7 = Iliopsoas 8 = Rectus femoris with tendon 9 = Sartorius 10 = Gluteus medius 11 = Urinary bladder 12 = Vagina 13 = Rectum 14 = Rectus abdominalis Fig. 6.4 Axial T1-weighted SE image at the level of the femoral neck. 1 = Femoral artery 2 = Femoral vein 3 = Urinary bladder 4 = Vagina 5 = Rectum 6 = Pubic bone 7 = Ischial bone 8 = Femoral head 9 = Femoral neck 10 = Greater trochanter 11 = Obturator internus 12 = Gemellus inferior 13 = Gluteus maximus 14 = Pectineus 15 = Iliopsoas 16 = Sartorius 17 = Rectus femoris 18 = Tensor fasciae latae Arrow = Iliofemoral ligament The femoral neck separates the femoral shaft from the pelvis, allowing a wide range of motion of the leg. It is anteriorly angulated in relation to the femoral shaft (antetorsion). The joint capsule arises from the osseous rim of the acetabulum. Anteriorly, it covers the entire femoral neck and attaches along the intertrochanteric line. Posteriorly, it covers two thirds of the femoral neck. The joint capsule is reinforced by various ligaments. The iliofemoral ligament arises from the anterior inferior iliac spine and broadens posteriorly in a fan shape to attach the greater trochanter and along the intertrochanteric line. The pubofemoral ligament arises from the superior pubic ramus, blends laterally and anteriorly with the joint capsule and continues to the inferior aspect of the intertrochanteric line. The ischiofemoral ligament is located dorsally. It arises from the ischial tuberosity, extends nearly horizontally and attaches at the upper aspect of the intertrochanteric line. The sacroiliac joints have restricted movements. The articulating surfaces of the sacral alar and ilium serve to transmit weight. The articular surfaces are covered by hyaline cartilage and bound together by strong ligaments: the anterior, interosseous, and posterior sacroiliac ligaments. Avascular necrosis (AVN) of the femoral head can occur with numerous diseases and after trauma. Ischemia or anoxia of the bone marrow of the femoral head is considered to be the common underlying mechanism. Since large areas of the femoral head are covered by hyaline articular cartilage with no vessels entering the bone marrow through it, the vascular supply of the femoral head is rather fragile, relying almost exclusively on the deep branch of the medial circumflex artery of the femoral head and the artery of the teres ligament of the femoral head. Furthermore, no pressure can be released from the femoral head in the case of an intracapital space-occupying process. This can greatly hinder the venous drainage. Fig. 6.5 Coronal T1-weighted SE image. 1 = Femoral head 2 = Femoral neck 3 = Gluteus minimus 4 = Gluteus medius 5 = Obturator internus 6 = Iliacus 7 = Acetabulum 8 = Acetabular fossa 9 = Acetabular labrum 10 = Obturator externus Non-traumatic avascular necrosis of the femoral head can be caused by vascular obstruction at the arterial, capillary, or venous level. The following diseases or pathologic conditions are frequently associated with avascular necrosis of the femoral head: • Corticosteroid therapy • Cushing’s disease • Collagen vascular disorders • Barotrauma (Caisson disease) • Pancreatitis • Hyperlipidemia • Sickle cell anemia • Diabetes mellitus • Alcohol abuse • Gaucher’s disease • Hyperuremia • Polycythemia vera Not infrequently, neither an adequate trauma nor a pre-disposing condition can be elicited, and these cases are referred to as idiopathic avascular necrosis. Males are affected more often than females with a ratio of 4: 1. Avascular necrosis most often occurs in the third to fifth decade of life. Both hips are involved in 40% of the cases. The contralateral involvement can be synchronous or metachronous. Early detection of avascular necrosis is important. It provides a diagnostically correct explanation of the hip pain and, above all, allows commencement of adequate therapy, which is largely determined by the stage of the disease. It is of great importance to prevent collapse of the femoral head since this invariably progresses to severe degenerative joint changes. Classification. Different classifications have been proposed for staging avascular necrosis of the hip joint. The most commonly used is the classification of Ficat (18) (Tab. 6.1). This classification is based primarily on clinical symptoms and the radiographic changes. In stage 0 and 1, the necrosis is already histologically detectable. The radiographic findings are unremarkable and the patient is asymptomatic (stage 0) but might complain of pain of sudden onset and restricted motion. Especially in this early stage, MRI is of great value since it is frequently already diagnostic at this time. In stage 2 of avascular necrosis, MRI has also proven extremely valuable. The radiographic changes are often non-specific precluding a definitive diagnosis. MRI can invariably diagnose an avascular necrosis at this stage (11). Bone scintigraphy can detect avascular necrosis with greater sensitivity than radiography, but it is less sensitive than MRI. The specificity of bone scintigraphy and its morphologic detail is inferior to MRI (1, 37, 38). CT only plays a secondary role in the diagnosis of avascular necrosis today (15). Several studies show that CT is superior to conventional radiography but less accurate than MRI. Only the subchondral fracture in avascular necrosis is detected better by CT than by MRI. As mentioned above, MRI is especially suited to detect and characterize stages 0 and 1 of avascular necrosis (36, 58). In asymptomatic patients with renal transplants and on corticosteroid therapy, an avascular necrosis could be detected in 6 – 7.6% of the cases (20, 40, 55), confirming the known associated high risk of avascular necrosis. In patients examined for 24 months at various intervals following a renal transplant, 14 of 104 patients were found to have an avascular necrosis, with spontaneous resolution in some. The various cellular components of the bone marrow have a different sensitivity to anoxia and ischemia. Hematopoietic cells become necrotic after 6 – 12 hours and osteoblasts and osteoclasts after 12 to 48 hours. Fat cells die after 2 to 5 days. The MRI signal of the bone marrow depends on its microscopic composition, in particular on the proportion of fat cells (34, 57). Nadel and co-workers (41) conducted investigations in dogs after complete devascularization of the entire femoral head. During the first hours after the total anoxia, no signal changes were detected on SE or STIR sequences. Dynamic imaging with injection of contrast medium (GD-DTPA), however, revealed neither perfusion nor enhancement. The necrotic area predominately involves the cranial aspect of the femoral head, usually the anterosuperior aspect, and usually has a biconcave or planoconcave configuration (Fig. 6.6). The necrosis is separated from the normal bone marrow by a low signal line. The central areas of necrosis can exhibit different signal patterns, which have been classified by Mitchell and co-workers (39) in four different stages (Tab. 6.2). The different necrotic patterns have no prognostic relevance, however. The prognosis is determined exclusively by the size of the necrotic area. In addition, a heterogeneous signal pattern not found in the stages listed in Tab. 6.2 can be encountered. In T2-weighted images, the highly specific double line sign can be detected in about 80% of the cases (39, 54). A high signal line along the necrotic side and an adjacent low signal line along the healthy bone marrow characterize this sign (Fig. 6.6). This double line sign reflects the hypervascular peripheral region of the necrotic area surrounded by fibrosed and sclerotic zone. The hypervascular peripheral zone of the avascular necrosis can show marked enhancement following the administration of gadolinium-based contrast medium. Unless prosthetic joint replacement is considered regardless of the outcome of the imaging study, MRI is excellently suited for planning any surgical interventions. Sagittal and coronal images can determine exactly the location and extent of the necrosis (Fig. 6.7). Beltran and co-workers (2) and Lafforgue and co-workers (31) found that core decompression of the femoral head is especially promising if the necrosis involves less than 25% of the femoral head. Fig. 6.6a, b Avascular necrosis of the left hip. a Sagittal, T1- weighted SE image. b Coronal T2-weighted image. On the T1-weighted image, the necrotic zone has the same signal intensity as the normal bone marrow. In the anterosuperior segment, the necrotic zone is demarcated by a line of low signal intensity (arrowhead). On the T2-weighted image, the typical double line sign (arrow), considered pathognomonic for avascular necrosis of the femoral head, is seen. • Suspected AVN in cases of negative or inconclusive radiographic findings • Exclusion or detection of contralateral involvement in cases of unilaterally established AVN • Determining the location and extent of the necrotic zone • Inconclusive differential diagnosis of a hip disorder Fig. 6.7a, b Avascular necrosis of both femoral heads. a Coronal T1-weighted SE image. b Sagittal T1-weighted SE image of the right hip. An extensive necrosis with definitely altered signal intensity (arrowhead) is present on the right, with extension to the remaining femoral head and the femoral neck as well as to the intertrochanteric region. On the left, only a small necrotic area is seen in the cranial segment of the femoral head demarcated by a band of low signal intensity (arrow). The sagittal image of the right hip shows involvement of an extensive area of the femoral head, with two demarcated necrotic zones anterosuperiorly and dorsally (arrows). Transient osteoporosis is a relatively rare condition that is not entirely understood etiologically. In general, young and middle aged adults are affected, frequently following an infection or trauma. The conventional radiograph reveals demineralization of the femoral head and neck. The bone scan reveals increased uptake. Histologically, increased bone turnover as well as inflammatory changes are seen in transient osteoporosis. Signs of a low grade chronic inflammation can be found in the synovial membrane. In general, clinical symptoms and radiologic findings resolve spontaneously within 6 – 12 months. Distinguishing transient osteoporosis from other disorders, in particular from bacterial and tuberculous arthritis as well as from inflammatory rheumatoid arthritis, is of great importance, since therapeutic measures are rather different. Transient osteoporosis displays a characteristic pattern of involvement on MRI. Diffuse signal changes are found in the femoral head and neck, possibly extending into the femoral neck (Fig. 6.8). The T1-weighted image shows a definite decrease in signal intensity of the bone marrow, while the T2-weighted SE images and particularly the STIR images show a definite increase in signal intensity (Figs. 6.9 and 6.10). The Turbo (Fast) SE sequences show less contrast relative to the normal bone marrow in comparison with conventional SE sequences. The signal changes of transient osteoporosis are attributed to bone marrow edema (60). Serial examinations have shown resolution of edematous pattern within 6 – 10 months (3). Several authors have discussed the etiologic relationship between transient osteoporosis and femoral head avascular necrosis (23, 42, 43, 59). An MRI controlled study of treatment by core decompression found changes suggesting an early avascular necrosis of the femoral head when bone marrow edema was found in femoral head and neck (25). From these findings it has been concluded that bone marrow edema is a reversible intermediate stage in the development of femoral head avascular necrosis and that the different repair mechanisms determine whether the process heals by resolution of the bone marrow edema or progresses to avascular necrosis of the femoral head (Fig. 6.11). Kramer and co-workers (30) report nine patients who had severe therapy-resistant pain in one or both hips in the last trimester of pregnancy. Of 11 diseased hips, bone marrow edema was found in eight and avascular necrosis of the femoral head in three. The core decompression performed in patients with bone marrow edema resulted in rapid pain relief and resolution of the signal alterations on MRI. Conservative therapy had a definitely protracted course of healing, lasting 4 to 6 months. All cases with bone marrow edema were found to have increased intramedullary pressure. Fig. 6.8a, b a Axial and b coronal STIR image. Transient osteoporosis of the left hip. Bone marrow edema (triangles) with high signal intensity in the femoral head, femoral neck, and portions of the intertrochanteric region. Fig. 6.9a, b Transient osteoporosis of the left hip. a Coronal T1-weighted SE sequence. b Coronal STIR image. Femoral head and neck show large ill-defined areas of decreased signal intensity (arrows) on the T2- weighted image and of increased signal intensity on the STIR image. Fig. 6.10 a–c Transient osteoporosis of the left femur and avascular necrosis of the right femoral head. a Coronal T1- weighted SE image. The subchondral region of the right hip exhibits a smoothly outlined decrease in signal intensity (arrows), corresponding to early avascular necrosis. The left proximal femur shows an extensive and indistinctly outlined decrease in signal intensity within the bone marrow (arrow-head). b Coronal T1-weighted SE image of the left hip. Clearly visualized decreased signal intensity in the femoral head, femoral neck and intertrochanteric region. c Axial T2
Introduction
Examination Technique
Anatomy (Figs. 6. 2–6. 5)
Avascular Necrosis of the Femoral Head
 Indication of MRI in Femoral Head Avascular Necrosis
Transient Osteoporosis
![]()
Stay updated, free articles. Join our Telegram channel


Full access? Get Clinical Tree


