Fig. 3.1
The layered structure of the coronary wall imaged by optical coherence tomography (OCT). This OCT image demonstrates visualization of the intima, media and adventitia. The bright-dark-bright, three-layered appearance is seen in the OCT image with the corresponding anatomy as defined. Histological image is partial enlarged view of the dashed rectangle in OCT image (bottom). (Histologic staining Elastica van Gieson stain)
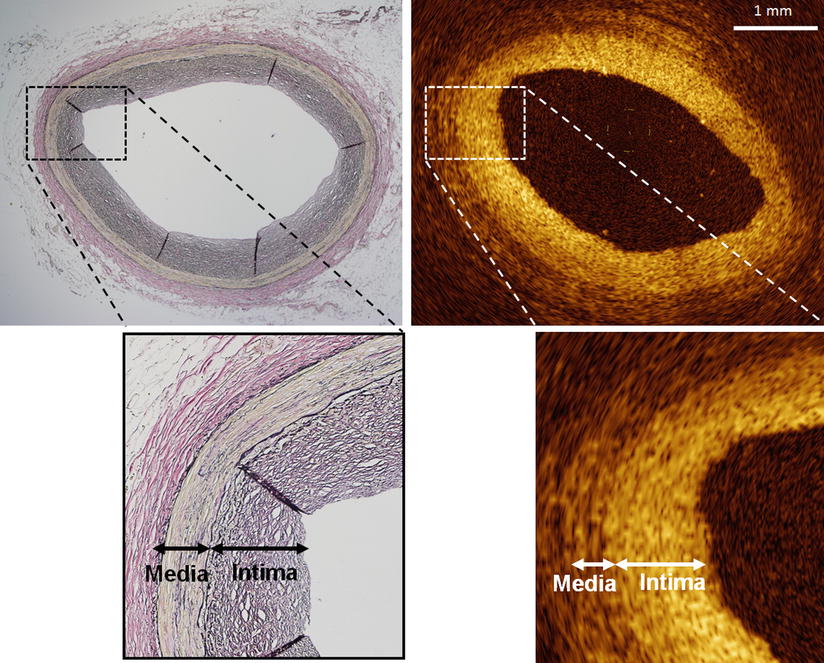
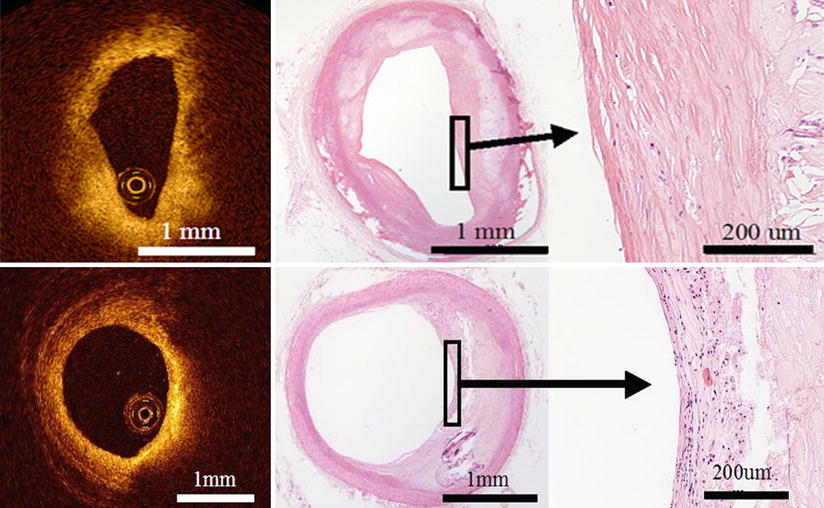
Fig. 3.2
Intimal thickening visualized by optical coherence tomography. Most adults undergoing cardiac catheterization have intimal thickening, represented as a signal-rich thick intimal band in the OCT image, even in angiographically normal segments. Partial enlarged view of the dashed rectangle in top images (bottom). (Histologic staining Elastica van Gieson stain)
3.3 Atherosclerotic Plaque
An atherosclerotic plaque is characterized as a mass lesion or a loss of the three-layered structure of the blood vessel. OCT can provide detailed information about plaque composition. Fibrous plaques exhibit homogeneous, signal-rich (highly backscattering) regions (Fig. 3.3); lipid-rich plaques exhibit signal-poor regions (lipid pools) with poorly defined borders and overlying signal-rich bands (corresponding to fibrous caps) (Fig. 3.4); and fibrocalcific plaques exhibit signal-poor regions with sharply delineated upper and/or lower borders (Fig. 3.5). OCT has the advantage of being able to image through calcium without shadowing, as would otherwise occur with IVUS. Plaque characteristics of OCT are listed in Table 3.1. The diagnostic accuracy of OCT for the above plaque characterization criteria was confirmed by an ex vivo study of 307 human atherosclerotic specimens, including those from the aorta, carotid arteries, and coronary arteries [5]. Independent evaluations by two OCT analysts demonstrated a sensitivity and specificity of 71–79 and 97–98 %, respectively, for fibrous plaques; 90–94 and 90–92 %, respectively, for lipid-rich plaques; and 95–96 and 97 %, respectively for fibrocalcific plaques, (overall agreement versus histopathology, κ values of 0.88–0.84). The interobserver and intraobserver reproducibility of OCT assessment was also high (κ values of 0.88 and 0.91, respectively).
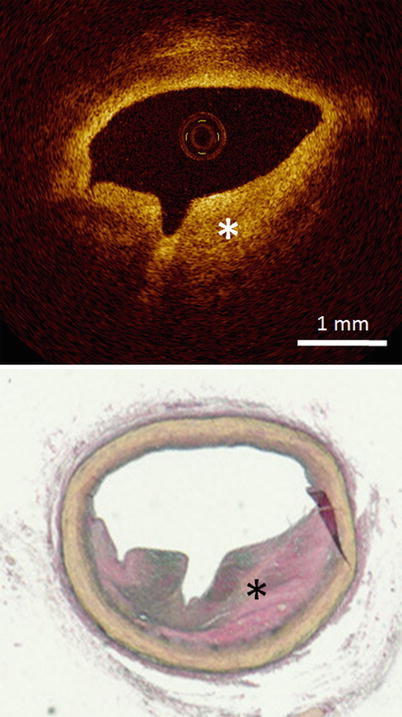
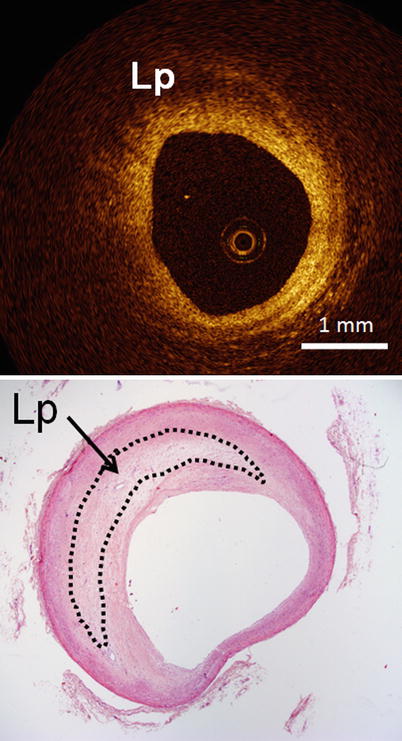
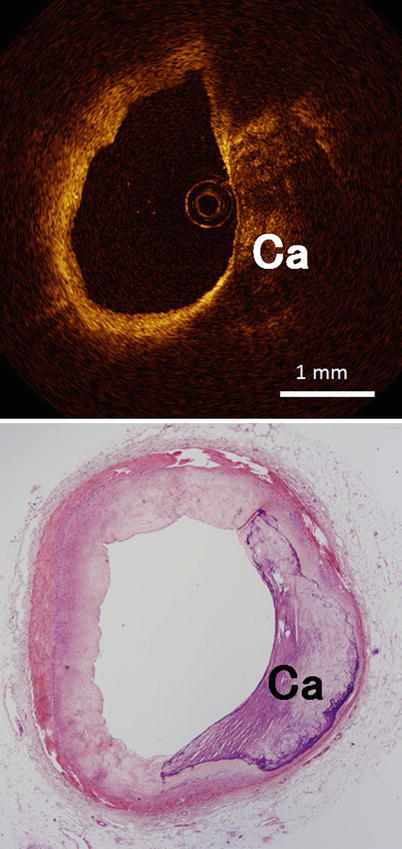
Fig. 3.3
Optical coherence tomography images (top) and corresponding histology (bottom) for fibrous plaque. In fibrous plaques, the OCT signal is strong and homogeneous (asterisk). (Histologic staining Elastica van Gieson stain)
Fig. 3.4
Optical coherence tomography images (top) and corresponding histology (bottom) for lipid-rich plaque. Lipid-rich (Lp) regions appear as a signal-poor region within the vessel wall, and lipid-rich plaques have diffuse or poorly demarcated borders (Histologic staining: hematoxylin and eosin stain)
Fig. 3.5
Optical coherence tomography images (top) and corresponding histology (bottom) for fibrocalcific plaque. Calcific (Ca) regions appear as a signal-poor region within the vessel wall, and fibrocalcific plaques have sharply delineated borders (Histologic staining: hematoxylin and eosin stain)
Table 3.1
Plaque characteristics in optical coherence tomography (OCT)
Tissue type | OCT |
|---|---|
Fibrous | Homogeneous |
Signal-rich (highly backscattering) | |
Fibrocalcific | Sharply delineated borders |
Signal-poor | |
Lipid-rich | Poorly defined borders |
Signal-poor |
However, the limited depth of penetration of OCT could pose a problem for the imaging of deep vascular structures. A previous report showed that OCT assessments of lipid-rich lesion with thin fibrous cap (thickness of the fibrous cap <200 um) were achieved with 92 % sensitivity and 75 % specificity, while overall OCT assessments of lipid-rich lesion were achieved with 77 % sensitivity and 75 % specificity [6]. These data suggest that the superficial penetration of OCT may limit the assessment of entire plaque morphology.
3.4 Calcification
Calcification is frequently observed in more advanced atherosclerotic disease and is therefore thought to be a marker of coronary heart disease. IVUS can only visualize the surface of the calcium due to acoustic shadowing. On the other hand, OCT can identify calcification tissue without shadowing (Fig. 3.6). There is better correlation in areas of calcification between OCT and histological examination when comparing between IVUS and the histological examination (r = 084, p < 0.001 vs. r = 0.78, p < 0.001) [7]. These data suggest that superficial calcification can be quantified more accurately using OCT than with IVUS.
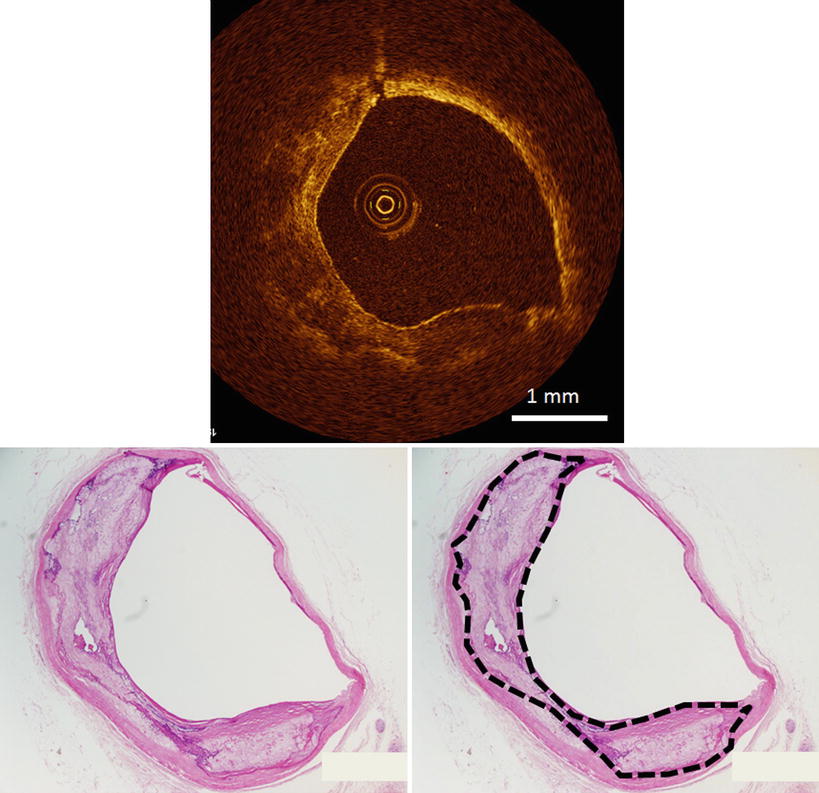
Fig. 3.6
Optical coherence tomography images (top) and corresponding histology (bottom) for heavily calcified plaque. OCT can identify the calcification tissue without shadowing. Dashed lines indicate calcification tissue (bottom right). (Histologic staining: hematoxylin and eosin stain)
3.5 Fibroatheroma
A fibroatheroma is characterized as necrotic core with an overlying fibrous cap. A fibrous cap is a fibrous tissue layer, which is often a signal-rich band, overlying a signal-poor region indicating the necrotic core (Fig. 3.7). In the OCT image, the necrotic core was characterized as signal-poor regions with poorly defined borders, which is similar to that of a lipid pool. Histologically, a lipid pool is converted to a necrotic core from macrophage infiltration and apoptosis forming the early necrotic core. In a previous histologic study using OCT, there was no attempt to differentiate a necrotic core from a lipid pool, and these structures have different clinical relevance. The ability of OCT to characterize a lipid pool containing necrotic core needs to be clarified in future histologic studies.
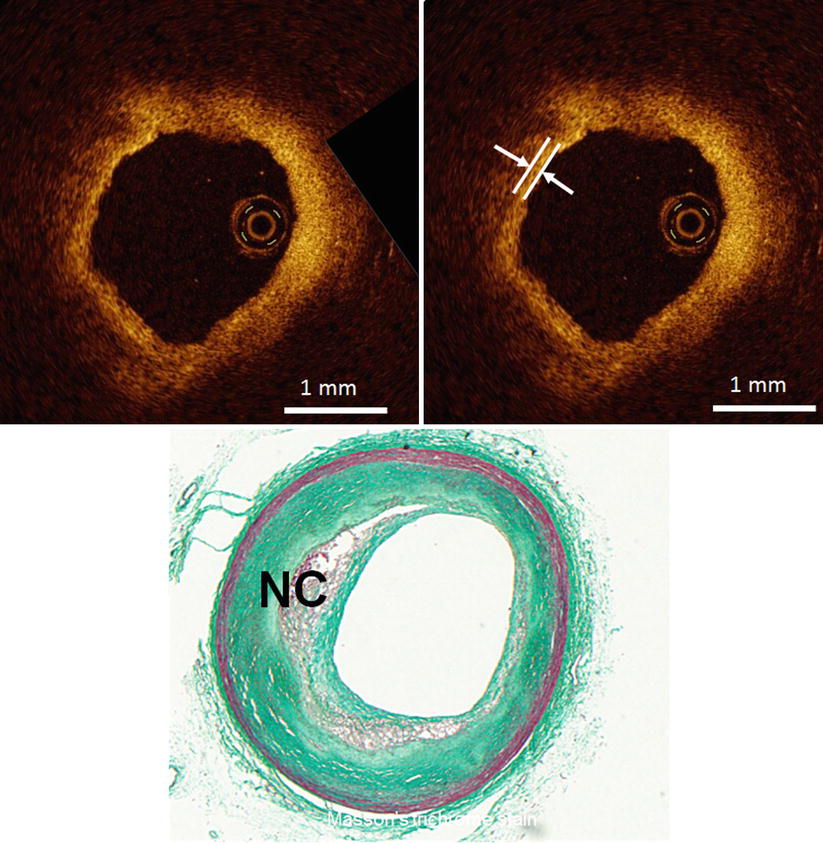
Fig. 3.7
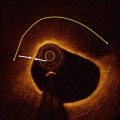
Optical coherence tomography images (top) and corresponding histology (bottom) for fibroatheroma. A fibrous cap (arrow) is a fibrous tissue layer, which is depicted as a signal-rich band overlying a signal-poor region indicating necrotic core (NC). (Histologic staining: Masson trichrome stain)
3.6 Vulnerable Plaque
Studies have also assessed the ability of OCT to detect vulnerable plaque.
Myocardial infarction, sudden cardiac death and unstable angina arise from coronary thrombosis, which develops as a result of ruptured vulnerable plaque. Autopsy studies have identified several histological characteristics of plaques that correlate with the risk of rupture and subsequent acute coronary events. These characteristics include: (1) a thin fibrous cap (<65 μm), (2) activated macrophages near the fibrous cap, (3) a large lipid pool, and (4) neoangiogenesis [8, 9].
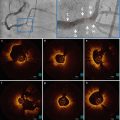
A thin fibrous cap of vulnerable plaque, commonly named thin-cap fibroatheroma (TCFA), has fibrous cap thickness <65 μm. TCFA is the primary plaque type at the site of plaque rupture but exists both in culprit lesions and non-culprit lesions and is distributed in all three coronary arteries. TCFAs are more commonly observed in patients with acute coronary syndrome than in patients with stable angina. Histologic data show that TCFAs tend to cluster in predictable spots within the proximal segment of the left anterior descending artery but also develop relatively evenly in the left circumflex and right coronary artery [10, 11]. A thin (<65 μm) fibrous cap of vulnerable plaque is technically below the image resolution of IVUS (~150 μm). On the other hand, the resolution of OCT is between 10 and 50 μm, which is significantly greater than any currently available imaging technology. Therefore, OCT could visualize thin fibrous cap (Fig. 3.8) and measure the thickness of the fibrous cap in the lipid-rich plaque (r = 090, p < 0.001) [12]. Fujii et al. performed a three-vessel OCT examination in patients with ischemic heart disease in the clinical settings and showed that TCFAs tend to cluster in predictable spots within the proximal segment of the left anterior descending artery yet develop relatively evenly in the left circumflex and right coronary artery [13]. These data are similar to those from prior histologic studies.
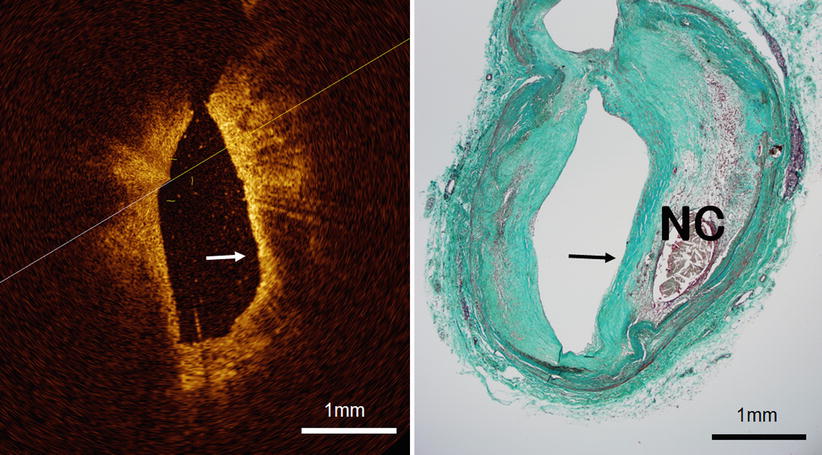
Fig. 3.8
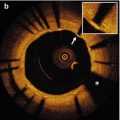
Optical coherence tomography images (left) and corresponding histology (right) for thin-cap fibroatheroma (TCFA, arrowhead). OCT can measure the thickness of the fibrous cap and detect TCFA. TCFA has a fibrous cap thickness <65 μm and is the primary plaque type at the site of plaque rupture. It exists in both culprit lesions and non-culprit lesions. (Histologic staining: Masson trichrome stain)
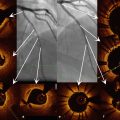
Infiltration of macrophages within the fibrous cap is another characteristic of vulnerable plaque. A previous report showed that OCT enables the quantification of macrophages within fibrous caps [14]. OCT with a simple image-processing algorithm for macrophage evaluation yielded results that correlated well with histological measurements of fibrous cap macrophage density (r = 0.84, p < 0.0001). A range of OCT signal standard deviation thresholds (6.15–6.35 %) yielded 100 % sensitivity and specificity for identifying caps containing >10 % CD68 staining. In OCT images, macrophage accumulation is seen as signal-rich, confluent punctuate regions that exceed the intensity of background speckle noise (Fig. 3.9). OCT may provide researchers and clinicians with a valuable tool for the assessment of vulnerable plaque, including the visualization of the thin fibrous cap.