Chapter 1 Historical Perspective on Three-Dimensional Echocardiography
Earliest Approaches
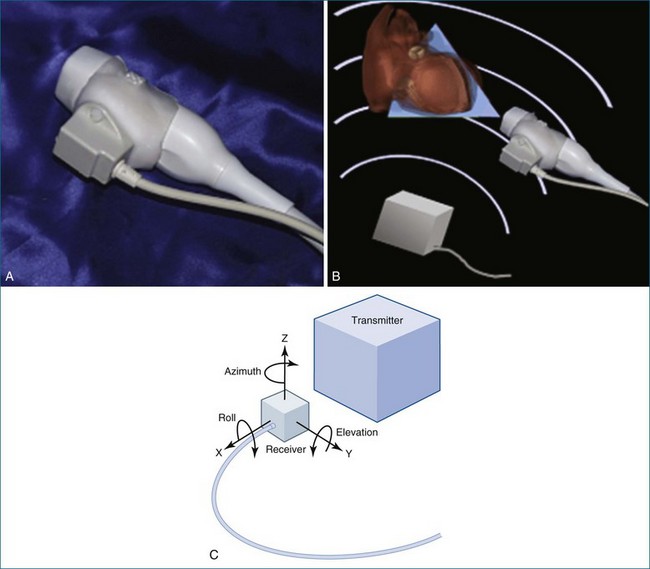
3DE had its beginnings in the 1970s with primitive equipment and equally primitive images. By the mid-1980s, there was early 3DE performed with standard B-mode ultrasound and tracking devices designed to locate the transducer in space. The initial approach to 3D echo was to obtain multiple 2D images and reconstruct them into a 3D image. This was accomplished by registering the 2D images such that it could be discerned how the individual images fit together to form the 3D image. Such registration of the images was achieved by tracking the transducer in space via mechanical, acoustic, electromagnetic, or optical detection apparatus. In the mechanical approach, the transducer had an actual mechanical arm attached to it and therefore dictated movement in space (Figure 1-1). Dekker and colleagues1 are credited with this first iteration of 3DE using the mechanical arm approach in 1974. Next came an acoustic attempt at location, the “spark gap” technique by Moritz and Shreve2 in 1976. In this technique, the transducer was located by sending pulsed acoustic signals from a device holding the transducer, called a spark gap to a Cartesian locator grid (Figure 1-2). This approach, in theory, allowed free-hand scanning—meaning that the transducer did not have to follow a predetermined pathway and, indeed, was the precursor to free-hand scanning using an electromagnetic locator. Both electrocardiography and respiratory gating were often used, or images were acquired with breath holding. Initially, only end-diastolic and end-systolic images of the left ventricle (LV) were obtained. Over time, complete cardiac cycles could be obtained.3,4 Several groups published articles during this period using a variety of primitive transducer tracking systems and the resultant less than pleasing 3D imaging.5–10
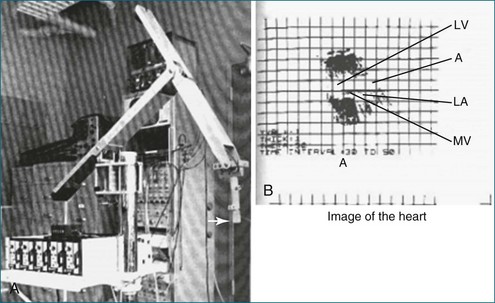
Figure 1-1 A, The mechanical arm used by Dekker and colleagues1 for tracking the ultrasound transducer in space. Note the arrow depicting the actual ultrasound transducer. As might be imagined, this apparatus was not well received by sonographers because moving the transducer around was physically taxing, given the weight and awkwardness of the mechanical arm. B, Image of the heart. Note that the image shows only mild resemblance to the actual heart and heart chambers. A, aorta; LA, left atrium; LV, left ventricle; MV, mitral valve.
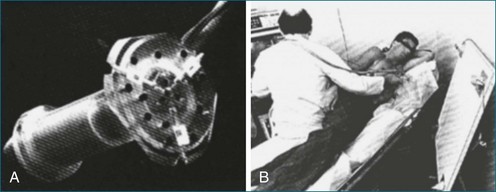
Figure 1-2 An acoustic “spark gap” apparatus used by Moritz and Shreve2 for locating the transducer for three-dimensional echocardiography. A, Actual device housing the transducer, with the audio signal sent from the trifurcating mechanism. B, The device in practice, with the coordinates shown on the board to the right of the user.
In 1977, Raab and colleagues11 developed the magnetic locator, which ultimately led to the most advanced type of free-hand scanning, but this method for transducer location never caught on until the mid-1990s. This method is still used today by some labs, predominantly for research purposes (Figure 1-3; see also Figures 1-13, 1-14).
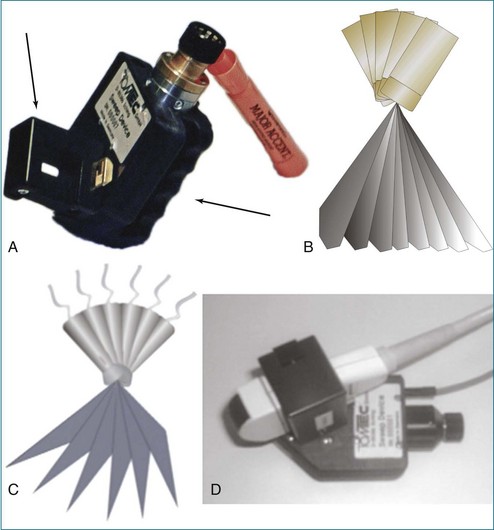
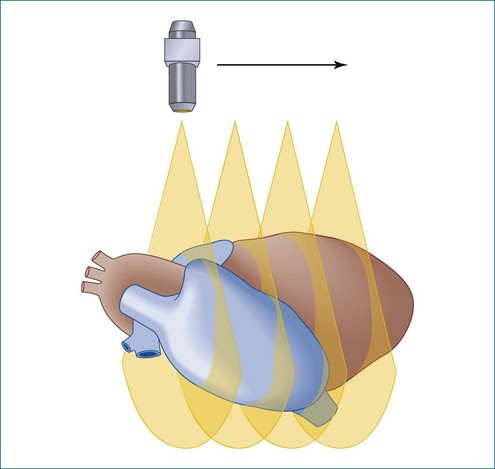
In between the spark gap and the free-hand magnetic approaches were myriad tactics that used the technique of transducer movement in a preprogrammed, stepwise fashion while attempting to keep the patient and the sonographer as stationary as possible. The mechanical devices then moved the transducer in a linear, fanlike, or rotational direction. An example of a fanlike acquisition is shown in Figure 1-4.
Fanlike Scanning
Fanlike scanning was, in theory, advantageous for evaluating the right ventricle (RV) compared with rotational or linear scanning, since the RV is not easily accessed from the apex and often is best imaged from the RV inflow tract using a more rightward direction of scanning from the standard parasternal view.12
Rotational Scanning
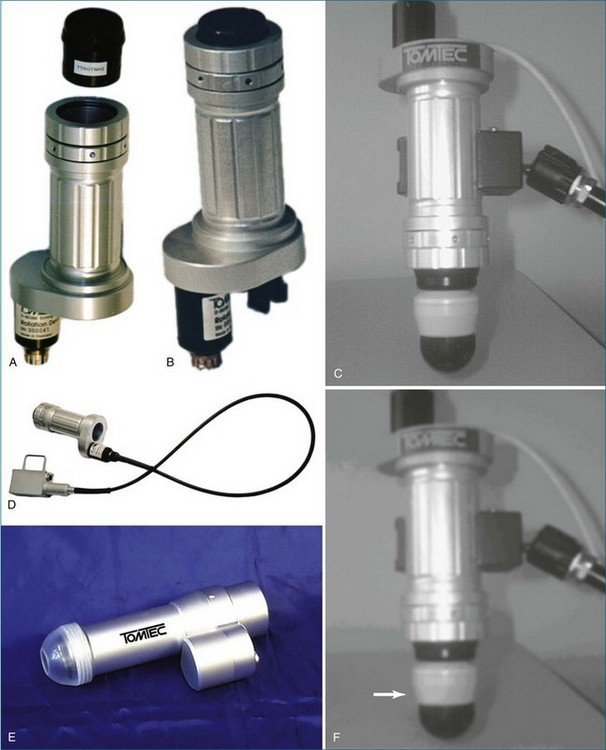
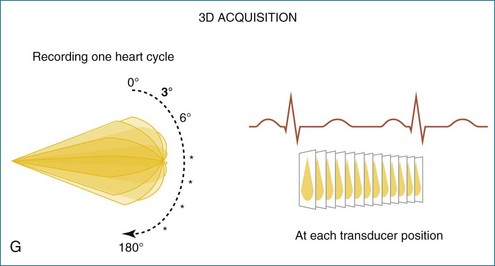
The rotational approach used a cylinder-like mechanical apparatus that those in the industry at that time referred to as the “bazooka” (Figure 1-5). This device had a mechanical stepper motor that moved the transducer sequentially through a semicircular or 180-degree scan with stops every two to three degrees to acquire a 2D image. The acquisition of roughly 60 images was followed by computer software processing, initially using a polar coordinate approach to meld the images into a 3D image. The computer software used significant interpolation between images. The result was frequent “stitch” artifact caused by deficiencies in image line-up from patient movement, transducer movement outside the prespecified position, respiratory or cardiac gating artifact, or all of these factors. Although innovative and potentially very powerful for this era, clear limitations remained. Hence, clinical applicability was very limited.13
Linear or Parallel Scanning
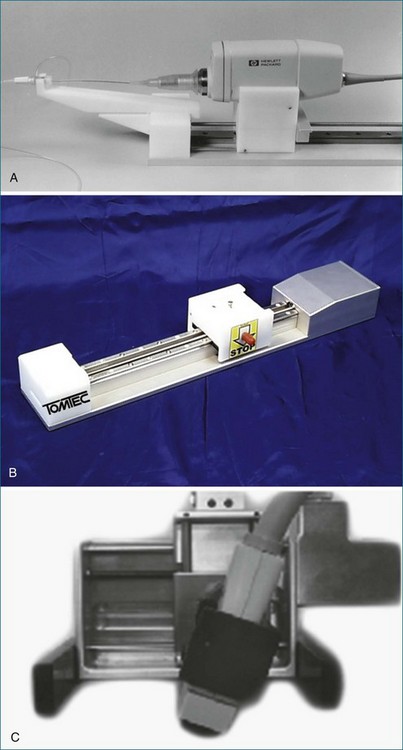
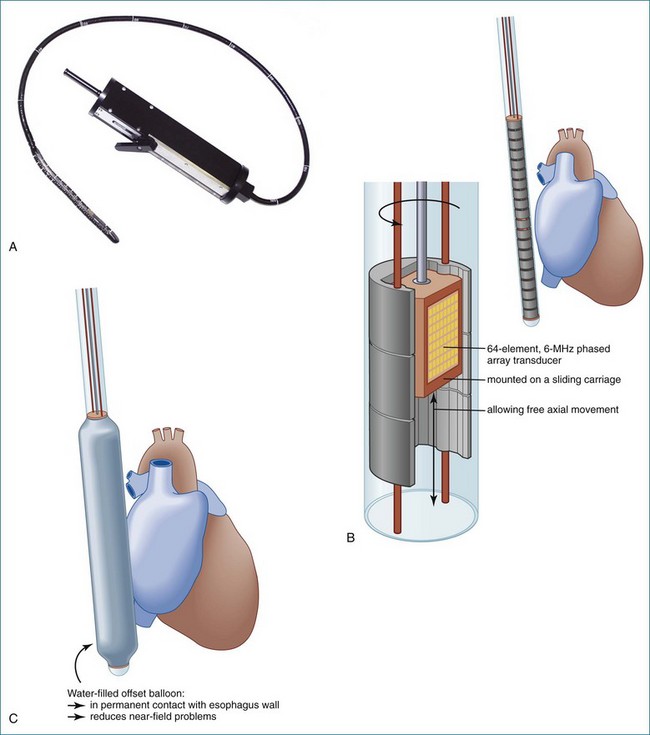
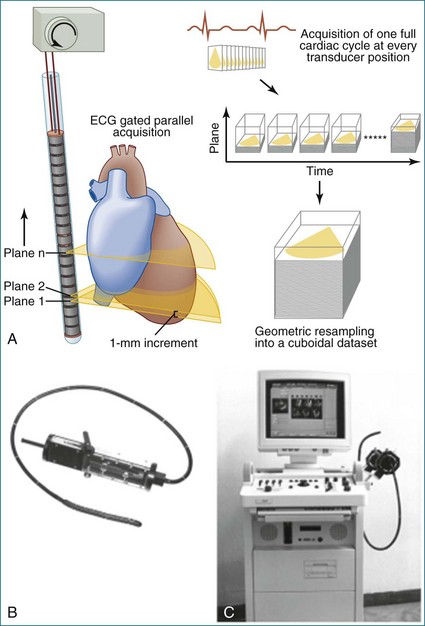
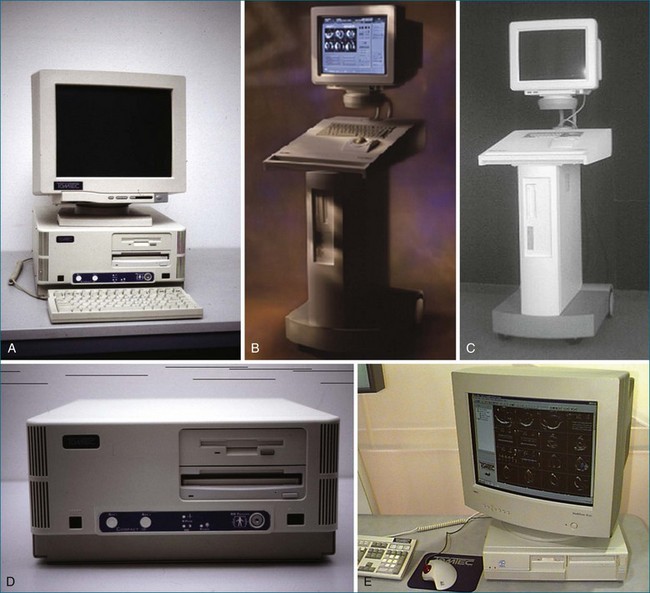
In linear scanning, the transducer was sequentially stepped along a line and obtained images every few millimeters, as opposed to degrees with the rotational and fanlike scans (Figures 1-6 to 1-9). Examples of linear scanning using an intravascular ultrasound, predominantly for coronary imaging, as well as a transthoracic echocardiography (TTE) device are shown in the figures. A device, known as “lobster tail,” for linear pullback using transesophageal echocardiography (TEE) was available as well. In similar fashion as the previously described linear devices, the lobster tail operated by stepwise pullback of the TEE probe in the esophagus, with imaging at each stop. This TEE probe, developed by TomTec, Inc. (Munich, Germany), included both the TEE probe and the “stepper,” that is, the device that moved the probe sequentially (see Figures 1-8 and 1-9). There were several iterations of this technique, including one that involved placing the TEE probe in a water bath within the esophagus to serve as a “standoff” to improve acoustic effects and sharpen the images (see Figure 1-8). The rotational method of scanning with the lobster tail is summarized in Figure 1-9. Further summaries regarding the various types of scanning, early fetal ultrasound, and early computer hardware are shown in Figures 1-10 to 1-12.
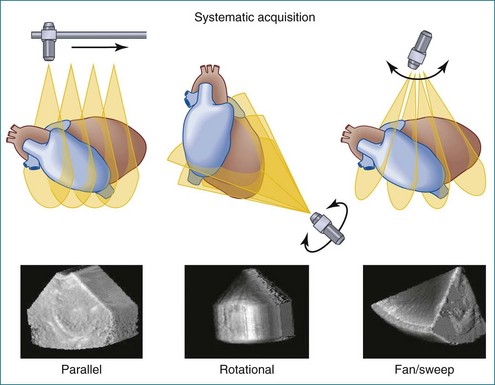
Figure 1-10 Summary of linear (parallel), rotational, and fanlike scanning.
(Courtesy TomTec, Inc., Munich, Germany.)
Stay updated, free articles. Join our Telegram channel

Full access? Get Clinical Tree


