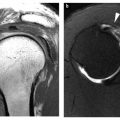
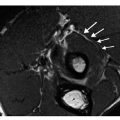
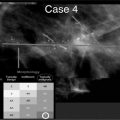
Fig. 1
Multi-echo T2 images at the level of the osteochondral junction (patellar specimen). Post-processing of the following images allows generation of corresponding T2 maps (for color reproduction see p 304)
Delayed Gadolinium-Enhanced MR Imaging of Cartilage
Delayed gadolinium-enhanced MR imaging of cartilage (dGEMRIC) technique is based upon the fact that ions distribute in cartilage following the concentration of the negatively charged GAG molecules [22]. Negatively charged Gd-DTPA2- anionic molecules will be repulsed by preserved cartilage. Conversely, if Gd-DTPA2- is present in the hyaline cartilage, concentration can be assumed to be in regions where glycosaminoglycan is relatively depleted. Therefore the T1 values of hyaline cartilage assessed after Gd-DTPA2- intravenous administration will quantitatively reflect GAG concentration. For a typical dGEMRIC protocol, a double or triple dose of Gd-DTPA2- is usually administered intravenously and joint range of motion is performed for 10 min. T1-weighted images are acquired after 30 min to 3 h (usually at least a 90 min delay is preferred) and color maps can be generated based on per-pixel calculation. Different parameters have been proposed to acquire the data based on T1-weighting such as STIR imaging, saturation recovery, fast mapping, Look-Locker and driven equilibrium single pulse observation (DESPOT). T1 maps are then generated using specific curve-fitting software and values are defined as a dGEMRIC index. Notably, due to variations in intra-articular distribution of gadolinium in vivo, an equilibrium state is never reached. Therefore GAG concentration as measured with dGEMRIC must be considered an estimate. Areas with a low dGEMRIC index (low T1 values) reflect high gadolinium concentration and low GAG concentration (abnormal cartilage). Conversely, areas with a high dGEMRIC index (high T1 values) demonstrate low gadolinium distribution and normal GAG concentration (preserved cartilage). dGEMRIC can be implemented on clinical highfield- strength MRI systems, but requires upgrading to specific software packages in order to post-process the T1 acquired data. The dGEMRIC index has a low inter- and intraobserver variability and presently is one of the most specific noninvasive techniques to evaluate hyaline cartilage GAG concentration [9, 10].
T1ρ (T1-Rho)
T1ρ is defined as the spin-lattice relaxation time in the rotating frame and is measured using a spin-lock. It reflects the interaction between motion-restricted water molecules and the macromolecular environment. Therefore it can describe changes in the extracellular matrix of cartilage (macromolecular environment), which includes alterations to proteoglycans. T1ρ measurements appear less sensitive in the identification of collagen changes than proteoglycans. Although T1ρ mechanisms are still not fully understood, variations in measurements have been observed depending on cartilage depth, corresponding to known GAG concentration gradients. T1ρ measurements show promising results in the assessment of damaged cartilage (high T1ρ values) and in early stage osteoarthrosis when compared with T2 imaging [9, 10, 23, 24]. T1ρ of cartilage involves a specific pulse sequence with multiple acquisitions at varying spin-lock times (Fig. 2). Presently the technique is typically performed in the research setting and is still under extensive investigation.
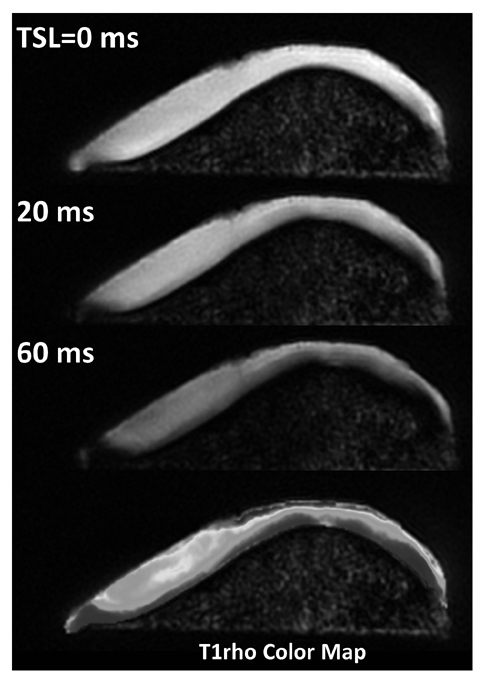

Fig. 2
Patellar T1ρ (T1-Rho) images acquired using different spin lock times (TSL) and corresponding T1ρ map (for color reproduction see p 304)
Na+ Imaging
The rationale for Na+ imaging of cartilage relies in the previously described concept that GAGs carry negative charges from their sulfate and carboxyl groups. In accordance to Donnan equilibrium theory and electroneutrality principles, the negative charges are counterbalanced by positive charges in cartilage extracellular matrix. Sodium (Na+), a positive ion, is present in cartilage and can be measured by means of MR due to its nuclear spin momentum, which is characterized by a measurable specific resonance frequency (ω=11.262 MHz/T). Therefore healthy cartilage, rich in GAGs, presents a normal amount of Na+, while damaged areas (poor in GAGs) demonstrate a decreased amount of Na+. Na+ imaging is technically challenging and requires an MR system with multinuclear capabilities and dedicated sodium coils (Figs. 3, 4). High field strength is required for sufficient SNR since in vivo Na+ NMR signal is ∼22,000 times smaller than that of hydrogen. Additionally, Na+ has very fast biexponential transverse relaxation decay, necessitating the use of ultrashort TE sequences and is therefore still used as a research tool [9, 10, 25].
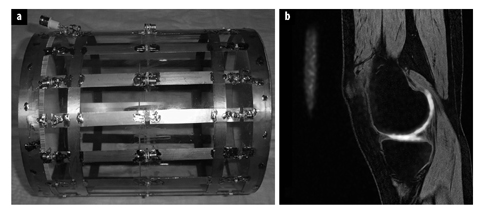
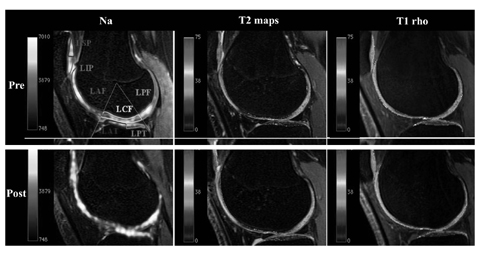

Fig. 3 a, b.
a Dedicated dual tuned 23 Na+/1H magnetic resonance imaging (MRI) coil. b 3T Na+ MRI sagittal image of the knee, directly measuring cartilage glycosaminoglycan content. (Courtesy of Professor Garry Gold, Stanford University USA) (for color reproduction see p 304)

Fig. 4 a, b.
Na+, T2 and T1-rho knee cartilage maps from the Stanford basketball study. Post-season degenerative changes of the patellofemoral joint cartilage are demonstrated, in keeping with higher rates of injury at this level in jumping athletes. (Courtesy of Professor Garry Gold, Stanford University, USA) (for color reproduction see p 305)
Ultra-Short Echo Time
Ultra-short echo time (UTE) imaging has its rationale in the application of specific MRI sequences with ultra-short echo times (on the order of microseconds or less) to evaluate tissues presenting a majority of short T2 components. While these tissues are hypointense on clinical imaging sequences, UTE allows abundant signal detection (Figs. 5, 6). Among these tissues are the calcified layer of cartilage, aponeuroses, menisci, tendon and bone [26]. Alteration of T2 relaxation times in these now visible tissues is associated with pathology, as is the case with conventional MRI of long T2 tissues. With the acquisition of several echoes, UTE T2 maps can be generated [9]. Recent literature has demonstrated the effectiveness of UTE MRI in the evaluation of the osteochondral junction [27]. Additionally, UTE T2 maps of articular cartilage have been used to evaluate matrix degeneration [28]. UTE MRI is presently used as a research tool and demands high performance MR hardware and specific sequence design. In the near future, we expect widespread implementation on high-field-strength clinical scanners, thereby improving their diagnostic potential.
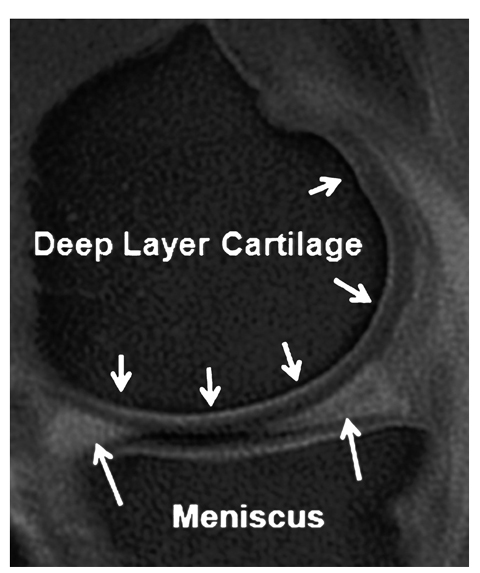
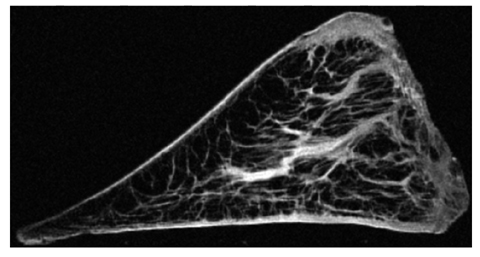

Fig. 5
Ultra-short echo time sagittal image of the knee. High signal is observed within the articular cartilage and meniscus (arrows). Note the elegant depiction of the deep articular cartilage layer (small arrows) along with the osteochondral junction area(for color reproduction see p 305)

Fig. 6
Ultra-short echo time high-resolution image of a knee meniscus (specimen) demonstrates its fine anatomic details
Diffusion Weighted Imaging and Diffusion Tensor Imaging
Diffusion weighted imaging (DWI) is based on the random Brownian motion of water molecules and its dependence on the intra- and extracellular surrounding environment. The macromolecular environment affects the magnitude and direction of the diffusing bulk water. Intact extracellular matrix restricts the motion of bulk water and normal cartilage demonstrates more restriction of diffusion at the deeper layers. DWI is able to provide quantitative information on cartilage structural integrity by means of diffusion rates of water expressed by apparent diffusion coefficient (ADC) values. The ADC values in healthy cartilage are lower in comparison with damaged cartilage, where increased water diffusion and therefore increased ADC values are observed. Although DWI is a technique readily implemented on clinical scanners for long T2 tissues [9], many challenges exist with regards to implementation in short T2 structures such as articular cartilage including poor spatial resolution (large field of view and slice thicknesses) and low SNRs.
Stay updated, free articles. Join our Telegram channel

Full access? Get Clinical Tree


