9 Hypertension and Bruit The vast majority of patients with hypertension have essential hypertension; only a minority has renovascular hypertension (RVH). Despite this fact, the impetus to identify this minority exists because there is a possibility of curing their disease. It is impractical to screen all hypertensive patients; therefore, it is important to identify the subset of patients who are at higher risk for RVH and might benefit from screening. It is equally important to identify the imaging tests that can be applied consistently and safely to this group. Renal artery stenosis (RAS) is the most common cause of RVH. RAS is also associated with renal insufficiency.1–4 Interest in applying diagnostic tests and therapeutic interventions to this risk group is growing.5 It is clear that renal artery stenosis is associated with excess morbidity and mortality. Those with renal artery stenosis are at high risk for cardiovascular death; it is less established that renal interventions provide long-term benefit.6 Goldblatt and coworkers7 were the first to prove that a renal lesion could cause hypertension by showing that renal artery constriction in a dog was followed by hypertension and renal atrophy. In the years that followed, understanding of the renin–angiotensin system has led to an understanding of RVH. Although RAS produces RVH, the two entities are not equivalent. RAS may not produce hypertension or it may coexist with essential hypertension. Processes other than RAS, such as Page kidney or dissecting aneurysm of the renal artery may also produce RVH. Other etiologies of secondary hypertension include renal disease, hyperaldosteronism, pheochromocytoma, Cushing’s syndrome, sleep apnea syndrome, and coarctation of the aorta. Renal aneurysms may be associated with hypertension.8 The diagnosis of RVH is established retrospectively after the patient undergoes treatment: those whose hypertension responds to revascularization of RAS have RVH. The absence of a response to revascularization may be due to a variety of factors: technical failure of the intervention, incidental RAS in a patient with essential hypertension, or irreversible renal disease superimposed on RAS or RVH. There may be no way to distinguish these groups, so it may not be possible to find a gold standard that establishes the presence or absence of RVH. Most tests used to evaluate the hypertensive patient are anatomical—they detect RAS. A physiological test for RVH is one that bases its diagnosis on the determination of whether the renal blood flow is abnormal. Physiological tests are theoretically more likely to predict the response to therapy, and therefore, RVH. The prevalence of RVH is quite variable, but only represents around 0.5 to 5% of the hypertensive population.9,10 Suggestive clinical clues may raise the likelihood of RVH to 5 to 15%.9 Certain groups will have even greater incidence of RVH. For example, 31% of patients with accelerated hypertension may have RVH.9 The Cooperative Study of Renovascular Hypertension evaluated clinical features that might distinguish RVH from essential hypertension. The study compared 175 patients with RVH (91 cases of arteriosclerotic stenosis and 84 cases of fibromuscular dysplasia) that had been cured by surgery to 339 patients with essential hypertension.11 Fibromuscular dysplasia was shown to be a disease of younger, predominantly female patients with no family history of hypertension. Arteriosclerotic patients were profiled as older, with higher systolic blood pressure, and often showed evidence of arterial disease at sites other than the kidney. Although this study showed differences between the groups, no criteria were sufficiently sensitive or specific to distinguish the groups completely (Table 9–1). For instance, although a bruit was more often associated with RVH, a bruit is heard as frequently in essential hypertension. This is true because, although a lower percentage of patients with essential hypertension have bruits, essential hypertension is much more common than RVH. Still, this and other studies do point out some characteristics of patients that suggest RVH. Mann and Pickering produced indexes of clinical suspicion that can guide the evaluation of patients with hypertension.9 Those with borderline, low, or moderate hypertension and no clinical clues have a low index of suspicion and do not require a workup. For patients with a high index of suspicion, diagnostic testing is indicated. Angiography may be the appropriate first diagnostic imaging test. They identified patients at high risk, including those with (1) severe hypertension and either progressive renal insufficiency or lack of response to therapy, (2) accelerated or malignant hypertension, (3) grade 3 or 4 retinopathy, (4) hypertension with recent unexplained elevation of serum creatinine, (5) hypertension with elevation of serum creatinine reversibly induced by angiotensin-converting enzyme inhibitor, or (6) moderate or severe hypertension with asymmetrical renal size.
Differential Diagnosis
| Hypertension | |
| Essential (%) | Renovascular (%) |
Duration of hypertension | ||
Less than 1 year | 12 | 24 |
Greater than 10 years | 15 | 6 |
Age of onset > 50 | 9 | 15 |
Family history of hypertension | 71 | 46 |
Grade 3 or 4 fundi | 7 | 46 |
Bruit | ||
Abdomen | 9 | 46 |
Flank | 1 | 12 |
Both | 9 | 48 |
BUN > 20 mg/100 mL | 8 | 15 |
Serum K < 3.4 mEq/L | 8 | 15 |
Serum CO2 > 30 mEq/L | 8 | 16 |
Urinary casts | 9 | 20 |
Proteinuria (a trace or more) | 32 | 46 |
Note: 131 cases in each group matched by age, sex, race, and blood pressure. Only statistically significant differences are noted. (From Detection, evaluation, and treatment of renovascular hypertension: final report of the working group on renovascular hypertension. Arch Intern Med 1987;147:820–829. Reprinted with permission.)
The workup of those with moderate risk such as those with refractory hypertension or moderate hypertension with a bruit or occlusive vascular disease elsewhere may require additional testing. Noninvasive tests may be helpful in this group if they identify patients for angiography.
The Dutch Renal Stenosis Intervention Cooperative (DRASTIC) study is a large multicenter Dutch study looking at RVH.12 Angiography was performed in those who did not respond to two-drug therapy in 2 months. Up to 25% of persistently hypertensive patients had RAS.13 The investigators concluded that drug resistance is a simple and useful clinical criterion to identify patients for angiography. A more recent multicenter trial that used the DRASTIC model showed that those with abdominal bruit, athero-sclerotic disease, body mass index < 25 kg/m2, renal function < 60 mL/min, and age greater than 58 years were significantly linked to RAS.14 In this study no variable or combination of variables predicted RAS, but the absence of all five variables excluded RAS with a probability of 98%.
Although clinical criteria may determine some characteristics that suggest RVH, using a noninvasive screening test (such as imaging) to identify a subgroup with an even higher likelihood of a positive angiogram is another widely utilized strategy. Noninvasive tests must be applied to a subset of hypertensives with a greater likelihood of RVH. No matter how accurate the noninvasive screening test is, it will be ineffective if it is used on an unselected population of hypertensives. For example, suppose a test is quite accurate—100% sensitive and 95% specific. If this is applied to all hypertensives (3% incidence of RVH), the predictive value for RVH is only 6%. Only six of 100 angiograms will demonstrate RAS. If the population is preselected to have more RVH, the predictive value is higher. If applied to a population with 25% RVH, the test will have a predictive value of 87%; this will increase to 93% if 40% of patients have RVH. Indices of clinical suspicion are necessary to define a population that would reasonably benefit from screening.
The clinician’s view about therapy also affects the workup. The results of revascularization are not entirely clear-cut in favor of subjecting patients to this treatment. In the absence of consensus, the diagnostic workup and referrals for treatment vary. The arguments made for repair of RAS cite the potential for removing or reducing a lifetime dependency on medication and for stopping or slowing the development of renal failure and other complications of hypertension. The argument against repair cites the morbidity and mortality of the procedures, the absence of long-term proven benefit, and the view that modern medical treatment may effectively treat many patients.13,15
Those who favor medical therapy may see no need to put patients through tests that will not alter their therapy. Those who favor revascularization are more aggressive in their efforts to detect RAS. Dean16 has all operative candidates with diastolic blood pressure above 105 mm Hg evaluated for secondary hypertension.
Diagnostic Evaluation
Nonimaging Evaluation
Peripheral plasma renin activity and its evaluation after captopril (captopril test) are nonimaging screening tests used to determine whether hypertension is renin dependent. These tests do not localize the disease.
Vaughan’s group advocates that all patients at high risk for RVH receive an ambulatory plasma renin activity level test17 to determine the functional impact of an anatomical lesion that might be found. They find that low plasma renin activity levels are rare in untreated patients who do not have renal disease. The reported usefulness of plasma renin levels varies widely in other studies, probably due to such factors as patient preparation, medications, and assay techniques.18,19
Another blood test is provocative testing with captopril to elicit a hyperreninemic response. A wide range of sensitivities (34 to 100%) and specificities (72 to 95%) has been reported.13,18,19 To perform the test correctly patients should discontinue antihypertensive medications and have an adequate amount of salt intake. Renal insufficiency, bilateral disease, and restrictive conditions make the test difficult to perform correctly. Derkx et al reported sensitivity of 84% and specificity of 93%, but the test was performed in the hospital.13
Renal vein determinations can be done with or without captopril stimulation. These invasive tests showed excellent results in early studies and results that are more modest on follow-up.19
Imaging Other than Ultrasound
Scintigraphy
Captopril renal scintigraphy (CRS) is the most widely studied noninvasive imaging test for RVH. It is used in suspected RVH, not as a general screening study. Captopril inhibits angiotensin-converting enzyme, thereby blocking angiotensin II conversion. This, in turn, prevents post-glomerular efferent arteriolar vasoconstriction and decreases the glomerular filtration rate (GFR) in the stenotic kidney. The contralateral normal kidney shows an increase in GFR. This disparity in renal function can be detected by scintigraphy. Most studies have used diethylenetriaminepentaacetic acid (DPTA), but some have also evaluated radiopharmaceuticals secreted by the tubules.
Prigent has pooled the results of several series of nuclear scans.19 The sensitivity for RAS of these pooled data was 73%, with specificity of 85% for evaluating differences between baseline and postcaptopril scans. If only the post-captopril scans are used, the sensitivity rises to 85% and specificity becomes 83%. The value of captopril is questioned by other investigators.13
Pooled data also exist on how well captopril predicts a response to revascularization, and, therefore, RVH rather than RAS. Scintigraphy has a sensitivity of 76%, with a specificity of 92%, for the prediction of a cure or improvement.19 If only postcaptopril scans are evaluated, then the test’s ability to detect kidneys that will improve rises, but specificity drops off dramatically to a disappointing 66%.
Captopril renal scintigraphy is less accurate if patients have a small kidney. In the European multicenter trial,20 abnormal renal function markedly diminished the test’s specificity and accuracy (from 93 to 55% and from 90 to 68%, respectively). When this trial removed the results of patients with small kidneys and abnormal renal function, the specificity for response to treatment rose from 82 to 100%.
Magnetic Resonance and Computed Tomographic Angiography
Magnetic resonance angiography (MRA) is being actively investigated as a means of diagnosing RAS.21–33 A variety of tests is being evaluated, including time-of-flight and phase-contrast techniques (Fig. 9–1). Protocols using gadolinium enhancement are also being investigated. Gadolinium has the potential to speed the examination, improve spatial resolution, and diminish artifacts. Results in the various studies have reported sensitivities from 92 to 100% with specificities of 71 to 96%22,29,33,34 In a meta-analysis, enhanced three-dimensional MRA and computed tomographic angiography (CTA) outperformed ultrasound and other diagnostic tests, and nonenhanced MRA also outperformed ultrasound.35 In the multicenter RADISH trial from the Netherlands, enhanced MR demonstrated less than expected sensitivity of 62% (confidence interval [CI] 54 to 71%) and specificity of 84% (CI 81 to 87%).36
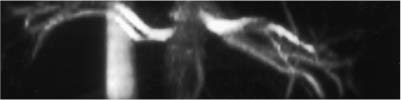
Figure 9–1 Three-dimensional reconstruction of phase-contrast magnetic resonance angiography of normal renal arteries.
Some of the poor results were due to inability to detect fibromuscular dysplasia (36% of the patients with RAS), but MRA for atherosclerotic RAS yielded a modestly improved sensitivity of 78% (CI 70 to 87%) and specificity of 88% (CI 86 to 91%). Raising the threshold to diagnose RAS from 50 to 70% did not change the results.
MRA misses accessory vessels and the intrarenal stenoses of fibromuscular dysplasia. In one recent study, gadolinium enhancement did allow detection of more accessory vessels, but did not improve the accuracy of the phase-contrast study for RAS detection.22
MR may also be used to evaluate some physiological aspects of RVH similar to nuclear scanning. Ros et al are using the passage of gadopentetate dimeglumine to determine glomerular filtration rate.37
CTA using multidetector CT is being evaluated for a variety of abdominal vascular diseases, including RAS.38–41 CTA produces volumetric data that can produce three-dimensional reconstructions of arterial structures (Fig. 9–2). Thin-section axial scans can also be interpreted. A variety of reconstruction schemes are possible. With some thresholding techniques, stenoses may be misinterpreted.42 The examination takes little time and the collection of data is operator-independent; however, reconstructions take additional time to create and interpret.
Studies using spiral and 16-channel multidetector CTs report high sensitivity ranging from 86 to 100%, and high specificity, ranging from 94 to 100%.38–40,43 In the RADISH trial, CTA demonstrated less sensitivity and specificity than previous studies, 64% (CI 55 to 73%) and 92% (CI 90 to 95%).36 Only one of six centers used a multidetector CT (four slice); nonetheless, all scanners yielded similar results. As with MRA, some of the poor results were due to inability to detect fibromuscular dysplasia. CTA for atherosclerotic RAS yielded a better sensitivity of 77% (CI 67 to 86%).
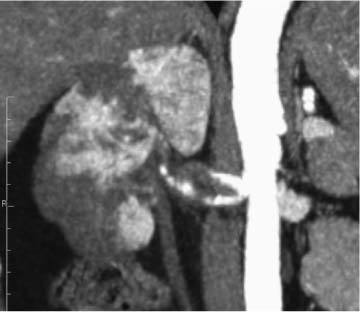
Figure 9–2 Multiplanar coronal reconstruction of multidetector computed tomographic angiogram. There is a right renal artery dissection and multiple renal infarcts. The patient has Ehlers-Danlos syndrome.
Olbricht et al found some loss of accuracy when there was impaired renal function, but the numbers were too small for statistical evaluation.40 Accessory vessels may be missed if they are outside of the acquired volume. A potential drawback to CTA is the requirement of iodinated contrast medium.
Both MRA and CTA are emerging techniques. Clinical trials with newer equipment (e.g., 16 and higher detector CT) and standardization of techniques (particularly for MR) are needed to determine their final place. For those patients whose doctor has a high clinical suspicion, angiography may still be required for a definitive diagnosis, despite a negative scan.
Ultrasound
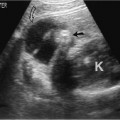
Kidney atrophy and loss of mass over time are related to RAS.44 In patients suspected of RVH, kidney size should be measured. In serial studies, it should be determined if there is a loss of renal mass. The demonstration of a small kidney (< 7.5 cm) is important because the shrunken kidney is unlikely to respond to revascularization.4 Testing should concentrate on detecting a potentially curable lesion in the normal-sized kidney.
The role of Doppler ultrasound in evaluating a patient for RAS is far from clear. Although some investigators have shown superb results with Doppler ultrasound imaging, others have failed to duplicate these results. Successful groups and skeptics all agree the test is technically challenging. Investigations to diagnose Doppler examinations to diagnose RAS have fallen into two broad techniques: those that evaluate the renal arteries directly and those that evaluate the intrarenal vasculature.
Direct Doppler Evaluation of the Renal Artery
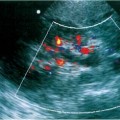
In this test, the renal artery is insonated along its course, and spectral Doppler tracings are obtained from the origin of the vessel to their entry into the kidney. Scanning is typically directed by color Doppler scanning (Fig. 9–3). For examination of the renal arteries, lower frequency transducers are often preferable, especially those at 2 to 2.5 MHz. Although resolution decreases with lower frequency transducers, attenuation also decreases, and this is the more critical factor. Filter settings should be set low yet high enough to suppress peristalsis, noise, and respiratory movement.
The left renal artery is found behind the left renal vein. The right renal artery originates at a similar level, or it can be found behind the inferior vena cava. Although the vessels travel posteriorly, their origins are typically from the middle, or even the anterior third, of the aorta. In certain patients, a decubitus view is helpful to move bowel out of the way. One can detect the renal origins in a coronal plane (Fig. 9–4).
Localization of the site of RAS is based on the detection of a high-velocity jet at the stenosis (Fig. 9–5). The velocity is maximal at the site of the tightest stenosis. Distal to the jet, secondary flow disturbances may exist. These include spectral broadening, shift of the distribution of blood velocities toward the baseline and away from the envelope, and simultaneous forward and reverse flow (Fig. 9–6). Velocities downstream from the stenotic jet are diminished. In some patients a bruit may be seen or heard. It appears on the spectrum as a low-velocity signal that is symmetrically above and below the baseline (Fig. 9–7, Fig. 9–8). Color Doppler may demonstrate a bruit as random color appearing in the adjacent soft tissues. Spectral or color bruits are usually detected in systole.
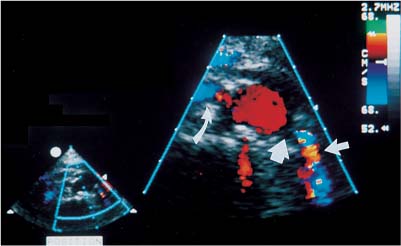
Figure 9–3 Renal color Doppler flow image of left renal artery stenosis shows marked narrowing of origin of the left renal artery (thick straight arrow). Red in the left renal artery, just after color is detected, represents aliasing (thin straight arrow). Normal right renal artery is also noted (curved arrow).
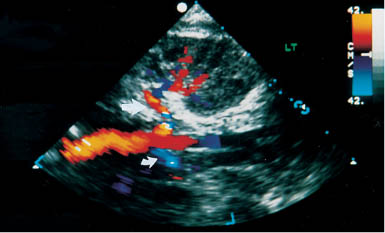
Figure 9–4 Coronal color Doppler flow image of renal artery origins. Left renal artery (straight arrow) can be traced in its entirety into the kidney. Proximal right renal artery (curved arrow) can also be seen.
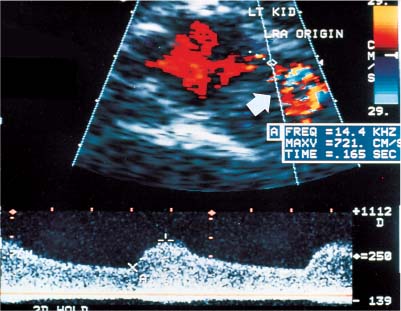
Figure 9–5 Left renal artery stenosis. Spectral color Doppler flow image shows marked narrowing of color column at origin of left renal artery. Sample volume within the narrowing yields a peak systolic velocity of 721 cm/s. Poststenotic dilatation (arrow) is seen distal to the narrowing. Note mosaic pattern, a mixture of colors in post-stenotic regions that indicates aliasing.
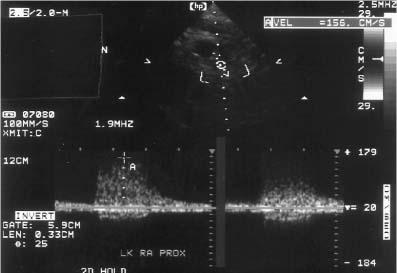
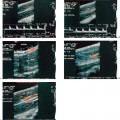
Figure 9–6 Spectral duplex Doppler image demonstrates downstream flow disturbances distal to a site of renal artery stenosis. Edge of the waveform is poorly seen. Whiter shades near the baseline indicate that more blood is moving at the lower velocities. Many different velocities are represented, which produces spectral broadening. Note simultaneous forward and reverse flow, probably the result of vortices and flow in many directions.
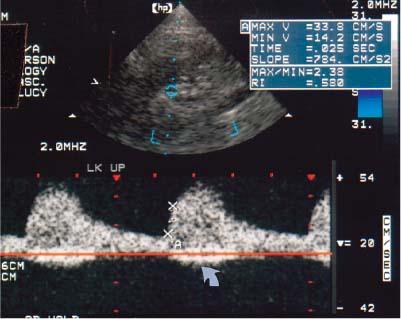
Figure 9–7
Related posts:
Stay updated, free articles. Join our Telegram channel

Full access? Get Clinical Tree


