Fig. 15.1
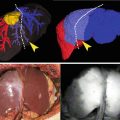
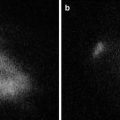
Typical fluorescence imaging appearance of hepatocellular carcinoma. (a) Near-infrared (NIR) fluorescence imaging of a resected specimen showing uniform (total) intra-lesion emission pattern (left panel). Resected specimen contained grayish-white tumor 15 mm in diameter, with capsule and septum (right panel). (b) NIR fluorescence imaging of resected specimen showing uneven (partial) intra-lesion emission pattern, and its emission spots were heterogeneously distributed (left panel). Tumor was 15 mm in maximum diameter and its margin was indistinct (arrow, right panel). (c) NIR fluorescence imaging of resected specimen showing rim-like emission pattern. The emitted light arose from the rim of the tumor (left panel). Resected specimen contained grayish-white tumor 20 mm in diameter, with capsule and septum (right panel). With permission from Morita Y, Sakaguchi T, Unno N, Shibasaki Y, Suzuki A, Fukumoto K, et al. Detection of hepatocellular carcinomas with near-infrared fluorescence imaging using indocyanine green: its usefulness and limitation. Int J Clin Oncol 2013;18(2):232–41© Springer [21]
For the classification of emission patterns, it is vital to keep constant brightness in the room and a constant distance between the camera unit and the tumor. The strength of excitation light also influences the emission pattern. Emission patterns seem to be unreliable when the recording conditions are variable.
Fluorescent Microscopy
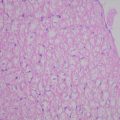
Emitted light can be seen even in formalin-fixed paraffin-embedded specimens. Fluorescent microscopy can be used to visualize fluorescence in the cytoplasm (Fig. 15.2a, b) and pseudogland (Fig. 15.2c, d) of HCC, or in the surrounding noncancerous liver tissues compressed by the tumor (Fig. 15.2e, f). ICG accumulations in the cytoplasm or pseudogland of HCCs cause macroscopic imaging appearances such as uniform (total) intra-lesion emission patterns or uneven (partial) intra-lesion emission patterns. Meanwhile, ICG accumulations in the surrounding noncancerous liver tissue cause a rim-like emission pattern. Hepatocytes express polarized transport systems at both the sinusoidal side and bile canalicular side. ICG uptake is mainly mediated by organ anion transporting polypeptide (OATP) 1B3 and Na+-taurocholate co-transporting polypeptide (NTCP) [22]. OATP1B3 and NTCP expression are reported to be low in HCC [23, 24]. Meanwhile, ICG excretion is thought to be mainly mediated by multidrug resistance P-glycoprotein 3 (MDR3) [25, 26]. MDR3 translocates phosphatidylcholine from the inner to the outer hemileaflet of the canalicular membrane, which is followed by its release from the outer hemileaflet into bile. MDR3 expression levels in HCC are reported to vary between individuals [23]. The emission pattern and emission-positive or emission-negative observations might be influenced by the expression levels of these transporters. More recently, Ishizawa et al. reported detailed observations about the mechanistic background of ICG accumulation [27]. They reported that the expression levels of NTCP and OATP1B3 tended to be lower in patients with rim-like emission patterns. Since the expression of OATP1B3, a main uptake transporter of ICG [22], is reported to decrease according to the de-differentiation process (from low-grade dysplastic nodule to poorly differentiated HCC) [24], uptake of ICG by poorly differentiated HCCs would be limited. These results suggest that in well-differentiated HCC tissues, sinusoidal uptake is preserved, whereas biliary excretion of ICG is probably impaired because of morphological changes associated with cancer progression. Meanwhile, the precise molecular mechanisms leading to rim-like emission patterns remain unclear. As mentioned in other reports [20] [28], the rim-like emission pattern may be due to locally impaired biliary excretion. Further studies are needed to verify this possibility.
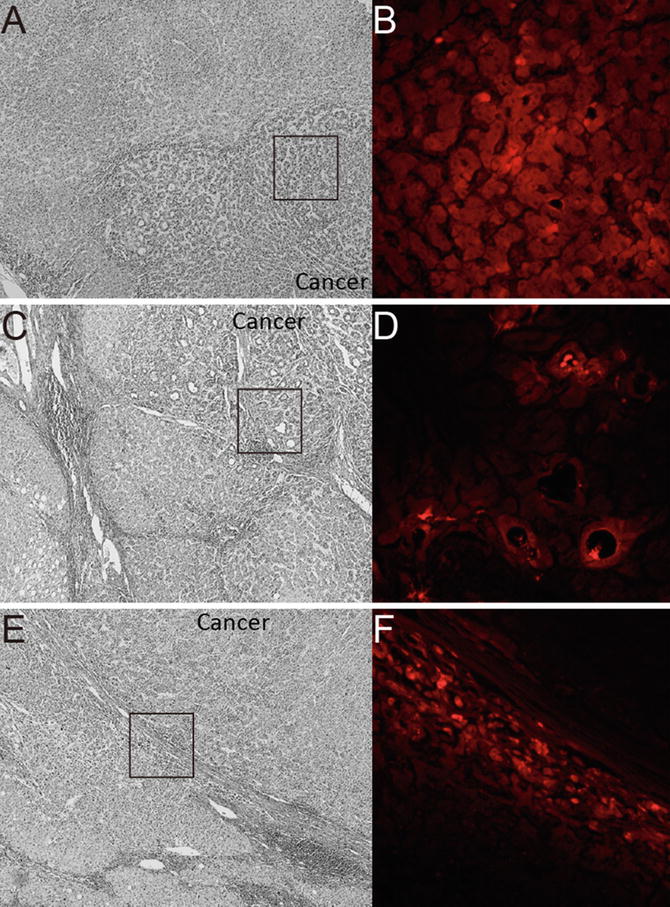

Fig. 15.2
Fluorescent microscopy findings of the resected specimen. (a) Photomicrograph of the resected specimen, which consisted of well-differentiated to moderately differentiated hepatocellular carcinoma (HCC) with trabecular structure. Hematoxylin staining, 40× at original magnification. (b) Fluorescent photomicrograph under near-infrared (NIR) showed clear emitted light (red in color) at the enclosed area in panel (a). Indocyanine green (ICG) localized in the cytoplasm of tumor cells, 200× at original magnification. (c) Photomicrograph of the resected specimen, which consisted of well-differentiated HCC with pseudoglandular structure. Hematoxylin staining, 40× at original magnification. (d) Fluorescent photomicrograph under NIR showed clear emitted light (red in color) at the enclosed area in panel (c). ICG localized in the pseudoglands of the tumor, 200× at original magnification. (e) Photomicrograph of the resected specimen, which consisted of moderately differentiated HCC with thick capsule. Hematoxylin staining, 40× at original magnification. (f) Fluorescent photomicrograph under NIR showed clear emitted light (red in color) at the enclosed area in panel (e). ICG localized in the cytoplasm of compressed adjacent parenchyma, 200× at original magnification
Intraoperative Detection of Tumors Using ICG Fluorography
In 3 reports [19–21], the intraoperative detection of preoperatively identified HCCs by surface observation with a NIR fluorescence imaging system was not always satisfactory. The detection rates in these studies using surface observation were 100 % (10/10), 51.2 % (21/41), and 61.8 % (47/76). Although NIR is capable of relatively deep penetration into biological tissues, the depth at which NIR light can be observed is about 5–10 mm [14]. According to Ishizawa’s report [20], no tumor at a depth of more than 8 mm was identifiable. Therefore, the fluorescent detectability depends on the hepatic parenchymal thickness between the serosal surface and the tumors. This issue needs to be resolved to increase the intraoperative fluorescent detection rate of HCC. On the other hand, ICG fluorography enables the identification of new foci that may have been preoperatively and intraoperatively unidentifiable by conventional imaging modalities, visual inspection, and manual palpation. In particular, ICG fluorography is effective in shallow areas where ultrasonography is not practical. In cirrhotic livers, small HCCs, even those just beneath the surface, are not always palpable. Combining the modalities of intraoperative ICG fluorography and ultrasonography may improve detection rates.
Newly Identified Foci During Hepatic Surface NIR Observation: Should We Resect?
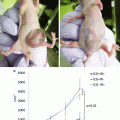
We and two other study groups have reported that ICG fluorography could detect new lesions that could not be recognized using any other preoperative and intraoperative examinations (Fig. 15.3a) [19–21]. According to these reports, 26 (66.7 %) of 39 lesions larger than 3 mm were of the nodular lesions and 11 (47.8 %) of 23 larger than 5 mm were HCCs (Table 15.1). On the contrary, only 2 of 15 lesions smaller than 2 mm were histologically diagnosed as HCC. From our investigation, 21 of 29 benign lesions showed a homogenous intra-lesion emission pattern in the resected specimens. On the other hand, five of six newly identified HCCs showed an uneven intra-lesion emission pattern, and one had a homogeneous intra-lesion emission pattern. The uneven emission pattern rate was significantly higher in HCC (p = 0.01) (Table 15.2). The calculated average emission intensities of HCCs were significantly lower than those of benign lesions (Fig. 15.3b). Interestingly, our results differed from those of Ishizawa [27]. They advocated that HCCs unidentifiable by gross inspection have higher emission intensities than non-cancerous lesions. Since these data were obtained from resected specimens, it is not clear whether these results are directly applicable to surface observation. At present, we cannot directly distinguish malignancies from small benign lesions by surface NIR observation. Further prospective studies are needed to determine whether incidentally found foci during hepatic surface NIR observation require resection.
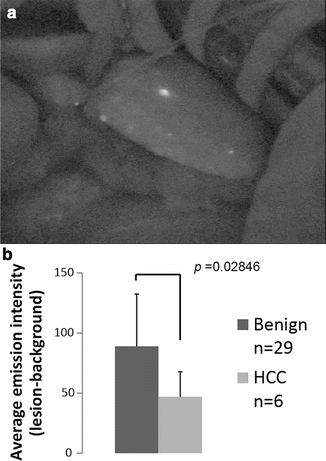

Fig. 15.3
Newly detected lesion under intraoperative NIR observation. (a) Newly detected emission spot, 3 mm in diameter, was intraoperatively detected on the surface of the liver under near-infrared (NIR) observation. (b) The calculated emission intensities in benign lesions and hepatocellular carcinomas (HCCs) using Scion image software are shown. With permission from Morita Y, Sakaguchi T, Unno N, Shibasaki Y, Suzuki A, Fukumoto K, et al. Detection of hepatocellular carcinomas with near-infrared fluorescence imaging using indocyanine green: its usefulness and limitation. Int J Clin Oncol 2013;18(2):232–41© Springer [21]
Table 15.1
Newly detected lesions under ICG fluorography
Author (reference) | Histological diagnosis | Newly detected lesions (N) | Emission size (mm) |
|---|---|---|---|
Gotoh [19] | |||
HCC | 4 | 3–6 | |
Benign lesion (DN, RN, normal liver)
Stay updated, free articles. Join our Telegram channel
Full access? Get Clinical Tree
 Get Clinical Tree app for offline access

|
