Fig. 3.1
Muscle fiber anatomy: cross-sectional illustration
Muscles have an origin, a belly, and an insertion. The origin and insertion attachment sites can be multiple including bones, cartilage, ligaments, and skin. By definition, the insertion is the attachment that has the greatest movement on muscle contraction. There are multiple different arrangements of fiber orientation with respect to the tendon including quadrilateral, fusiform, triangular, and pennate, which in turn can be unipennate, bipennate, or multipennate (Fig. 3.2).
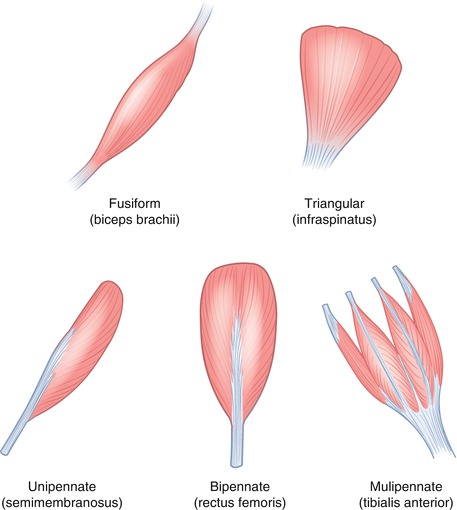
Fig. 3.2
Muscle structure: illustration demonstrating some of the different arrangements of fiber orientation
Ultrasound of Muscle
The fasciculi can be identified as separate structures on ultrasound. They are best identified in the longitudinal plane as hypoechoic cylindrical structures, separated by the hyperechoic intervening connective tissue, the perimysium (Fig. 3.3). Individual fibers and the endomysium are not individually discernible. The epimysium, fascia, and intermuscular fat are all thin linear hyperechoic structures on ultrasound. Ultrasound can also differentiate the different arrangements of muscle fibers.
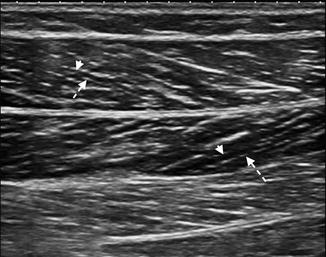
Fig. 3.3
Longitudinal US image of the medial gastrocnemius muscle demonstrating multiple linear hypoechoic cylindrical structures, the fasciculi. A muscle fasciculus (arrowhead) is shown separated by the thin hyperechoic intervening connective tissue, the perimysium (dashed arrow). Note the bipennate structure of the muscle
During muscle contraction, there is a shortening of fibers and an apparent increase in muscle bulk (Fig. 3.4). The hypoechoic fascicles appear thicker and give a more hypoechoic appearance to the muscle in the contracted state. When comparing the echotexture of the contralateral muscle, it is important that they are in the same state of relaxation or contraction. Abnormal contraction patterns may explain different functional capabilities in patients with similar pathology.
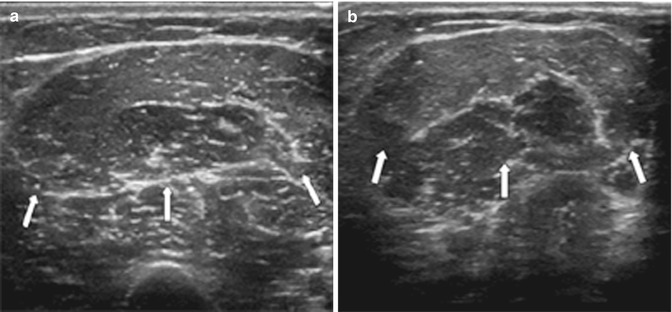
Fig. 3.4
Muscle contraction: transverse US image of the anterior mid-arm biceps muscle, short and long heads (arrows), (a) pre- and (b) post-muscle contraction. In (b), there is an apparent increase in muscle bulk and the hypoechoic fascicles appear thicker and slightly more hypoechoic
In general, linear array transducers are preferred with higher frequencies for superficial muscles. Deeper muscles may require the use of a curvilinear probe with a frequency of 5 MHz to allow for deeper penetration. Extended field of view can allow for the full length of the muscle to be captured on one image (Fig. 3.5). 3-D and 4-D are new applications that are in their early stages of development in musculoskeletal ultrasound. 3-D will allow multiplanar reformats and may allow better appreciation of the extent of pathology and surrounding anatomical relationships (Fig. 3.6). This may be of particular benefit to clinicians not used to viewing ultrasound images.
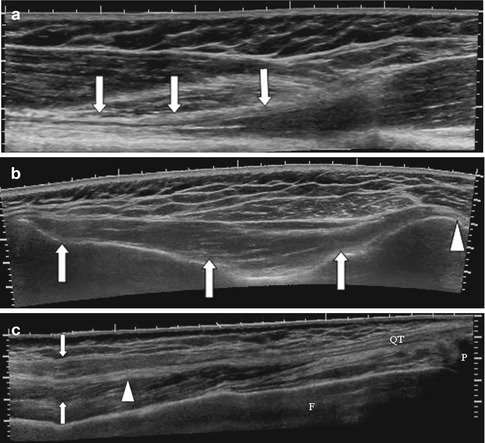
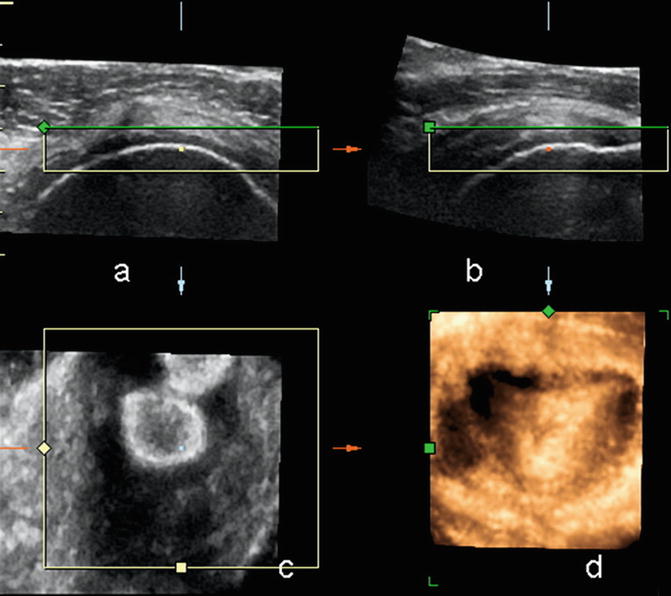
Fig. 3.5
Extended field of view imaging of the (a) long head biceps (arrows) at the musculotendinous junction, (b) Infraspinatus muscle arising from the infraspinous fossa (arrows) and inserting onto the greater tuberosity humerus (arrowhead) and (c) extended field of view rectus femoris at musculotendinous junction, tendon is central (arrowhead) surrounded by muscle (arrows)
Fig. 3.6
Supraspinatus tendon using 4-D transducer: (a) axial, (b) sagittal, (c) coronal, and (d) 3-D reconstruction
Ultrasound Technique
The probe is held perpendicular to the axis of the muscle and scanned in the longitudinal and transverse plane. If the patient has significant point tenderness, we normally scan the area surrounding this point first until we identify a normal ultrasound appearance and then move slowly over the symptomatic region. Recognizing normal anatomy and landmarks will allow for an easier assessment of adjacent pathology. Applying gel liberally and floating the probe over the area of interest to avoid compression are useful techniques in these circumstances. This allows the patient to relax and to tolerate a full study. Comparison to the contralateral side is helpful in delineating subtle abnormalities. Doppler may reveal the presence of normal transversing blood vessels and areas of increased/decreased internal flow in pathology.
MRI of the Muscle
The muscle is of intermediate SI on all imaging sequences. Individual fascicles can be appreciated on MRI. Advanced imaging techniques such as diffusion tensor MRI allow for identification of individual fibers and fiber disruption in trauma via tractography, but are not commonly used in daily practice. On T1-weighted sequence, fat is of high SI and is interposed between fascicles, intramuscular, and between different muscles, intermuscular. This imparts a marbled appearance to the muscle (Fig. 3.7). T2 has a similar appearance. With fat saturation there is a decrease in SI due to loss of signal from fat (Fig. 3.7b). It is therefore more difficult to separate different muscle groups with fat saturation. Tendons, depending on muscle type, can be seen as low SI structures, ovoid in cross section and linear in longitudinal plane in relation to the muscle.
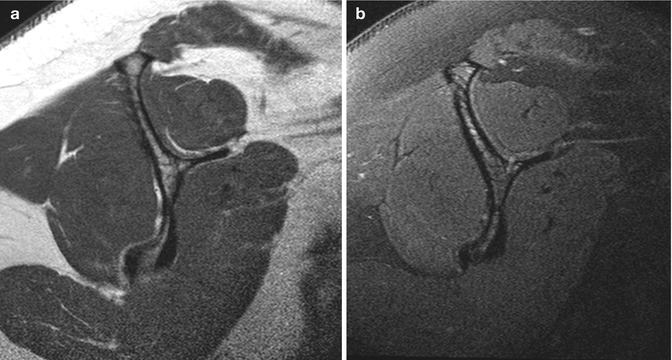
Fig. 3.7
MRI of a normal muscle: (a) rotator cuff muscles on T1 and (b) T2FS
Muscle Pathology
Muscle injuries are most common at or just proximal to the myotendinous junction. They can be classified as internal and external. Internal injuries are usually related to contraction, whereas external injuries are related to compression and penetration. In cases where the injury mechanism is not compatible with imaging findings, a predisposing condition such as a benign/malignant lesion or prior injury at the same site should be sought. Injuries can be classified into three grades (Table 3.1, Fig. 3.8). The initial injury site is occupied by hematoma which appears as a complex fluid collection, initially ill-defined interspersed between disrupted muscle fibers and later becoming defined as a localized collection of fluid displacing adjacent muscle fibers.
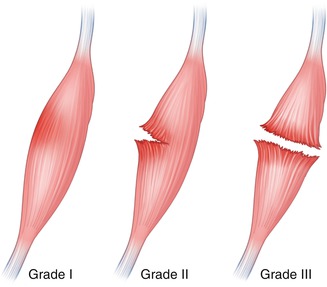
Table 3.1
Grading muscular injuries and imaging findings
Grade | Type | Ultrasound findings | MRI |
|---|---|---|---|
Grade 1 | Microscopic tear | Normal or may demonstrate minimal fluid, thickened hypoechoic myotendinous junction | Edema with T2 high SI with feathery appearance, +/− hemorrhage |
Grade 2 | Partial tear | Partial disruption fibers; defect may be occupied by fluid, hypoechoic or heterogeneous in appearance; fluid may track proximally or distally, exaggerating the true size of injury | Fiber disruption of up to 50 % with focal defect filled with high T2 SI fluid/hemorrhage, surrounding edema |
Grade 3 | Complete tear | Complete disruption fibers, proximal muscle retraction, defect occupied initially by fluid (hematoma) | High SI T2 fluid-filled defect, +/− retraction |
Fig. 3.8
Grading muscular injuries
MRI demonstrates a complex collection; internal signal intensity is variable depending on the age of hematoma. There is no internal enhancement but the capsule may enhance, although contrast is rarely required unless a predisposing intramuscular lesion is suspected. Ultrasound demonstrates a complex collection of heterogeneous echotexture. Ultrasound allows for a dynamic evaluation, with the patient actively contracting or the examiner passively moving and stretching the muscle of interest, which can allow for assessment of contraction patterns and aid in identifying the full extent of a muscle tear. Both imaging studies demonstrate related fiber disruption; however, this may be best appreciated on ultrasound in superficial injuries. CT is of limited value given limited soft tissue differentiation compared to MRI and ultrasound, and in addition it incurs a significant radiation dose. A low attenuating fluid collection and muscle defect can be identified albeit at a lower resolution and sensitivity than above imaging studies. Radiography may demonstrate localized ill-defined soft tissue thickening if involving the appendicular skeleton with loss of fat planes. Nuclear medicine studies are not indicated.
The hematoma eventually reabsorbs and depending on the severity of the injury and subsequent treatment will either heal or undergo fibrosis and scarring. Fibrosis on ultrasound appears as irregular hyperechoic foci with volume loss and areas of low signal intensity on MRI. In severe partial or complete tears, the muscle may become atrophied and undergo fatty degeneration. Comparison with the contralateral side, presuming that this is normal, allows for accurate assessment atrophy where there is visible loss of volume on ultrasound. A cross-sectional measurement comparison can be made for estimation. Fatty degeneration demonstrates increased echotexture compared to the normal hypoechoic muscle on ultrasound. Fatty atrophy is best assessed on T1-weighted MRI in orthogonal plane to the muscle (Fig. 3.9). This can be divided into four grades (Table 3.2).
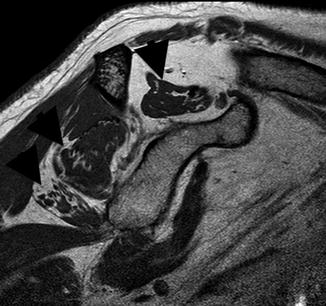
Fig. 3.9
Sag T1 rotator cuff muscles demonstrating atrophy and fatty infiltration (black arrowheads) of the supraspinatus, lower infraspinatus, and teres minor and atrophy without fatty infiltration of the subscapularis. See Fig. 3.7 for normal appearance
Table 3.2
Grading muscle fat infiltration
Grade 0 | Normal |
Grade 1 | Volume fatty tissue less than residual normal muscle |
Grade 2 | Volume fatty tissue equal to residual normal muscle |
Grade 3 | Volume fatty tissue greater than residual normal muscle |
Pyomyositis, a suppurative bacterial infection of the muscle, most often occurs in the immunocompromised patient. This is reviewed in detail in Chap. 13. Staphylococcus aureus is the most commonly isolated organism. Ultrasound findings depend on the stage of presentation and whether an abscess has formed. Initially the muscle is tender on probe placement and is swollen with a hyperechoic echotexture (Fig. 3.10). Later, as areas of necrosis and abscesses develop, hypoechoic foci become evident. An abscess has developed when these foci have a defined wall. They demonstrate increased through transmission, i.e., tissues directly posterior to the abscess demonstrate increased echotexture in comparison to adjacent similar tissue at the same depth (Fig. 3.11). The abscess is usually of heterogeneous echotexture. Doppler will demonstrate increased flow within the adjacent muscle and within the wall of the abscess. MRI demonstrates ill-defined edema as high SI on T2-weighted sequences, best appreciated with fat saturation or STIR. This is of low SI on T1. The muscle may be enlarged and fluid appears as linear high SI on T2 along fascial planes. Abscess formation appears as a heterogeneous encapsulated lesion of low SI on T1 and high SI on T2 with rim enhancement with contrast (Fig. 3.11). It may demonstrate restricted diffusion on diffusion-weighted imaging (DWI). CT is limited in assessment and may demonstrate an enlarged muscle with low-attenuation cystic lesion with rim enhancement.
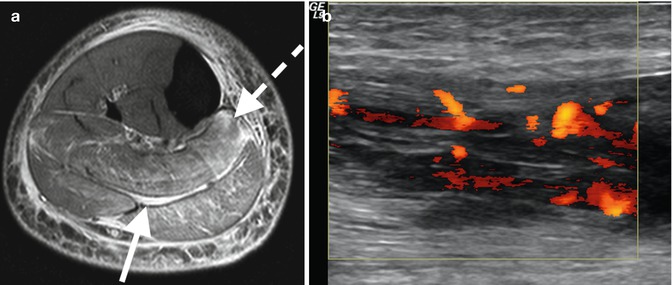
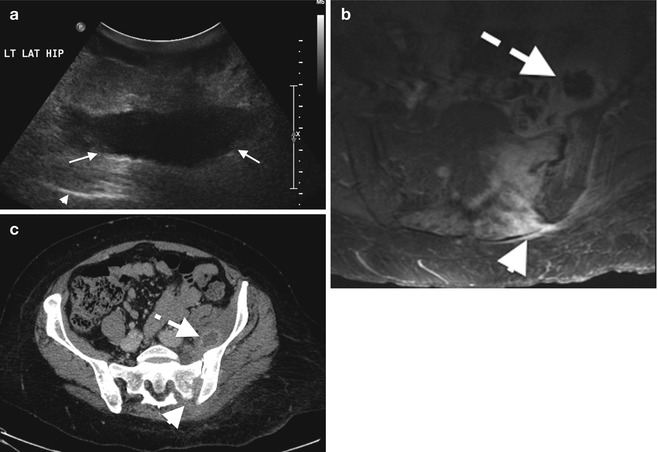
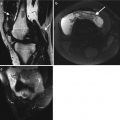
Fig. 3.10
Pyomyositis: (a) axial T2FS MRI in patient with pyomyositis with diffuse increased muscular edema (dashed arrow) and fascial fluid (arrow) and (b) longitudinal ultrasound image with power Doppler demonstrating hypoechoic muscle with marked increase flow
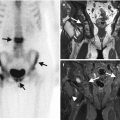
Fig. 3.11
Abscess: (a) soft tissue abscess over the left hip on ultrasound demonstrating a hypoechoic walled-off collection (arrows), (b) axial T1FS post-contrast MRI of septic arthritis on the left sacroiliac joint (arrowhead) with anterior abscess with central low signal intensity (dashed arrow) and surrounding enhancing muscle, pyomyositis, and corresponding CT on the same patient, and (c) with rim enhancement iliacus abscess
Plain radiography demonstrates no specific findings and may be normal. Soft tissue swelling may be present with loss of fat planes. Radiographs are useful for assessment of superficial or deep soft tissue air. Nuclear medicine with use of indium-labeled white cells can localize sites of infection but incurs a significant radiation dose and is not commonly used if nonionizing modalities are available. Differential diagnosis in diabetic patients includes muscle infarction, usually in poorly controlled diabetes. This most commonly involves the thigh musculature and presents with severe pain and muscle enlargement. MRI demonstrates diffuse edema with possible hemorrhage. If contrast is given, non-enhancing areas may be seen with surrounding rim enhancement in keeping with an area of infarction.
Idiopathic Inflammatory Myopathies
This group includes dermatomyositis, polymyositis, and sporadic inclusion body myositis. MRI is the imaging gold standard. Sporadic areas of increased ill-defined edema, depicted best on T2 fat-saturated sequences, are noted, usually affecting several muscle groups and most often involving the shoulder or pelvic girdle. MRI is useful for directing biopsy sites. Chronic disease demonstrates areas of atrophy and fatty infiltration. This is reviewed in detail in Chap. 7. Ultrasound may demonstrate muscle edema as areas of increased echotexture with increased flow on Doppler. Ultrasound findings are nonspecific but can be used to localize biopsy sites when correlated with MRI. CT and plain radiography have no role in the primary imaging of myopathies.
Fascia
Anatomy
Fasciae are divided into superficial and deep fasciae. The superficial fascia lies deep to the skin and is composed of fibroareolar tissue. It is of variable thickness and connects the skin to the deep fascia. The superficial fascia may contain superficial muscles or serve as attachment, e.g., platysma myoides. On ultrasound, the appearance of superficial fascia is determined by the content of adipose tissue, hypoechoic, and separated by thin hyperechoic linear bands (Fig. 3.12). MRI demonstrates a low signal intensity band.
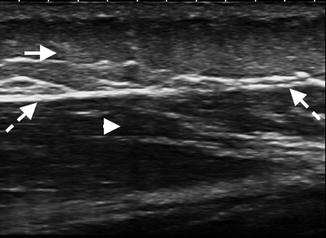
Fig. 3.12
Fascia: longitudinal US image of the proximal thigh demonstrating the superficial fascia containing adipose tissue (arrow) separated by thin hyperechoic linear bands. The deep fascia (dashed arrows) is thin and hyperechoic, enclosing the deeper hypoechoic muscle (arrowhead)
The deep fascia is a dense fibrous membrane that invests muscles and deeper structures. It is of variable thickness, becoming thicker on more exposed regions; e.g., it is thicker on the lateral aspect of the leg versus the medial aspect. It forms a sheath for muscles and occasionally as a site of attachment. It gives off the intermuscular septa, which separate various muscles and compartments and attach to the periosteum. In the regions of joints, the deep fascia can become thickened to form the retinacula, as part of fibro-osseous tunnels, maintaining the underlying tendons and nerves in place. On ultrasound, the deep fascia is hyperechoic with an identifiable fibrillar pattern of variable thickness. The hyperechoic intermuscular septa can be seen arising from the fascia. MRI demonstrates the deep fascia as low signal intensity on all imaging sequences. CT can identify fascia, fascial thickening, and perifascial fluid but is less sensitive than MRI; however, CT is excellent at detecting air. NM has no role in imaging fascia.
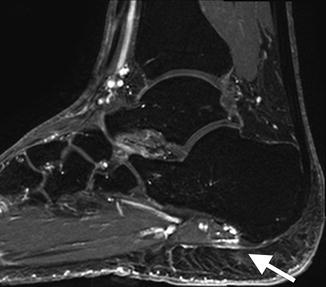
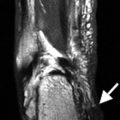
Fig. 3.13
Plantar fasciitis on Sag T2FS MRI of the right ankle with thickened plantar fascia of high signal intensity (arrow) at calcaneal attachment
Fascial Pathology
Plantar fasciitis is a common condition with inflammation of the plantar fascia at its calcaneal origin. It can be diagnosed with ultrasound or MRI (Fig. 3.13). Necrotizing fasciitis is a bacterial infection of the soft tissues that causes rapid tissue necrosis and rapidly spreads via fascial planes. It can be mono- or polymicrobial and may result from minor injuries. If it is clinically diagnosed, surgical debridement should not be delayed. MRI is the gold imaging standard and demonstrates fluid signal intensity along thickened fascial planes with adjacent edema of the musculature. Cellulitis on the other hand demonstrates edema confined to the subcutaneous tissues. CT may demonstrate thickening along fascial planes but is less sensitive than MRI but may demonstrate soft tissue air bubbles, which may not be appreciated on MRI. Radiographs may identify air within the soft tissues. Ultrasound and NM have no primary role in imaging necrotizing fasciitis. Necrotizing fasciitis is reviewed in detail in Chap. 13.
Eosinophilic fasciitis, Shulman’s syndrome, is a rare disorder. It is a localized scleroderma-like disease with bilateral peripheral symmetrical skin induration associated with peripheral eosinophilia. MRI is again the gold imaging standard and demonstrates fascial thickening on T1, high SI on T2FS or STIR sequences, and marked enhancement post contrast. MRI findings correlate with disease activity. Ultrasound can be cross-referenced with MRI using bony landmarks and is useful for localizing a biopsy site. Eosinophilic fasciitis is reviewed in detail in Chap. 7.
Tendon
Anatomy
Tendons are composed of tightly packed type I collagen fibers with intervening fibroblasts. Bundles of parallel fibers form primary (subfascicle), secondary (fascicle), and tertiary bundles. They are loosely bound in a loose connective tissue sheath, the endotendineum, and the peritendinal connective tissue. The latter encloses several subfascicles to form a fascicle. The peritendineum also contains the supplying blood vessels and nerves. The epitendineum is a thicker fibroelastic sheath surrounding the whole tendon. At the musculotendinous junction, the sarcolemma intervenes, i.e., there is no direct continuity of muscle and tendon fibers. At the attachment site to bone, the tendon fibers attach to the periosteum, to the fibrocartilage, or directly to the bone. Tendons can also insert onto fascia. Tendons can be round (e.g., biceps), oval (e.g., Achilles), or flattened (e.g., patellar tendon) in cross section. They are surrounded by a synovial sheath in regions that are exposed to friction on motion. The synovial sheath is composed of two layers, one of which is reflected along the surface of the tendon. The sheath contains synovium, which secretes a thick viscid fluid to reduce friction and encourages smooth gliding of the tendon. In areas where a synovial sheath is not required, the tendon is surrounded by the paratenon, a layer of loose connective tissue encasing the epitendineum (e.g., Achilles tendon).
On ultrasound, the tendon is composed of dense linear hyperechoic bands forming a fibrillar pattern, when evaluated in the tendon’s longitudinal axis (Fig. 3.14). On transverse images, the tendon is hyperechoic with multiple hyperechoic foci or dots. The hyperechoic appearance is due to the specular reflections at the interface between the fascicles and the peritendineum. Normal tendons are not compressible. The paratenon is identified as a thin hyperechoic line surrounding the tendon (Fig. 3.14b). The synovial sheath is best visualized when fluid is present between its layers (Fig. 3.15). A small amount of fluid may normally be present. In some tendons, the fibers have to change course slightly prior and at insertion and often appear hypoechoic due to anisotropy. Realigning the transducer so it is perpendicular to the change in orientation will resolve most of the hypoechoic appearance in normal tendons; the remaining hypoechoic appearance is related to the interdigitating fibrocartilage.
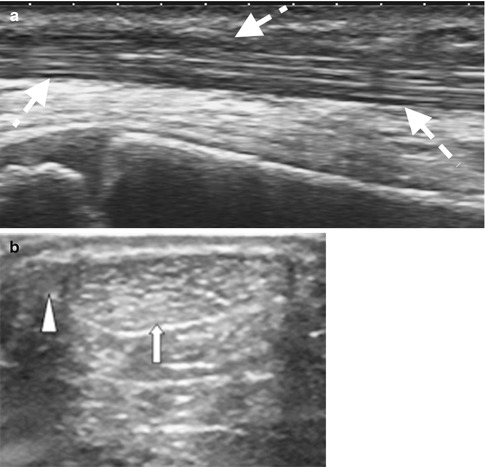
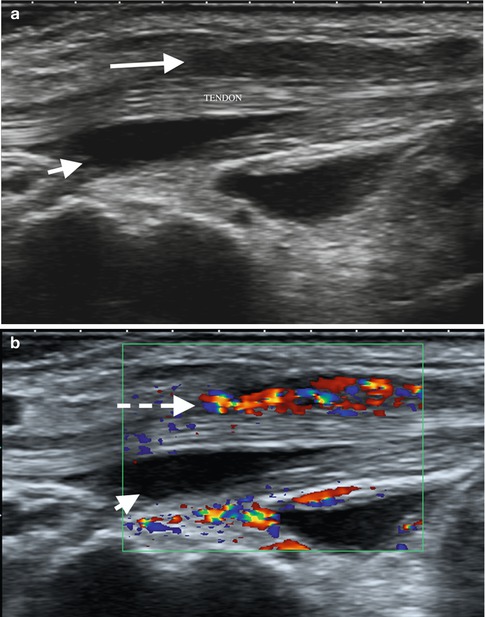
Fig. 3.14
Ultrasound of the tendon: (a) longitudinal ultrasound of the tibialis anterior with normal fibrillar pattern and (b) transverse US image of the oval Achilles tendon (A) (arrow) and adjacent plantaris tendon (arrowhead) medially; the paratenon is identified as the thin hyperechoic rim surrounding the AT
Fig. 3.15
Fourth extensor compartment tenosynovitis of the wrist on ultrasound: (a) tendons surrounded by fluid (anechoic, short arrow) and soft tissue thickening/synovial proliferation (long arrow) which demonstrates increased flow on Doppler (dashed arrow) (b)
On MRI, tendons are of low SI on all imaging sequences (Fig. 3.16). Magic angle is a common MRI imaging artifact and occurs when a structure, commonly tendons and ligaments, lies at 55° to the main magnetic field. This creates apparent increased SI within the tissue, simulating pathology. Common sites are the critical zone of the supraspinatus tendon proximal to its insertion onto the greater tuberosity, the proximal patellar tendon, and the peroneal tendons as they course under the lateral malleolus (Fig. 3.17). Magic angle is present only on sequences with a short TE such as T1, PD, and GE. Magic angle is not evident on long TE sequences such as T2 and STIR, and this allows differentiation from true pathology.
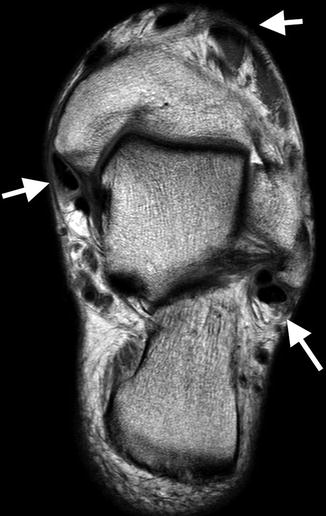
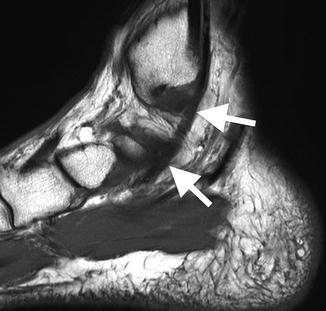
Fig. 3.16
Axial oblique T2 MRI image of the ankle demonstrating multiple round and oval low signal intensity normal tendons (arrows)
Fig. 3.17
Magic angle effect on Sag T1 ankle: tendon (arrows) appears of increased signal, intermediate signal intensity, but remains of normal signal on Sag T2 (not shown). See text for full explanation of magic angle
Tendon Pathology
Tendinopathy or tendinosis refers to tendon degeneration and is usually hypoxic or myxoid in origin. The term tendinitis is usually avoided, as there is usually no acute inflammatory component. On ultrasound, the tendon may be enlarged, be attenuated, or be of normal caliber. The normal fibrillar pattern is usually lost and is replaced by hypoechogenicity (Fig. 3.18). The tendon may demonstrate increased internal flow on Doppler interrogation. Comparison with the contralateral tendon can be helpful to identify subtle findings. On MRI, the tendon may be enlarged, be attenuated, or be of normal caliber. Increased internal signal intensity on T2-weighted sequences is in keeping with increased water content (Fig. 3.19). Post-gadolinium imaging demonstrates abnormal enhancement within the tendon and may also demonstrate enhancement of the tendon sheath or paratenon. Note that enhanced studies are not required for the diagnosis of tendinopathy. CT is not as sensitive or specific as ultrasound or MRI in assessing morphological change. It may demonstrate tendon enlargement, attenuation, split tendons, or complete tears. Current imaging description will therefore concentrate on ultrasound and MRI imaging appearances of tendon pathology.
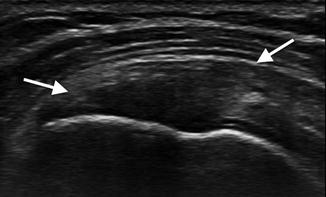
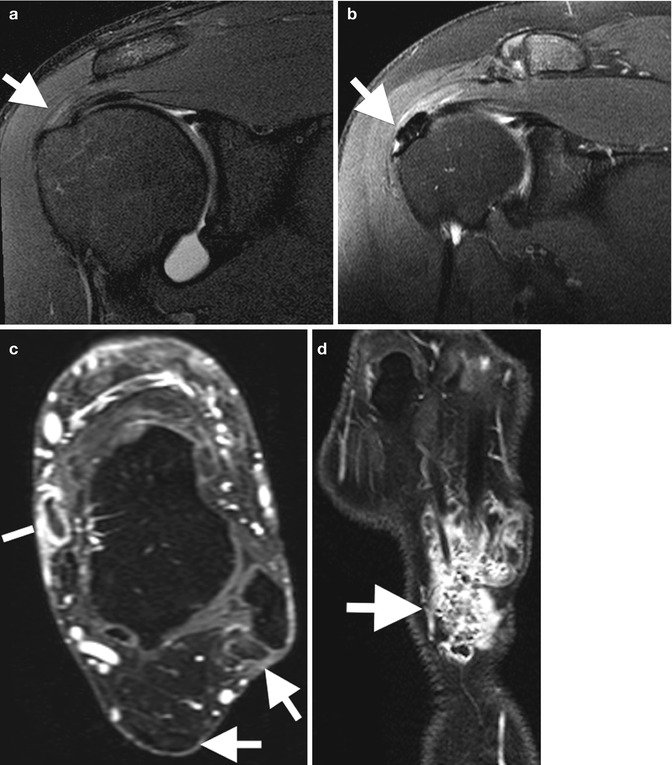
Fig. 3.18
Tendinosis on ultrasound: there is loss of the normal fibrillar pattern in this supraspinatus tendon (arrows) with generalized hypoechogenicity
Fig. 3.19
Tendinosis on MRI; (a) mild tendinosis of the supraspinatus tendon with mild increased signal on Cor T2FS (arrow), (b) calcific tendinosis of the supraspinatus with calcium deposit of low signal (arrow) on Cor T2FS, and (c) axial T1FS post contrast tendinosis (arrows) demonstrated by heterogenous tendons of increased signal and tenosynovitis (line). (d) Cor T1FS post contrast of the wrist in a patient with rheumatoid arthritis demonstrating enhancing, active, tenosynovitis on the fourth extensor compartment with internal low signal intensity bodies, “rice bodies” (arrow)
Tendon tears may be partial, full thickness, or complete (Fig. 3.20). Partial tears may be contained within the tendon, interstitial tears. Interstitial tears on ultrasound are identified as a hypoechoic or anechoic cleft within the tendon. On MRI, linear internal clefts of fluid signal intensity are identified (Fig. 3.21). Tears may progress and develop a longitudinal split of the tendon. Ultrasound and MRI will then demonstrate more than one tendon bundle. The number of tendon bundles, percentage of involved tendinous fibers, and positional relationship to the parent tendon should be noted. Be aware of accessory muscles and tendons which can simulate a split tear, e.g., peroneus quadratus is an accessory tendon adjacent to the peroneus longus and brevis at the level of the lateral malleolus and usually inserts upon the calcaneus and has its own muscle belly. It may simulate a tear of the peroneus brevis or longus tendons to the unwary.
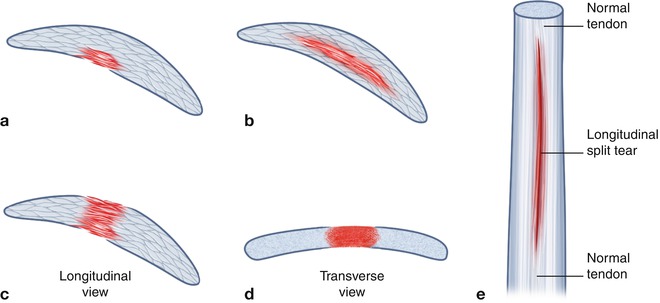
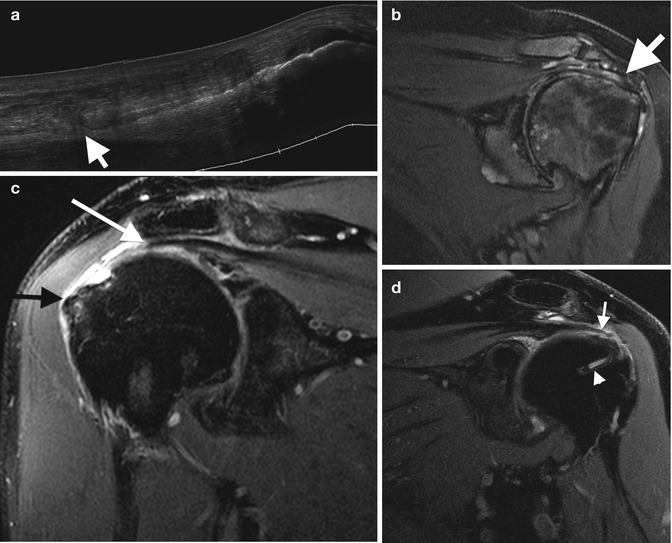
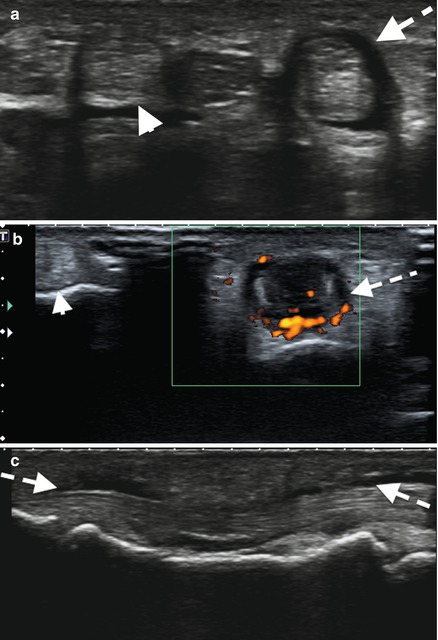
Fig. 3.20
Illustration of the common types of tendon tears: (a) partial-thickness tear, may be from superficial or deep surface. (b) Interstitial tear, does not extend to surface tendon. (c) Full-thickness tear in longitudinal axis: tear extends from superficial to deep margin; some tendon fibers remain intact as shown in (d) transverse axis. (e) A longitudinal split tendon where there are two or more tendon bundles. Other tendon tears include a complete tear with no residual intact fibers, an attenuated tendon, and tendon avulsion from bony attachment with or without avulsed bony component
Fig. 3.21
Tendon tears: (a) extended field-of-view longitudinal ultrasound image of a tendinotic Achilles tendon with proximal partial thickness tear (arrow). Cor T2FS MRI images of (b) the left shoulder in a patient with long-standing rheumatoid arthritis with secondary degenerative changes demonstrating attenuation, and tendinosis of the supraspinatus tendon. (c) Full-thickness tear of the supraspinatus with tendon retraction (white arrow) and bursal distension (black arrow). (d) Recurrent full-thickness tear of the supraspinatus (arrow); note the suture (arrowhead)
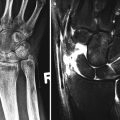
Fig. 3.22
Ultrasound of the third common flexor tendons – (a) transverse, (b) with power Doppler, and (c) longitudinal – demonstrating fluid distension tendon sheath (dashed arrow) surrounding the tendon with increased peritendinous flow on Doppler. Note normal second common flexor tendon and sheath (arrowhead)
Alternatively the tear may extend and involve the superficial fibers, a surfacing partial tear. Ultrasound and MRI both demonstrate fiber discontinuity. The defect may be occupied by granulation tissue or fluid. The defect appears hypoechoic/anechoic on ultrasound and demonstrates a fluid signal intensity defect on MRI. A full thickness tear requires extension to the opposite tendon surfaces, e.g., superficial to deep surface. It implies however that some tendinous fibers remain intact. Tendon tear area should be measured in orthogonal planes and include the percentage of fibers involved. When all fibers are disrupted, it is termed a complete tear. Measurement retraction between the tendon ends, residual distal tendon fibers remaining attached to bone, and bony avulsions should be assessed.
Tenosynovitis is active distension of the tendon sheath with fluid or synovium. Fluid may normally be present in tendon sheaths but is usually minimal. Some tendon sheaths communicate with joints and may have significant fluid within, e.g., flexor hallucis longus communicates with the ankle joint. The tendon sheath in these cases is not thickened and there is no synovial thickening. OMERACT has developed definitions for tenosynovitis on ultrasound and MRI based on literature reviews, expert reviews, and consensus (Table 3.3).
Table 3.3
OMERACT ultrasound and MRI definitions
Hypoechoic or anechoic thickened tissue with or without fluid within the tendon sheath, which is seen in two perpendicular planes and which may exhibit Doppler signal (Fig. 3.22). OMERACT ultrasound definition of tenosynovitis
Related posts:Stay updated, free articles. Join our Telegram channel
Full access? Get Clinical Tree
 Get Clinical Tree app for offline access

|