7 Image manipulation
| To produce an excellent image to maximise diagnostic accuracy |
| Analogue | Represents a quantity changing in steps which are continuous, i.e. a sine wave |
| Brightness | The intensity values of the individual pixels in an image, the lower the brightness the darker the image |
| Compression | The reduction in size (in bytes) of an image to save storage space |
| Contrast | The density difference between two adjacent areas on the image |
| Digital | An image comprised of discrete areas or pixels |
| Edge Enhancement | The highlighting of a straight line or edge of an object to visually increase the sharpness of the image |
| Fourier Transform | A method of mathematically changing data, e.g. changing spatial data to frequency data |
| Frequency Data | The number of times a specific value occurs in an image |
| Heuristic | When an image is automatically improved because the program has changed due to a previous imaging experience |
| Hough Transform | A method of highlighting areas of a specific shape within an image |
| Noise | Anything that may detract from the image |
| Resolution (Sharpness) | The size of the smallest object or distance between two objects that must exist before the imaging system will record that object or objects as separate entities. |
| Segmentation | Selection of an area of interest and eliminating unwanted data. Can be done manually or automatically with an appropriate software package |
| Signal | The information required from the imaging system, e.g. the radiograph, the minimum size of the object that must be visible |
| Spatial Data | Gives the position of the varying intensities (brightness) across an image |
| Spatial Frequency | Object size, measured in line pairs per millimetre |
| Spatial Resolution | The smallest part of an image that can be seen |
| Window | The range of colour (or grey) scale values displayed on a digital image |
| An Analogue Image |
• Two dimensional image
• Different shades of grey
• The shading is continuous throughout the image
|
| A Digital Image |
• Two dimensional image
• Different shades of grey (or colours – red, green blue)
• The grey is made up of discrete areas or pixels
|
| Changing an Analogue Image to a Digital Image |
• Take the analogue image
• Imagine a grid superimposed over the image – usually 512 × 512 or 1024 × 1024
• Each pixel can then be given a number representing the brightness/shade of grey
• Usually each pixel is given a value between 0 and 256
• This gives the image numerical values, i.e. digitises it
|
| Nyquist Theorem | States that an analogue signal waveform may be reconstructed without error from a sample which is equal to, or greater than, twice the highest frequency in the analogue signal, e.g. |
Fourier Transform
| Methods of manipulating the pixel values to improve or enhance the area of interest in the image | |
| Windowing |
• Process of using the pixels to make an image
• 256 shades of grey are usually assigned
• But the human eye can only determine about 100 shades of grey
• The shades of grey can be distributed over a wide or a narrow range of pixels
|
| Narrow Window |
• The grey is distributed over a narrow range of units
• The central unit is the average pixel number for the structure of interest
• If the average pixel was 50 and a narrow window of 170 was selected, then pixels of 85 (half 170) above and below 50 would be used
• Therefore the grey scale would extend from – 35 to 135
• Any readings below – 35 would be pure black
• Any readings above 135 would be pure white
|
| Wide Window |
• The grey is distributed over a wide range of pixels
• The central unit is the average pixel number for the structure of interest
• If the average pixel was 400 and a wide window of 2000 was selected, then pixels of 1000 (half 2000) above and below 400 would be used
• Therefore the grey scale would extend from – 600 to 1400
• Any readings below – 600 would be pure black
• Any readings above 1400 would be pure white
|
| Signal to Noise Ratio | Image quality may be defined as the signal to noise ratio: |
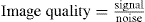
The signal is the information required from the imaging system
The noise is anything that may detract from that signal
Image Quality
ContrastA radiograph is the product of a transfer of information. During this transfer it is exposed to a number of different influences. Contrast helps to determine the quality of the radiograph
There are three principal ‘types’ of contrast
Subject ContrastSubject contrast (Fig. 7.2) can be defined as the ratio of the emergent intensities, i.e.:
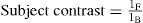
Factors Affecting Subject Contrast Different Thicknesses of the Same Tissue TypeSubject contrast is the ratio of the intensity that has passed through the thin part, compared with the thicker part
The thicker of the two will:
Different Densities of the Same Tissue with the Same Volume but at a Higher DensitySubject contrast is the ratio of the intensity that has passed through the less dense part, compared with the denser part
The higher density will:
Different Atomic Numbers of Different TissuesThe higher the atomic number:
Note
At the energies used in diagnostic radiography, photoelectric absorption predominates and is the largest contributing factor to subject contrastRadiation Quality – The kiloVoltage (kV) Set for the Exposure
Related posts:

Stay updated, free articles. Join our Telegram channel

Full access? Get Clinical Tree


