CHAPTER 12 Image Postprocessing in Cardiac Computed Tomography
The role of CT in the evaluation of cardiac disease is no longer the subject of possible applications, but more in the realm of determining positive and negative predictive values as cardiac CT angiography becomes a central part of cardiac imaging. Whether the application is to determine coronary artery stenosis in native vessels, to determine patency of bypass grafts or stents, or to detect anomalous anatomy, CT has been shown in many cases to be the study of choice. In the emergency department, the power of a 100% negative predictive value promises to lead to a paradigm shift in emergency department triage for patients with chest pain.1,2 Similarly, a gated CT acquisition has become the standard of care to evaluate aortic root pathology, including valvular disease, suspected dissection, Marfan syndrome, and Loeys-Dietz syndrome.3–5 Other applications, such as preoperative assessment and postoperative evaluation in congenital heart disease, are becoming a well-accepted application for CT angiography.6,7
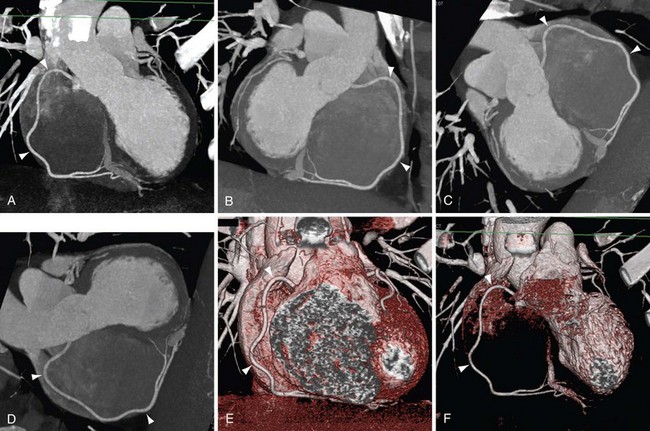
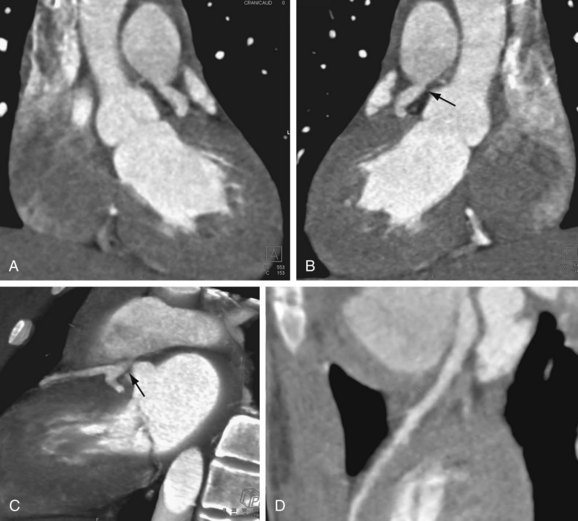
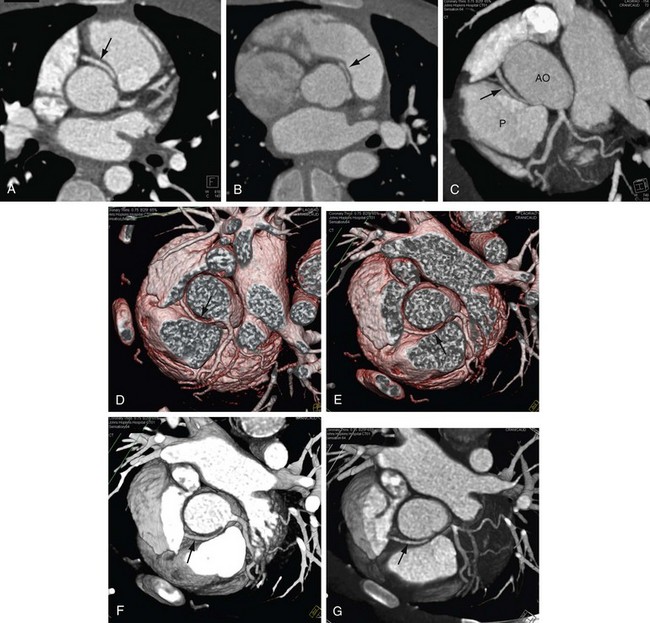
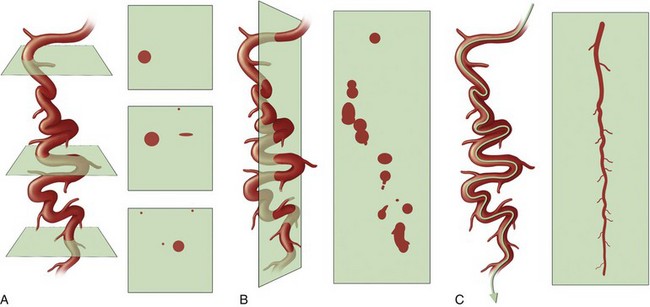
Despite more than 400 articles on the subject and a body of literature that continues to grow, few published data have focused on the technical aspects of different processing techniques for the evaluation of the heart and coronary arteries.8–13 The “how-to” of data acquisition (16 vs. 64 vs. 128 detector scanners)14–16 is addressed in detail in the literature, as are contrast delivery techniques (test bolus vs. bolus triggering vs. timed injection),17–19 but the analysis of the resultant CT data has been the topic of only a few articles of note. This chapter provides a systematic approach to data analysis, with emphasis on how to use each postprocessing tool to its greatest advantage (Figs. 12-1 through 12-4), to interpret most accurately an isotropic multidetector CT volume of the heart.
TECHNICAL REQUIREMENTS
With respect to data analysis, the most comprehensive article has been by Ferencik and colleagues.11 Two important statements from this article are as follows:
TECHNIQUE
Axial Images
Although a cardiac CT scan typically is reviewed at least using multiplanar reconstruction and three-dimensional renderings, the axial images (see Fig. 12-3) remain a crucial part of the study workflow. At some sites with highly experienced interpreting physicians, interpretation is typically limited to the axial images with sparing use of additional views in selected cases. On a workstation with a composite display of axial, coronal, and sagittal images combined with a three-dimensional image, our strategy for axial images is to scroll interactively through the data set in what the scanner selects as the optimal phase (0% to 90% of R–R interval on retrospective gated study) for coronary artery visualization. We then do the following:
The limitation of axial images is that one may need to look at 200 to 350 individual slices to get through a single vessel, such as the left anterior descending coronary artery. Vessels with off-axis courses, such as the right coronary artery, are best defined when one is looking beyond the axial plane. A more global presentation of an entire coronary artery is impossible without a curved planar reconstruction (CPR) (see Fig. 12-4) or three-dimensional display.
Multiplanar Reconstruction—Coronal and Sagittal Images
The use of coronal and sagittal reconstructions is common in a range of CT applications, and in cardiac CT its role is also defined. With isotropic data, the individual cardiac chambers, aorta, and pulmonary vasculature can benefit from these displays, and they are routinely used. Whether it is for suspected aortic dissection or suspected pulmonary embolism, these displays are essential. On most workstations, the thickness of the reconstruction can be interactively adjusted (Fig. 12-5), but when slabs are reduced to beyond a few millimeters, the images become fuzzy and are of no value. This is in contrast to MIP images, where often less data may prove to be useful for these large-volume applications. One issue with coronal and sagittal reconstruction and evaluation of the coronary arteries is that because the vessels have a nonlinear pathway, only short segments can be analyzed at a time. When the left anterior descending coronary artery is analyzed with a coronal or axial display, one must constantly change the angle of the reconstruction plane to follow the vessel. Changing the angle can be done interactively, but potentially results in more room for error and less than ideal image displays. For analyzing selected segments of a vessel, this technique might be perfect. If there is a suspect area on the axial views, the coronal or sagittal view may help clarify and quantify this potential narrowing. Key points include the following:
Stay updated, free articles. Join our Telegram channel

Full access? Get Clinical Tree


 FIGURE 12-1
 FIGURE 12-2
 FIGURE 12-3
 FIGURE 12-4