mp-MRI
Histopathological correlation
References
HR T2
Glandular morphology
Bezzi et al. (1988)
DWI
Gleason score
Turkbey et al. (2011)
DCE-MRI
Neoangiogenesis
Engelbrecht et al. (2003)
MRS
Cell metabolism
Costello and Franklin (1997)
Bowel motion artefacts can be reduced by administering an antiperistaltic agent such as butylscopolaminbromid. Patients should be instructed about the importance of not moving during image acquisition. An endorectal coil (ERC) is not an absolute requirement at either 1.5 T or 3 T anymore, but strongly recommended for imaging at 1.5 T (Beyersdorff et al. 2003). 3 T MRI scanners and the associated higher signal-to-noise ratio (SNR) provide excellent image quality without ERCs, which in turn translates generally in better patient acceptance. Phased-array coils with multiple receiving channels are currently used in standard clinical practice.
2.1 T2-Weighted Imaging
T2-weighted imaging (T2WI) can provide high spatial resolution and clear depiction of the zonal anatomy of the prostate and therefore is indispensable for PCa detection, localization, and accurate tumor staging. Anatomically, the prostate gland has four distinct glandular regions, the peripheral zone, central zone, transition zone, and the anterior fibromuscular zone.
A healthy peripheral zone has homogeneous high signal intensity (SI) on T2-weighted images, as it consists mostly of glandular structures. The central zone has variable amounts of inhomogeneous intermediate SI. Several studies in the late 1980s established that PCa in the peripheral zone is characterized by low T2 SI. This is due to unrestricted growing of cancer cells that do not preserve the glandular structure of the peripheral zone (Bezzi et al. 1988) (Fig. 1).
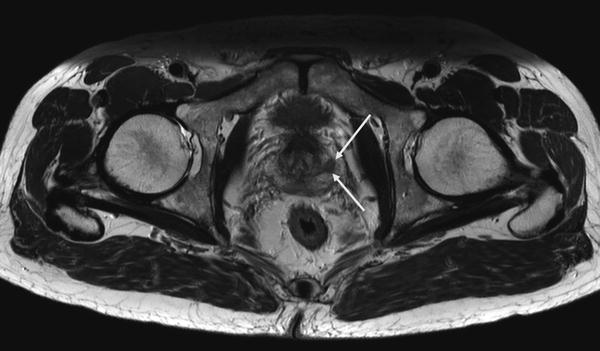
Fig. 1
Axial high resolution T2-weighted TSE showing a PCa lesion in the left peripheral zone (white arrows)
In the central and transition zone, an irregular low-SI area without capsule resembling an “erased charcoal” or a SI-disrespecting normal glandular structure, the capsule or the urethra is considered malignant. High-grade cancers usually have a lower SI than low-grade cancers (Wang et al. 2008).
Interpretation of T2WI includes the evaluation of all adjacent structures in the male pelvis, especially capsule, seminal vesicles, and posterior bladder wall for extra-prostatic tumor invasion as well as for lymph nodes and bone structures regarding lymphogenic or haematogenic tumor spread.
Sensitivity and specificity for T2WI differ among studies, Turkbey et al. found a sensitivity of 42 % and specificity of 83 % across all prostatic regions (Turkbey et al. 2010).
One drawback of T2WI alone is the limited specificity of low-SI areas. Benign abnormalities such as chronic prostatitis, atrophy, scars, postirradiation or antihormonal treatment effects, hyperplasia, and postbiopsy hemorrhage may mimic a low-SI-resembling tumor tissue (Kirkham et al. 2006).
2.2 Diffusion-Weighted Imaging (DWI) and the Apparent Diffusion Coefficient (ADC)
DWI adds important information about cellular density on a tissue level to the morphological information from high-resolution T2WI.
DWI as noninvasive, functional MR technique quantifies the Brownian motion of water molecules within tissue. Thereby, it enables not only qualitative but also quantitative tumor assessment. Reduced water diffusion in PCa has been attributed to increased cellularity through uncontrolled tumor growth with a consecutive reduction of the extracellular space. Therefore, DWI primarily provides an important quantitative biophysical parameter that can be used to differentiate benign from malignant prostatic tissue that shows the typical pattern of high SI on images with high b-values and low SI on the ADC map (Hosseinzadeh and Schwarz 2004) (Fig. 2a, b).
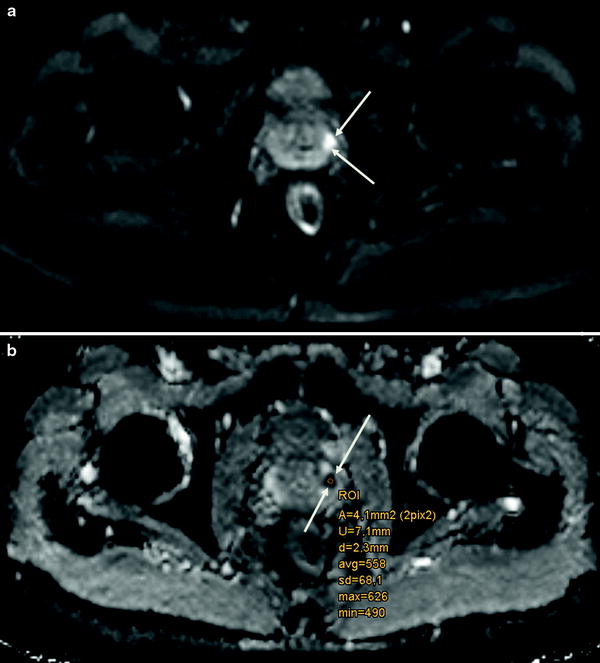
Fig. 2
a Axial DWI (b = 800 mm2/s) highlighting a PCa in the left peripheral zone (white arrows) and b corresponding axial ADC map
DWI in combination with T2WI is not only clinically relevant for improved tumor detection and characterization, but also increasingly used for therapy monitoring before, during, and after treatment (Chenevert et al. 2002). There is evidence that DWI allows to reflect cellular changes in malignant tissue, especially under radiation (Song et al. 2010).
DWI acquisition parameters should be optimized according to the respective MR imaging system as well as to the magnetic field strength that is implemented. The acquisition of at least two different b-values, which specify the sensitivity of diffusion weighting, is a prerequisite for the calculation of ADC maps for accurate quantitative analysis. Selection of the appropriate b-values for DWI is crucial because higher b-values increase the sensitivity to detect changes in diffusion, but at the same time impair the signal-to-noise ratio. Benefits of DWI are the relatively short acquisition time and high contrast resolution between tumors and normal tissue that is comparable to positron emission tomography (PET; “PET-like imaging”). A shortcoming of DWI is the vulnerability to susceptibility-induced distortion artefacts due to air/tissue interfaces, for example, at the boundary of the rectal wall.
DWI and the calculated apparent diffusion coefficient (ADC) in particular have initially been used to assess tumor aggressiveness, especially in brain cancers (Sugahara et al. 1999). In the meantime, several groups found out that ADCs obtained from DWI were significantly lower in PCas with higher Gleason scores (Turkbey et al. 2011). This allows for noninvasive assessment of the aggressiveness of PCas that are visible on MR images, which is an important predictor for patient outcome, prognosis, and can also be useful in the planning of radiation therapy.
2.3 Dynamic-Contrast-Enhanced MRI (DCE-MRI, Perfusion Imaging)
DCE-MRI is a functional imaging modality following the intravenous (i.v.) administration of gadolinium-based contrast medium allowing the characterization of pharmacokinetic features reflecting the prostatic vascularization through a series of high temporal resolution axial T1-weighted sequences.
Vascularization and angiogenesis in PCa are mostly induced through the secretion of vascular growth factors in reaction to the presence of local hypoxia or lack of nutrients due to uncontrolled fast growth of malignant cells (Bonekamp and Macura 2008). The resulting changes on a vascular level can be assessed dynamically by DCE-MRI. As the prostate gland is highly vascularized, a simple substraction of images before and after gadolinium administration i.v. is insufficient to properly delineate PCa, and a dynamic imaging series with adequate temporal resolution is required instead to accurately determine the time course of contrast media inflow and washout.
Tumor vessels are generally more permeable and disorganized than normal vessels. Because of the abundance of tumor vessels in PCa and the corresponding vessel walls’ vulnerability and permeability, fast contrast arrival and rapid washout are typically observed (Fig. 3a, b). It has been demonstrated that the presence of washout is highly indicative for PCa (Alonzi et al. 2007), even in the absence of low SI in T2WI.
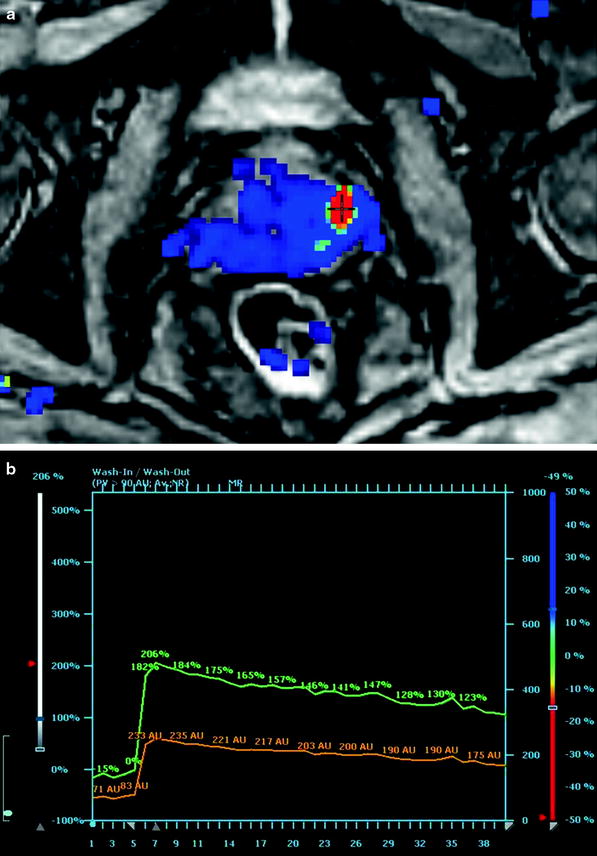
Fig. 3
a Axial high temporal resolution DCE-MRI with a PCa lesion in the left peripheral zone (red spot). b Corresponding enhancement curve with relative (green curve) and absolute (orange curve) depiction of contrast enhancement arrival and consecutive washout
2.4 MR Spectroscopy of Prostate Cancer
2.4.1 1H-MR Spectrum and Metabolite Signals
While the morphologic and functional properties of normal or neoplastic tissue in the prostate gland can be delineated by MR imaging methods, in vivo proton MR spectroscopy (1H-MRS) and spectroscopic imaging (1H-MRSI) investigate its chemical composition noninvasively and thus yield further insight into prostate metabolism and the metabolic alterations caused by cancerous infiltration. Also, metabolic changes in the course of radiotherapy can be monitored, and the response of PCa to treatment may be assessed by MRS and MRSI. Of the metabolites present in the prostate gland, citrate (Cit), creatine/phosphocreatine (Cr), choline-containing compounds (Cho), and polyamines (PA) have sufficiently high tissue concentrations (above 1 mmol/kg) to be detected by MRS at the magnetic field strengths used for in vivo examinations. Cit is produced by oxidative phosphorylation within the citrate cycle and is extensively stored in healthy prostate tissue mainly in bound form as zinc citrate (Costello et al. 2005). It has a 1H-MRS resonance at 2.65 ppm (chemical shift relative to tetramethylsilane as reference) arising from the non-equivalent methylene protons (CH2) which are strongly coupled to form two almost overlapping spin doublets. This leads to a characteristic 4-peak spectral pattern at 3 T with two equally high central peaks spaced by 8 Hz and two smaller “outer” satellites each at 16 Hz distance (corresponding to the J coupling constant of Cit) from the central peaks. However, full resolution of all 4 peaks is achieved in vivo only with excellent magnetic field homogeneity, while in many prostate MRS acquisitions at 3 T, the two central constituents appear as a single broadened peak, which is a general issue at the lower field of 1.5 T. Also, the three methyl resonances of Cho, PA, and Cr covering the spectral range of 3.21–3.03 ppm are often not completely resolved, especially at 1.5 T, and therefore, usually the summed intensity (tChoCr) of all peaks in this frequency range is compared to the total area under the citrate components, yielding a metabolite ratio, e.g. called tChoCr/Cit.
Although being itself a complex overlay of several constituents such as glycerol phosphorylcholine (GPC), phosphorylcholine (PC), acetylcholine (ACho), and free choline, the intensity of the Cho peak centered at 3.21 ppm in the proton spectrum of prostate tissue may serve as a biomarker for the detection of malignant disease, just in analogy to the PSA value, with strongly increased Cho level or ratio Cho/Cit being suspicious for PCa (Cornel et al. 1993). As especially the phospholipids GPC and PC are key components released in cell membrane turnover, extensive cell proliferation as it is found in malignant tumors is often accompanied by a characteristic elevation of the choline peak in the 1H-MR spectrum. Simultaneously, the accumulation of citrate is inhibited in cancerous prostate tissue, and the MRS intensity of the citrate peaks decreases (Costello and Franklin 1997). Therefore, both effects add up to increase the metabolite ratio Cho/Cit. In contrast, the summed area tChoCr under the Cho, PA, and Cr spectral peaks and its ratio to Cit are less sensitive to indicate PCa, because an elevation in choline levels is at least partly counterbalanced by a reduction of Cr and PA in affected tissue. Nevertheless, in cases or at field strengths with insufficient spectral separation of Cho from the adjacent PA and Cr peaks, the tChoCr/Cit ratio may still serve as a suitable marker to discriminate between benign tissue and PCa, with values <0.8 being considered as normal and tChoCr/Cit >1 as highly suspicious for malignant disease. Correspondingly, a Cho/Cit ratio below 0.5 may indicate benign hyperplasia, while Cho/Cit ratio >0.6 suspects PCa, with borderline assignment for values in between (Crehange et al. 2011). However, such thresholds have to be regarded with care as they may vary depending on the used field strength, the scan parameters (mainly TR and TE) of the MRS acquisition sequence, and the achieved spectral peak resolution. Moreover, the metabolite ratios differ between the prostate zones (with normal Cho/Cit being lower in the peripheral zone), and the cutoff values for discrimination between benign tissue and tumor have to be adjusted to the respective location within the gland.
While 1H-MRS has been shown to be rather specific in the detection of PCa (89–91 % specificity), its sensitivity (75–77 %) is still inferior to other modalities (Manenti et al. 2006). One reason for missing a PCa lesion might be a too small or lacking increase of choline in tumors with only moderate cell proliferation, which is possibly associated with a lower Gleason score. Such a correlation between the Gleason score and the Cho levels in MRS has been found in some, but not in all studies (Zakian et al. 2005; Scheenen et al. 2007; Kobus et al. 2011). Also, PCa with focal size less than 1 cm is prone to be missed by MRS due to its limited spatial resolution, resulting in partial volume averaging with healthy tissue and thus yielding metabolite ratios below the chosen malignancy threshold. On the other hand, false-positive findings may be derived from high Cho signal also occurring in prostatitis, or if an intense narrow spectral peak is observed in MR spectra from the posterior parts in the basal region of the prostate, at the choline frequency of 3.2 ppm. This signal can be assigned to GPC contained in the seminal vesicles, and attention has to be paid not to mistake this “normal” GPC peak from seminal fluid with a pathological elevation of choline levels suspecting prostate cancer in that region.
2.4.2 1H-MRS Acquisition and Spatial Localization
The achievable spatial resolution for in vivo prostate MRS is one of the major drawbacks of this technique as the size of a tissue volume from which a proton MR spectrum is obtained by far exceeds the spatial dimensions of all other MR imaging methods and of most other imaging modalities. This is a consequence of the more than 10,000-fold lower tissue concentrations of the 1H metabolites of interest (Cho, Cr, Cit) compared to the water protons used in MR imaging. Moreover, the intense spectral peak of water at 4.7 ppm has to be suppressed by suitable prepulses during MRS acquisition (and additionally by filtering algorithms in MRS postprocessing) to allow reliable quantification of the very small metabolite peaks, even when their chemical shift relative to water is quite large. Also, MRS signals from different molecular groups in lipids may overlay and distort the metabolite peaks, particularly of citrate, if the selected MRS volume partially includes fatty tissue. In localized single-volume (SV) 1H-MRS, the metabolite signals are collected from within a brick-shaped tissue volume interactively placed on localizer MR images, which is selected by combining the excitation and refocusing RF pulses with magnetic field gradients for spatial encoding. This volume selection can be performed either with the point-resolved spectroscopy (PRESS) (Bottomley 1987) or the stimulated echo acquisition mode (STEAM) (Frahm et al. 1989) technique. Although the SNR of the metabolite peaks in the acquired MR spectra can strongly be improved by repeating the excitation of the volume of interest (VOI) and accumulating the MRS data (“signal averaging”), this may lead to unacceptably long measurement times if VOI sizes smaller than 2–3 cm3 are desired, even at higher magnetic fields with their inherently better SNR. Therefore, in MRS of the prostate, SV techniques are not suited for accurate localization of a tumor within the tissue as the required VOI size would extend over a much too large part of the prostate gland. SV-MRS of prostate cancer might thus only be of interest if the tumor site is already known and the time course of progression or response to therapy is to be investigated in consecutive examinations.
2.4.3 MR Spectroscopic Imaging (MRSI)
By application of the MRSI technique (often also called chemical shift imaging (CSI)), a 2D or 3D grid consisting of a multitude of smaller voxels can be used to collect MR spectra from each of these voxels. To achieve this, similar to the principles of MR imaging, slice selection is performed by gradient switching during RF excitation, and additional phase encoding is applied for in-plane localization. In contrast to the MR imaging of water protons, however, it is not possible to use frequency encoding to acquire a complete row of the image following a single excitation, because the different frequency components of the detected MRS signal are already linked to the spectral information on the metabolites of interest. Therefore, phase encoding for two spatial directions (or even three in 3D-MRSI) has to be used, and as a consequence, m × n spin excitations spaced by the repetition time TR have to be performed to acquire the desired matrix of m × n MR spectra from all 2D grid voxels. Fortunately, the SNR in these spectra is not determined by the spin signal only from the corresponding small voxel, but from the total MRSI grid which above all is sampled m × n times and accumulated. In this way, in-plane voxel sizes around 1 cm2 or below can be utilized with sufficient metabolite SNR in 2D-MRSI of the prostate, with typically 10 × 10–16 × 16 voxels over a grid extension of 8–12 cm. Because a field of view (FOV) of this size is completely surrounded by body tissue, back-folding of spin signal from outer structures would happen, like in MR imaging with such a small FOV, if only the 2D phase encoding was used for in-plane volume selection. Therefore, additional PRESS or STEAM localization of a VOI smaller than the margins of the phase-encoded FOV but completely covering the prostate gland has to be applied to avoid artificial signal contribution in the spectra of the MRSI voxels, especially from lipids. Suppression of such “outer volume” signals can also be achieved by multiple regional presaturation bars closely adapted to the individual prostate shape. In most cases, the cranio-caudal size of the prostate is too large to be entirely included in a 2D-MRSI acquisition with a slice thickness of 1–2 cm, and a 3D phase encoding scheme with at least three axial slices has to be used then. Fig. 4 shows an example for the image-guided planning of such a 3D-MRSI acquisition (TR/TE 1200/135 ms) with display of the 10 × 10 × 3 voxel grid (red), the PRESS-localized VOI (green frame), and a selection of spectra (yellow-framed voxels) from the peripheral and from the central zone of the prostate within the VOI. In this examination performed before radiotherapy, a high Cho peak and low Cit level indicating extensive tumorous infiltration are present in the spectra from the posterior region of the prostate, with accentuation in the right glandular lobe and apical. Just as the other techniques of multiparametric MR imaging, also MRS and MRSI of the prostate profit from the signal gain achievable by the use of an endorectal RF coil for signal detection, and its application allows to further decrease the minimum voxel size. While at magnetic fields of 2 T or less, the application of ERCs for prostate MRSI is mandatory, at 3 T the inherently higher MR signal and the stronger sensitivity to susceptibility artifacts caused by the endorectal placement might balance out the advantages of such coils. Therefore, also considering the signal increase gained by recent progress in MR detection sensitivity by digital RF chains and coil development, the sole use of external surface coils will at 3 T supply sufficient SNR and spatial resolution for MRSI, combined with more patient comfort.
 Toxicity and Quality of Life
Treatment of the Pelvic Lymphatics in Patients with High-Risk Prostate Cancer: Pro Radiation
Radiotherapy After Radical Prostatectomy
is Evidence for the Superiority of Protons or Heavy Ions, Contra
Toxicity and Quality of Life
Treatment of the Pelvic Lymphatics in Patients with High-Risk Prostate Cancer: Pro Radiation
Radiotherapy After Radical Prostatectomy
is Evidence for the Superiority of Protons or Heavy Ions, Contra
 of Pelvic Irradiation
 Radiation Therapy for Clinically Localized Prostate Cancer


Related posts:
Toxicity and Quality of Life
Treatment of the Pelvic Lymphatics in Patients with High-Risk Prostate Cancer: Pro Radiation
Radiotherapy After Radical Prostatectomy
is Evidence for the Superiority of Protons or Heavy Ions, Contra
of Pelvic Irradiation
Radiation Therapy for Clinically Localized Prostate Cancer
Stay updated, free articles. Join our Telegram channel
Full access? Get Clinical Tree
