Imaging bone tumors often causes uncertainty, especially outside dedicated sarcoma treatment centers. Conventional radiography remains the backbone of bone tumor diagnostics, but MR imaging has a role. Radiographs are crucial for assessing the tumor matrix and aggressiveness. MR imaging is the best modality for local staging. This article reviews semiological aspects of bone tumors: patient age, tumor localization, pattern of bone destruction/margins, aggressiveness, growth speed, matrix formation, periosteal reaction, cortical involvement, size, and number of lesions. All aspects are discussed in terms of their appearance on radiographs and MR imaging, with a focus on the correlation between the 2 modalities.
Key points
- •
The imaging of bone tumors often causes uncertainty, especially outside dedicated sarcoma treatment centers.
- •
To make the correct diagnosis, a systematic approach that addresses all semiological aspects is necessary.
- •
Conventional radiography is still the backbone of bone tumor diagnostics, but MR imaging also has its role.
- •
Although radiographs are crucial for assessing the tumor matrix and aggressiveness, MR imaging is the best modality for local staging.
Bone tumors represent a pathologic entity that can cause debates and uncertainty when considering correct diagnosis and treatment, especially outside dedicated sarcoma treatment centers. Although primary malignant bone tumors are relatively rare in Europe and the United States, it is important to correctly raise the suspicion if necessary and to refer to a dedicated sarcoma treatment center, if not diagnose them accurately. Therefore, the European Society of Musculoskeletal Radiology has recently published a consensus to better guide radiologists and clinicians in evaluating bone as well as soft tissue tumors.
During the last decades, the role of Computed tomography (CT) and MR imaging in making the correct diagnosis has become much more important, being now the core of residency training. Furthermore, new advanced imaging methods such as diffusion-weighted imaging, dynamic contrast enhanced MR imaging, and Dixon-type techniques have become important elements in the systemic approach to bone tumors. This led to a decrease in teaching about conventional radiographs in the training of radiology residents. However, the conventional bone radiograph remains the key method in diagnosing bone tumors, especially because it provides critical information on the aggressiveness and matrix formation of the tumor. Of note, not all semiological aspects can be observed on MR imaging in every case, often owing to marrow and soft tissue edema caused by the high aggressiveness of the tumor, further strengthening the idea that both MR imaging and radiographs (or CT) are required for an accurate diagnosis. Residents should learn to never make a diagnosis of a bone tumor solely on MR imaging without having a conventional radiograph available and MR imaging alone can cause confusion. However, MR imaging is required for local staging as well as for detecting vessel, nerve and joint infiltration and for extracompartimental spread, features that cannot be detected accurately by radiographs.
This article reviews basic bone tumor semiology, highlighting their aspects on both standard radiographs and MR imaging, pointing out each technique’s advantages and disadvantages. It will help the radiologist to better recognize and understand the semiology of bone tumors. Particularly, the following aspects of bone tumors will be discussed: patient age, tumor localization, pattern of bone destruction/margins, matrix, periosteal reaction (PR), cortical involvement, size, and number.
Patient age, tumor localization, and lesion size and number
Before characterizing a lesion, a few basic elements that should be taken into consideration to shorten the differential diagnosis list. First, patient age is extremely important. With a few exceptions, most bone tumors have a predilection for a specific age group. For example, Ewing’s sarcoma is most frequent in 10- to 20-year -old patients; a patient older than 40 years with a similar lesion is more likely to have a metastatic lesion or multiple myeloma. Another rule of thumb is that a spinal lesion in patients under 30 is more likely to be benign, with the rare exceptions of Ewing’s sarcoma and osteosarcoma. Table 1 depicts the general distribution of aggressive versus nonaggressive bone tumors.
| Age (y) | Aggressive | Nonaggressive |
|---|---|---|
| 0–10 | Eosinophilic granuloma, Ewing’s sarcoma, hematologic malignancies, neuroblastoma | Aneurysmal bone cyst, eosinophilic granuloma, simple bone cyst |
| 10–20 | Adamantinoma, Ewing’s sarcoma, giant cell tumor, osteosarcoma | Adamantinoma, aneurysmal bone cyst, chondroblastoma, chondromyxoid fibroma, fibrous dysplasia, nonossifying fibroma, osteochondroma, simple bone cyst |
| 20–40 | Chondrosarcoma, periosteal osteosarcoma, pleomorphic sarcoma | Enchondroma, giant cell tumor |
| >40 | Chondrosarcoma, chordoma, lymphoma, metastases, multiple myeloma, osteosarcoma (Paget’s associated), plasmacytoma, pleomorphic sarcoma | Geode or subchondral cyst, intraosseous ganglion |
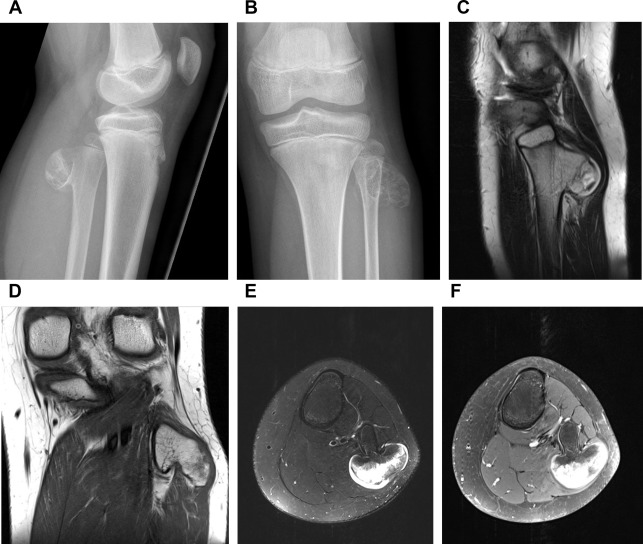
Tumor localization is also crucial. Most lesions have a higher incidence in the long bones of the limbs, although some are located more frequently the spine or pelvis (osteoid osteoma, lymphoma, chondrosarcoma, Ewing’s sarcoma, myeloma). Within the long bones, most tumors have predilection for the either diaphysis, metaphysis, or epiphysis ( Table 2 ). The size of a tumor cannot reliably predict the malignancy, although lesions with a size over 6 cm are most likely malignant. The criterion on size also differentiates between osteoid osteoma and osteoblastoma: there are several thresholds suggested, with 1.5 cm being the most common. Furthermore, when differentiating between an enchondroma and chondrosarcoma, a lesion smaller than 2 cm is likely to be an enchondroma and a lesion of more than 5 to 6 cm is more often a chondrosarcoma. In osteochondromas, the size of the cartilage cap is suggestive of malignant degeneration, with a suggested threshold of greater than 1.5 cm ( Fig. 1 ). Furthermore, lesions that grow over time and lesions located next to the spine and pelvis require special focus owing to the risk of malignancy and/or complications. Regarding the number of lesions, it is well-known that most bone tumors are solitary lesions. In children, multifocal lesions are associated with leukemia, eosinophilic granuloma (circumscribed form of Langerhans cell histiocytosis), or metastases. In adults, multifocal osteolytic disease usually means metastases or multiple myeloma. Important exceptions are enchondromatosis and fibrous dysplasia.
| Age (y) | Diaphysis | Metaphysis | Epiphysis |
|---|---|---|---|
| <20 | Adamantinoma, eosinophilic granuloma, Ewing’s sarcoma, fibrous dysplasia, lymphoma, osteoid osteoma | Aneurysmal bone cyst, chondromyxoid fibroma, enchondroma, nonossifying fibroma, osteochondroma, osteosarcoma, simple bone cyst | Chondroblastoma, infection |
| 20–40 | Adamantinoma, eosinophilic granuloma, Ewing’s sarcoma, fibrous dysplasia, lymphoma, osteoid osteoma | Enchondroma, giant cell tumor, nonossifying fibroma, osteochondroma, osteosarcoma, | Giant cell tumor, osteosarcoma |
| >40 | Fibrous dysplasia, metastases, myeloma | Lymphoma, metastases, myeloma, osteochondroma | Clear cell chondrosarcoma, Paget’s disease, subchondral cyst |
Margins and pattern of bone destruction
The Lodwick-Madewell classification remains very useful to determine the biologic activity of a tumor by assessing the bone response on a radiograph. Because bone response is slow, a slow-growing lesion will give the bone enough time to create solid osseous tissue around the lesion. In contrast, a fast-growing lesion will cause a more disorganized response. The Lodwick-Madewell classification refers to lytic lesions and divides them into 5 subtypes: type IA (geographic with sclerotic margins), type IB (geographic without sclerotic margins), type IC (geographic with poorly defined margins), moth-eaten (type II), and permeative (type III) ( Fig. 2 ).

In other words, a nonaggressive lesion presents a narrow zone of transition leaves the cortex intact and has a nonaggressive or absent PR. In contrast, an aggressive lesion results in a wide zone of transition with cortical destruction and aggressive PR. Furthermore, a nonaggressive lesion usually has a geographic pattern with sclerotic rim and no soft tissue extension, whereas an aggressive lesion can have ill-defined margins, permeative destruction, and soft tissue masses. Exceptions in which benign lesions can present aggressively are aneurysmal bone cysts (ABC), aggressive hemangiomas and Langerhans cell histiocytosis (eosinophilic granuloma).
Type IA is assigned to geographic well-defined lesions with sclerotic margins. It is typical for a slowly or nongrowing lesion such as nonossifying fibroma, simple bone cyst, fibrous dysplasia, intraosseous ganglion, or lipoma ( Fig. 3 ). The sclerotic margin appears as a rim of signal void on both T1- and T2-weighted sequences. In contrast, clear cell chondrosarcomas, malignant fibrous histiocytomas, or Ewing’s sarcomas may have sclerotic margins. A statement should be made about the inner and outer margins of the sclerotic rim: clear-cut inner and ill-defined outer margins are usually found in osteomyelitis, eosinophilic granuloma, and avascular necrosis, whereas clear-cut inner and outer sclerotic rim borders are observed in osteomyelitis, benign tumors and occasionally in slow-growing malignant tumors, and tumor-like lesions. Furthermore, mottled sclerosis can be seen in both malignant and benign lesions.

A type IB lesion is geographic and well-defined, but without a sclerotic margin. On a radiograph, type IB lesions are better detected in areas with cancellous bone. In the diaphysis, sometimes endosteal scalloping is the only sign of the existence of a type IB lesion. Usually, type IB lesions are cartilaginous or fibrous. Common benign examples are giant cell tumor (GCT), enchondroma, eosinophilic granuloma, and fibrous dysplasia, although multiple myeloma and some low-grade sarcomas are included in this category.
A type IC lesion is still geographic, but with indistinct margins which suggest infiltration and increased activity. Examples include GCT, enchondroma, metastasis, and sarcoma.
A type II lesion has a moth-eaten pattern and represents an increased aggressiveness. It is defined by multiple ovoid areas parallel to the long axis of the bone, with a diameter of 2 to 5 mm. Type II lesions usually infiltrate rapidly and lead to an indistinct endosteal scalloping. Typical examples of this category include metastasis, multiple myeloma, osteosarcoma, chondrosarcoma, and lymphoma.
The type III pattern, also called permeative, is the most aggressive subtype. It is represented by multiple ill-defined oval lesions, with a wide zone of transition, cortical destruction, and a soft tissue mass. It is frequently seen in malignant conditions such as metastasis, multiple myeloma, lymphoma, Ewing’s sarcoma, osteosarcoma, and high-grade chondrosarcoma.
The shape of the margin can also provide additional information, thereby shortening the differential diagnosis list. For example, a lobulated contour can be seen in malignant conditions, such as chondrosarcoma, chordoma, or adamantinoma, as well as benign lesions such as large enchondromas, chondroblastomas, and chondromyxoid fibromas ( Figs. 4 and 5 ).


Regarding the MR sequences to use when evaluating tumor margins within the bone and fatty bone marrow replacement, most authors agree that unenhanced T1-weighted sequences are most suitable, with no clinically significant underestimation or overestimation (like in the case of short-tau inversion recovery and T1-weighted fat-saturated images). Within the muscles, contrast-enhanced T1-weighted fat-saturated or fluid-sensitive fat-saturated sequences are to be preferred to assess tumor margins. Furthermore, some investigators suggest to use postgadolinium sequences to assess joint involvement and T1-weighted and short-tau inversion recovery imaging for examining epiphyseal involvement. It has also been shown that intraoperative MR imaging is adequate for guiding resection and can provide rapid information regarding tumor resection margins before the end of the surgery or help the pathologist focus on uncertain areas.
Tumor matrix
Traditionally, on a conventional radiograph, a tumor can be described as lytic or sclerotic, with lytic lesions to become only evident on radiographs when there is a minimum of about 30% lysis. MR imaging can also provide useful information when characterizing a lesion. In some cases, it can directly diagnose certain lesions such as ABC or intraosseous lipoma. Furthermore, MR imaging is useful in detecting medullary lesions and soft tissue extension. It is important to note that an MR imaging protocol for sarcomas must include sequences with a large field of view to evaluate the entire bone longitudinally to detect skip lesions. Postgadolinium sequences are useful for evaluating the soft tissue mass and for differentiating necrosis and hemorrhage. CT is preferred over MR imaging for characterizing subtle mineralization or cortical involvement.
With a few exceptions, bone tumors have an osteoid, a chondroid, or a fibrous matrix, which refers to the acellular material produced by the tumor cells. However, there is a significant overlap and therefore more semiological aspects need to be taken into consideration when making a diagnosis.
Most musculoskeletal tumors are hyperintense on T2-weighted sequences, but there are exceptions. Dense osteoblastic lesions appear hypointense on T1- and T2-weighted sequences. They include osteoid osteoma, osteoblastoma, osteoblastic metastasis, lymphoma. and osteosarcoma. On a radiograph, an osseous matrix appears dense and cloud-like. It is important to note that, in the case of a mixed lesion such as osteosarcoma, the mineralized part is hypointense on T1- and T2-weighted MR imaging, while the lytic part is hypointense on T1-weighted sequences and hyperintense on T2-weighted sequences. A chondroid matrix is usually hypointense in T1-weighted and hyperintense in T2-weighted sequences owing to an increased amount of water in the tumor (see Figs. 4 and 5 ). Postcontrast images depict a pattern of enhancing rings and arcs. Cartilage-forming tumors include both malignant and benign lesions, such as osteochondroma, chondroblastoma, chondrosarcoma, and chordoma. Finally, a fibrous matrix is not specific on MR imaging; it has an intermediate T1 signal and a variable T2 signal. It is, however, easily observed on CT, where it typically has a ground-glass appearance owing to a mixture of collagen fibers and bone.
Examining the calcification pattern, which appear as foci of signal void on MR imaging, can also provide clues. Chondrogenic calcifications appear as punctate comma-like, ring-like, or annular foci of signal void (see Fig. 4 ). They are seen in enchondromas and chondrosarcomas, but can also be seen in chondromas with an amorphous and unspecific aspect. A lipoma, however, may have central dystrophic calcifications owing to fat necrosis. Punctate or linear calcifications can also be seen in focal osteonecrosis, at the interface between healthy and necrotic bone, but with a serpiginous pattern.
Similar to calcifications, trabeculations may also help. They are either the formation of new bone or residual trabeculae. A thick and coarse pattern may be seen in chondromyxoid fibroma or desmoplastic fibroma, thin/delicate in GCT, lobulated in nonossifying fibroma, striated/radiating in hemangioma, and horizontal in ABC ( Fig. 6 ).