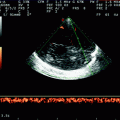
Fig. 9.1
In (a) it is possible to see an application of the virtual navigator method with the achievement of a full correspondence between anatomical TCCS and MRI as regards the parenchymal and bony landmarks of the mesencephalic plan. (b) Highlights the anatomical landmarks known to facilitate the interpretation and identification of the correspondences. On the top left of the screenshot TCCS is shown in the axial scan from the temporal window on the mesencephalic plan. At the front, the olfactory conduits are emphasized; they are located in the paramedian position below the hyperechogenicity of the small wing of the sphenoid bone (red arrow). This bony landmark is the identification reference of the middle cerebral artery, whose parietal interface is easily identifiable (yellow arrows, with the corresponding location on MRI). The contralateral skull is outlined in green, both on the TCCS and on MRI. The contour of the mesencephalon in section is instead outlined in blue on the two images. A red ring indicates the occipital pole contralateral to the site of insonation, while a blue ring marks the hyperechogenicity of the falx cerebri and the corresponding location of the falx on the axial MRI image. In the lower part of the screenshot, the reconstructed volume of RMN stands out, with the virtual scan plane corresponding to the ultrasonic one
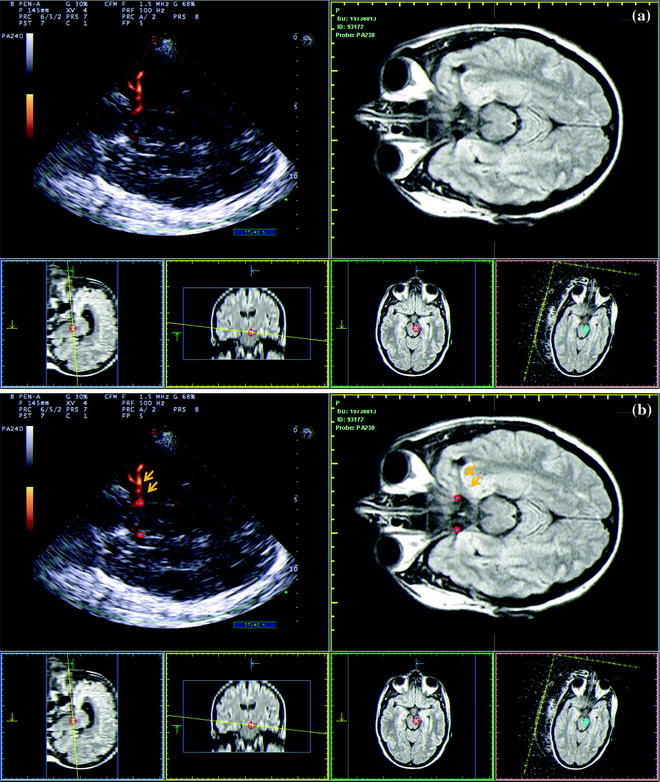
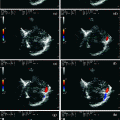
Fig. 9.2
a, b In the same way as in Fig. 9.1, this image confirms the correct identification of the middle cerebral artery course through the hyperechoic interface as the parallel track of its wall in the subarachnoid space (yellow arrows in b). The outflow of the internal carotid artery that forks into the MCA and the ACA (red ring) is also highlighted
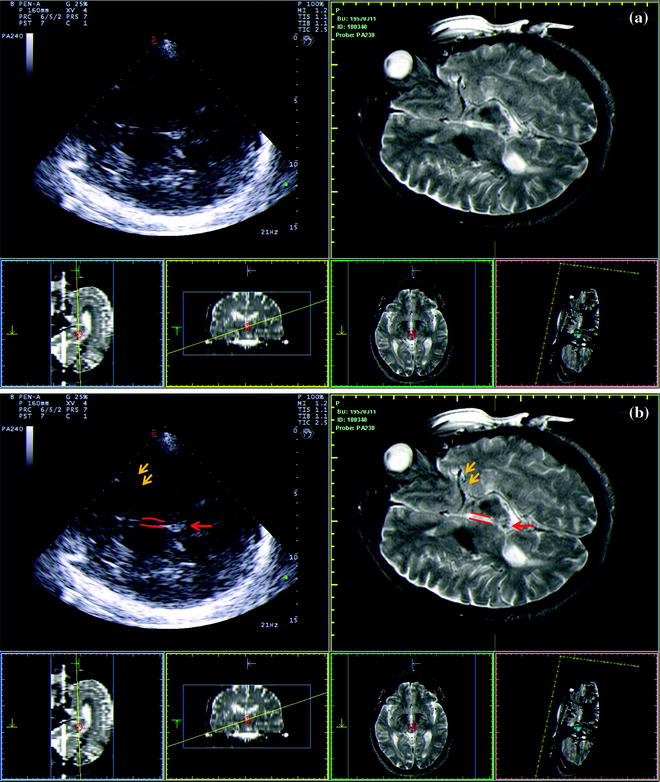
Fig. 9.3
In (a), it is possible to see an application of the virtual navigator method with the achievement of a full correspondence between anatomical TCCS and NMR as regards the parenchymal and bony landmarks of the diencephalic plan. In (b), the anatomical landmarks known to facilitate interpretation and identification of correspondences are highlighted. At the top of the screen to the left, TCCS in the axial scan from the temporal window on the diencephalic plan is shown. The parallel track image of the third ventricle, limited at the back from the hyperechogenicity of the epiphysis, is evident in the midline. The thalamus and caudate–lenticular complex are located close to the third ventricle. It is possible to see the parietal interface of the distal M1 segment and of M1-M2 transition of the MCA. (b) The same structures are evident, but they are outlined for an easy identification both in the ultrasound scan and in the oblique MRI brain image. The third ventricle is outlined in red, the epiphysis is indicated by a red arrow, and the interface of the MCA walls is marked with yellow arrows
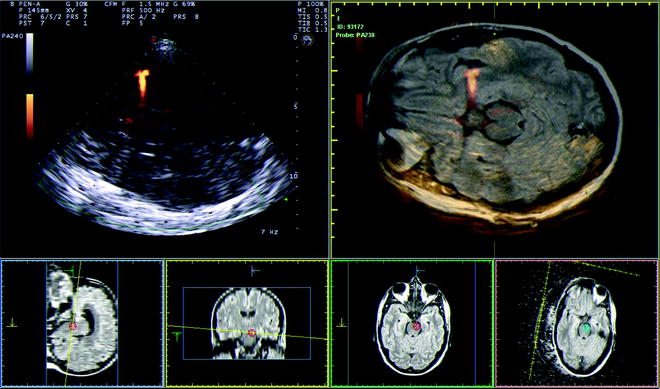
Fig. 9.4
On the screen, the precise overlap between the ultrasound and the corresponding MRI image of the mesencephalic plane is highlighted; MCA is displayed in power mode. In particular, note the course of the MCA that goes to the subarachnoid space, the contralateral skull which perfectly surrounds the contralateral temporal lobe, and the mesencephalic echoic profile that perfectly fits the MRI one
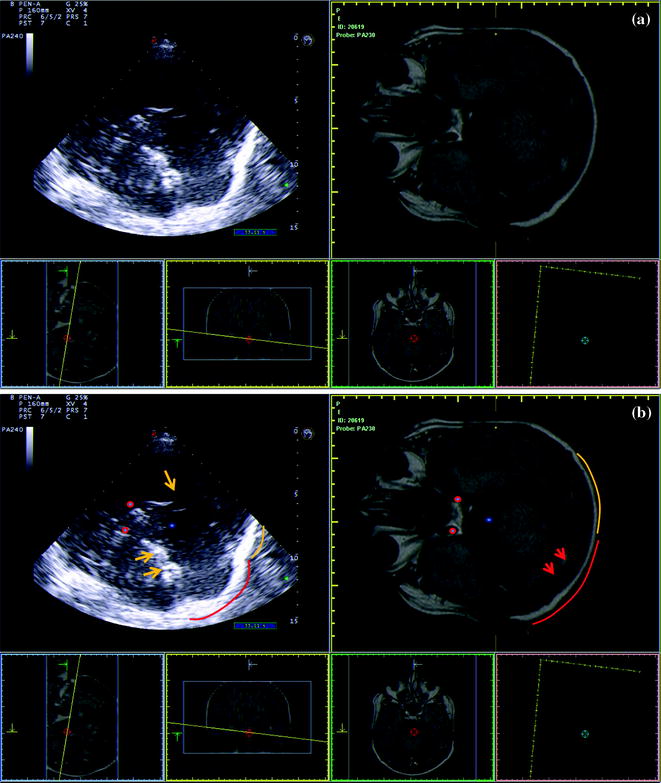
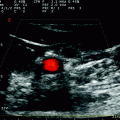
Fig. 9.5
(a) shows a further approach, with the comparison with the corresponding oblique MRI plane. It is useful for the parenchymal study but in particular for the study of the ipsilateral TS, i.e., the approach with access to the posterior fossa. In fact, the ultrasound image appears more oblique, with the display of both the ipsilateral and contralateral occipital skull at the level of the conduit course of the TS. The bony border landmarks of the posterior cranial fossa stand out: They are the contralateral and ipsilateral (only the medial segment) edge of the petrosal bone. The parenchymal access is pontine, as may be seen by MRI, and the horizontal part of the ICA is well detectable. In (b), the most important identifiable structures are well detailed and labeled to make them easier to be recognized. The ipsilateral occipital skull is shown in yellow, the contralateral skull is shown in red, and the conduit course of the TS is indicated by red arrows in the MRI. The contralateral and ipsilateral edge of the petrosal bone is indicated by yellow arrows, while the pons is marked by a blue ring and the horizontal part of the ICA by a red ring. In this case, it is clearly evident how the application of the imaging fusion technology allows the exploration of unusual approaches for the study of the brain parenchyma and vessels. In this way, the possibility of insonation of some structures is generally improved and the anatomy ultrasound finds a perfect match in a virtual plan equivalent to neuroradiological imaging, which is usually not explored. This approach also allows the examiner to acquire more familiarity with the ultrasound anatomy and therefore to improve the accuracy of insonation also when not using the virtual navigation system
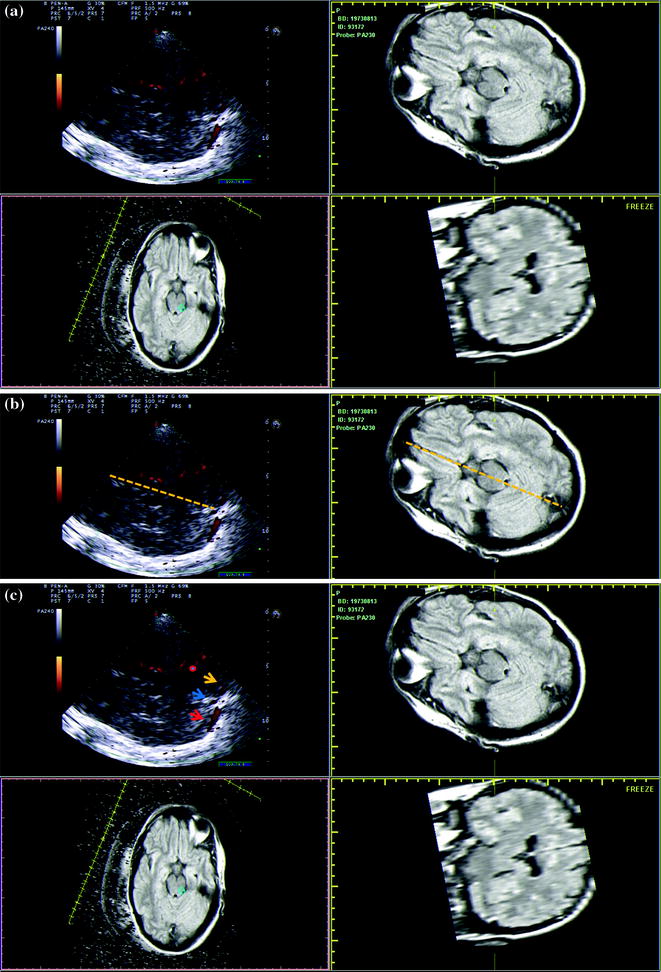
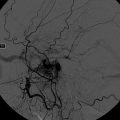
Fig. 9.6


a, b, and c Oblique scan on the mesencephalic medium plane, with back angle (as evidenced by the angled position of the midline in (b). The third sector of this picture on the left highlights the upper portion of the posterior fossa, in power mode and Doppler mode, with the confluence of sinuses, the contralateral and ipsilateral TS, the mesencephalon in the middle third sector of the picture, with the venous structures “as a bridge” between the posterior fossa and the middle cranial fossa, the basal portion of the frontal lobes in the anterior third sector of the picture. In such a position, only the most basal portion of the polygon of Willis is insonable and in particular P1 and P2 PCA around the midbrain and the MCA origin. In (b), these anatomical structures are evidenced to make it easier to locate them; the red arrow indicates the contralateral TS, the yellow arrow marks the ipsilateral TS, the blue arrow shows the confluence of sinuses, while the red circle highlights the venous structures which are situated as a bridge between the posterior and the media cranial fossa
Related posts:
Stay updated, free articles. Join our Telegram channel
Full access? Get Clinical Tree
