Fig. 13.1
Regions of significantly changed rCBF during spatial discrimination tasks in (a) a placebo group compared with results from a fixation task and (b, c) a d-chlorpheniramine-treated group compared with a placebo group. Brodmann’s area (BA): supramarginal gyrus (BA40). Reprinted by permission of John Wiley & Sons Ltd from Mochizuki et al. 2002, Plate 1
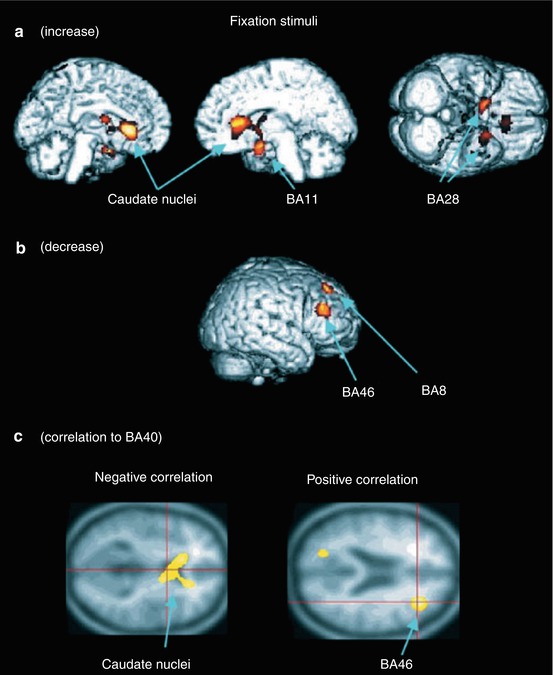
Fig. 13.2
Regions of significantly changed rCBF during fixation tests in a d-chlorpheniramine-treated group compared with a placebo group. (a) Increased rCBF in caudate nuclei, orbitofrontal cortex and temporal poles, and (b) decreased rCBF in prefrontal and dorsolateral prefrontal cortex. (c) Negative (left) and positive (right) correlation of caudate nuclei and dorsolateral prefrontal cortex to the activities of parietal cortex, respectively. Brodmann’s areas (BA): frontal eye fields (BA8), orbitofrontal cortex (BA11), ventral entorhinal cortex (BA28), supramarginal gyrus (BA40), dorsolateral prefrontal cortex (BA46). Reprinted by permission of John Wiley & Sons Ltd from Mochizuki et al. 2002, Plate 2
These results have been confirmed by rCBF measurements during simulated car driving tests (Tashiro et al. 2008c). After application of d-chlorpheniramine, “driving” caused decreased change in perfusion (ΔrCBF, active driving vs. resting) in temporal, parietal and occipital cortices as well as cerebellum, compared to placebo-treated subjects, and enhanced activity in orbitofrontal cortex and cerebellar vermis (Fig. 13.3). The latter, signalling an attempt to optimize motor output based on visual inputs, again is considered as an indication of compensation of the disturbed visuospatial cognition and visuomotor coordination in the cortical areas. Altogether these findings overlap with results of specific H1R binding and occupancy studies following administration of antihistamines (Sect. 13.3).
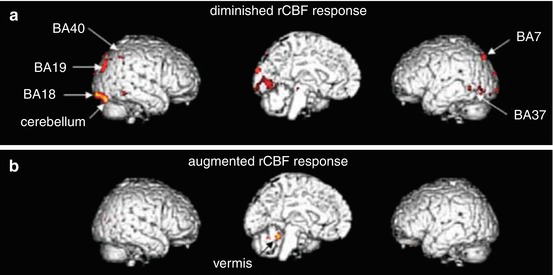
Fig. 13.3
Brain regions with altered rCBF responses ((a) diminished and (b) increased) in simulated car driving tests following d-chlorpheniramine treatment, superimposed onto standard MRI-rendered images. Brodmann’s areas (BA): somatosensory association cortex (BA7), secondary (BA18) and associative visual cortex (BA19), fusiform (BA37) and supramarginal gyrus (BA40). Reprinted by permission of John Wiley & Sons Ltd from Tashiro et al. 2008c, Figure 4
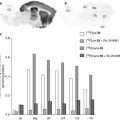
Furthermore, [18F]FDG PET has been used to investigate the involvement of histaminergic signalling in energy regulation and metabolism (Wang et al. 2010). Wild-type (WT), H1R (H1R−/−) and H2R knockout mice (H2R−/−) were fed normal (NcD) as well as high-cholesterol (HcD) diets. Quantification by PET and after organ dissection revealed that only in the brains of NcD- and HcD-fed H1R−/− mice [18F]FDG uptake levels increased significantly (for HcD-fed mice see Fig. 13.4). This was accompanied and is assumed to be caused by increased leptin and glucose transporter type 4 expression in this knockout type and points to regulation of glucose allocation by the interaction of leptin and histaminergic neurons. H2R−/− mice showed only a significant increase of [18F]FDG uptake in skeletal muscle tissue.
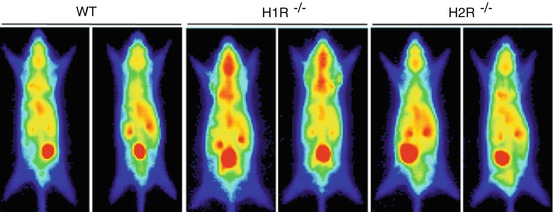
Fig. 13.4
Representative planar PET images, showing increased [18F]FDG uptake in H1R−/− mice brain after high-cholesterol feeding. Reprinted by permission of Elsevier Ltd from Wang et al. 2010, Figure 3
Unfortunately, results for biodistribution of [18F]FDG in HcD-fed normal mice, determinded ex vivo, are not reported in this study. However, together with the development of an obese and visceral adipose phenotype with hyperleptinemia in H1R−/−, and according to the known neurobiological functions of histamine (Masaki and Yoshimatsu 2006, 2010), the results of Wang et al. (2010) emphasize a regulatory role of H1R in feeding rhythms and energy metabolism.
Histamine H3 and H4 receptors are via their Gαi/o proteins negatively coupled to adenylate cyclase (AC) (Bongers et al. 2010) and play a part in the regulation of cyclic adenosine monophosphate (cAMP). This intracellular acting second-messenger molecule in turn is hydrolysed and so deactivated by phosphodiesterases (PDEs). Apart from studying effects of other neuroligands, Lourenco et al. followed this pathway in rats treated with the H3R/H4R antagonist/inverse agonist thioperamide by measuring the biodistribution of (R)-[11C]rolipram, a selective PDE4 inhibitor. Predosing with thioperamide (≥10 mg/kg) significantly increased specific radioligand binding in the brain in a dose-dependent manner (Lourenco et al. 2006).
The authors explained this result by the H3R antagonistic and histamine synthesis stimulating action of thioperamide (Gomez-Ramirez et al. 2002). However, inhibition of the presynaptic autoreceptor H3R would increase histamine levels (Knigge et al. 1998; Leurs et al. 2005), thus increasing postsynaptic histamine receptor activity and decreasing cAMP concentrations. This, in turn, would cause diminished PDE4 expression and radioligand binding. It seems more likely that the increased (R)-[11C]rolipram binding was due to the later discovered high affinity and antagonistic/inverse agonistic action of thioperamide to the postsynaptic H4R (Lim et al. 2005; Schnell et al. 2011). Inhibition of H4R would cause an elevation of cAMP (Leurs et al. 2009; Thurmond et al. 2008) and thus PDE4 activity.
In summary, the few indirect imaging studies mentioned indicate the necessity for further studies of histamine receptors. This is needed to determine the role and relevance of histaminergic neurotransmission in normal physiological processes as well as in pathological conditions.
13.3 Imaging of the Histamine H1 Receptor
Already at the end of the 1980s, two carbon-11-labelled ligands for imaging H1R in vivo were reported: the pyridinyl-diamine [11C]pyrilamine, also known as [11C]mepyramine (Fig. 13.5), and the dibenzooxepinyl-amine [11C]doxepin. Their nonradioactive analogues showed affinity for dog H1R with inhibition constants (K i) of ~11.7 and 2.8 nM, respectively (Yanai et al. 1990a). For human H1R equilibrium dissociation constants (K d) of 3.3 nM for pyrilamine and 0.17 nM for doxepin were determined (Cusack et al. 1994).
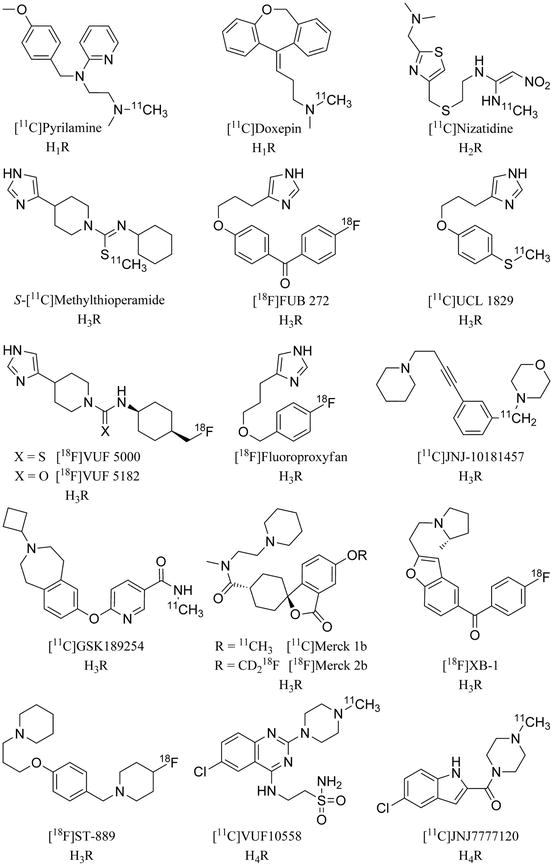
Fig. 13.5
Histamine receptor subtype-specific PET ligands
Both radioligands can be prepared by N-[11C]methylation of the corresponding desmethyl-precursors. Depending on the approach, in about 20 min, nor-pyrilamine was converted with [11C]methyl iodide to [11C]pyrilamine in a decay-corrected radiochemical yield (RCY) of up to 34 %, a radiochemical purity (RCP) >99 % and a specific activity of up to 93 GBq/μmol (Dannals et al. 1989; Iwata et al. 1991; Yanai et al. 1988). Radiosynthesis of [11C]doxepin has been accomplished by substitution of nor-doxepin with [11C]methyl iodide (Cai et al. 2012; Dannals et al. 1989; Iwata et al. 1992; Ravert et al. 1992) as well as [11C]methyl triflate. Nowadays, within about 40 min, automated preparation procedures approach RCYs of ~47 %, an RCP >97.5 % and a specific activity of ~45 GBq/μmol starting from [11C]CH3I (Cai et al. 2012). Starting from [11C]CH3OTf, an RCY >40 %, an RCP >99 % and a specific activity of around 100 GBq/μmol can be obtained within the same time (Ishiwata et al. 2004; Iwata et al. 2002; Mochizuki et al. 2004a; Yoshizawa et al. 2009).
In biodistribution studies [11C]pyrilamine showed a brain uptake in mouse of ~5 % injected dose per gram of tissue (%ID/g) at 5 min p.i. but also fast clearance to ≤0.5 % at 60 min p.i (Yanai et al. 1989). At 30 min p.i. the highest regional uptake was observed in hypothalamus, hippocampus, cortex and striatum with a ratio to cerebellum of 2, 1.8, 1.5 and 1.3, respectively (Yanai et al. 1988, 1989). [11C]pyrilamine binding was specific, as demonstrated by [3H]pyrilamine saturation experiments. Further, [11C]pyrilamine accumulation was blocked significantly by co-administration of the H1R antagonist triprolidine (Yanai et al. 1988). Unfortunately, the latter was illustrated only by a reduced hypothalamus to cerebellum ratio from 1.4 to 1.2 at 15 min after application of the radioligand, and the dose of the inhibitor was not specified.
A decade later the first metabolism studies were undertaken, determining arterial plasma free and protein-bound fractions, parent compound and radiolabelled metabolite fractions for both [11C]pyrilamine and [11C]doxepin (Ishiwata et al. 1996). In healthy volunteers [11C]pyrilamine showed low plasma protein binding. Correlating with that, rapid metabolism was observed, with only ~34 % of total plasma radioactivity corresponding with unchanged radiotracer at 15 min p.i. [11C]Doxepin remained more stable with ~78 % of parent compound at 15 min p.i., whereof ~74 % were bound to plasma proteins. The latter seems to protect the radioligand from degradation, and the constant ratio of ~0.35 of unbound to bound plasma [11C]doxepin appears to provide sufficient bioavailability for radioligand uptake and imaging of H1R in the brain. In epileptic patients, medicated with anticonvulsants, the same free fraction in plasma was observed, but with only ~67 % of parent radioligand at 15 min p.i., suggesting an increase in [11C]doxepin degradation (Ishiwata et al. 1996). This is supposed to be caused by elevated levels of hepatic microsomal metabolizing enzymes, such as cytochrome P450 (Anderson 2004; Spina and de Leon 2007), an issue that needs to be taken into account when scanning patients, especially if they are on medication.
Further it was investigated whether [11C]pyrilamine metabolism had any effect on PET measurements in the brain (Kim et al. 1999). The amount of radiometabolites entering in human brain was inferred from rat brain homogenate analyses after [11C]pyrilamine as well as radiometabolite administration. Injection of rat plasma containing 70–100 % metabolized [11C]pyrilamine in rats revealed an initial brain uptake of <0.3 %ID/g for the radiometabolites at 5 min p.i. Extrapolating from that and human plasma metabolite analyses, only 1.8 % of the total radioactivity would correspond to radiometabolites in human brain at the time point of [11C]pyrilamine peak uptake, even after an administration of 100 % metabolized radiotracer. Therefore no impact on PET imaging results was expected.
First visualization of H1R by PET was performed in beagle dog brain using both [11C]pyrilamine and [11C]doxepin (Fig. 13.6) (Yanai et al. 1990a). Both radioligands showed suitable uptake (≥2 %ID/100 mL at 15 min p.i.). Successful blockade as well as displacement was observed after administration of 1 mg/kg triprolidine. The regional distribution of radiotracer uptake corresponded with the known expression of H1R in various brain structures, being highest in cerebral cortex and olfactory bulb, and lowest in cerebellum. Of the two ligands, [11C]doxepin showed the best imaging characteristics, as the images were higher in contrast (Fig. 13.6b), and the distribution remained constant during the scan.
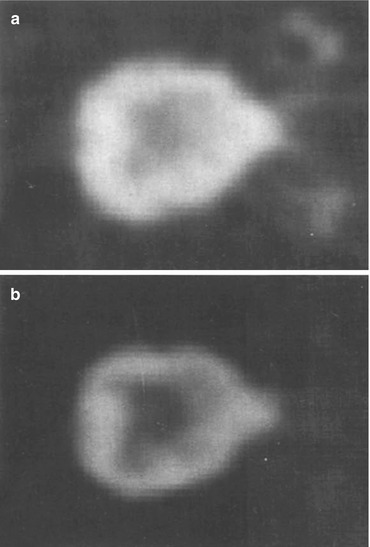
Fig. 13.6
Transaxial PET images of dog brain, showing the distribution of (a) [11C]pyrilamine and (b) [11C]doxepin at 40–45 min p.i. Reprinted by permission of Elsevier Ltd from Yanai et al. 1990a, Figure 1
Nevertheless, [11C]pyrilamine was applied in various PET investigations of baboons and healthy human brain (Villemagne et al. 1991; Yanai et al. 1991). In baboon (Fig. 13.7), ~7 %ID/L peak uptake of [11C]pyrilamine occurred at 20 min p.i. and decreased to ~6 %ID/L at 70 min p.i. in frontal cortex. This uptake was reduced by 33 % after pre-administration of 1 mg/kg of the antihistamine diphenhydramine and by 40 % after both 1 mg/kg and 5 mg/kg co-injected pyrilamine (Villemagne et al. 1991), suggesting that already 1 mg/kg of pyrilamine saturated the specific binding of the ligand (Quach et al. 1980; Yanai et al. 1988). In contrast to earlier studies, in baboon high [11C]pyrilamine uptake was also observed in cerebellum with ~7.5 %ID/L at 20 min p.i. and ~6 %ID/L at 70 min p.i. Displacement with diphenhydramine and pyrilamine reduced this cerebellar uptake by 23 and 30 %, respectively.
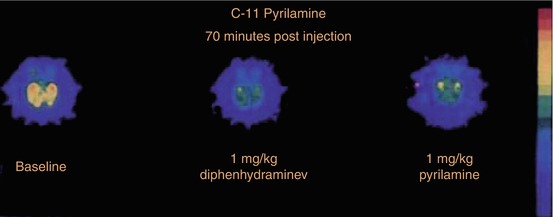
Fig. 13.7
Transaxial PET images from the lower hemisphere of baboon brains about 70 min p.i., demonstrating [11C]pyrilamine distribution without (left) and after inhibition by pretreatment with 1 mg/kg diphenhydramine (middle) and co-injection of 1 mg/kg pyrilamine (right). Reprinted by permission of SNMMI from Villemagne et al. 1991, Figure 2
In human brain (Fig. 13.8), peak uptake of [11C]pyrilamine occurred somewhat earlier with around 3 %ID/L at 10–15 min p.i. in frontal cortex and cerebellum, and with a more rapid dissociation than in baboon. The displacement with 0.7 mg/kg of diphenhydramine (administered at 45 min p.i.) caused a slightly increased clearance of the radioligand, most notably in frontal cortex (around 1.5 %ID/L at 70 min p.i.) but also in cerebellum.
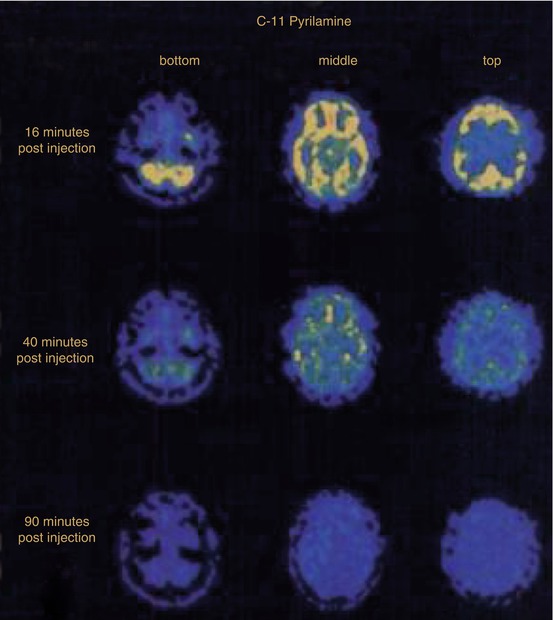
Fig. 13.8
Transversal PET images from a [11C]pyrilamine study in healthy human brain at 16 min (top), 40 min (middle) and 90 min (bottom) p.i. of the radioligand, the latter including the administration of 0.7 mg/kg diphenhydramine at 45 min p.i. Reprinted by permission of SNMMI from Villemagne et al. 1991, Figure 5
More conclusive results were obtained in a study in healthy male volunteers (Yanai et al. 1992b). [11C]pyrilamine peak uptake at ~15 min p.i. was highest in thalamus and frontal as well as temporal cortex (Fig. 13.9, left) with ~8 and ~7 %ID/L, respectively, and lowest in striatum and cerebellum, both with ~6 %ID/L. Preadministered antihistamine d-chlorpheniramine (5 mg i.v.) induced increased initial uptake but also radioligand washout in cortices and thalamus (Fig. 13.9, right), which was only significant for the cortical regions (e.g. ~5.5 reduced to 4 %ID/L at 45 min p.i.). Investigated in parallel, [3H]pyrilamine binding on autopsy material revealed highest specific binding in cortex and highest nonspecific binding in thalamus (Yanai et al. 1992a, b).
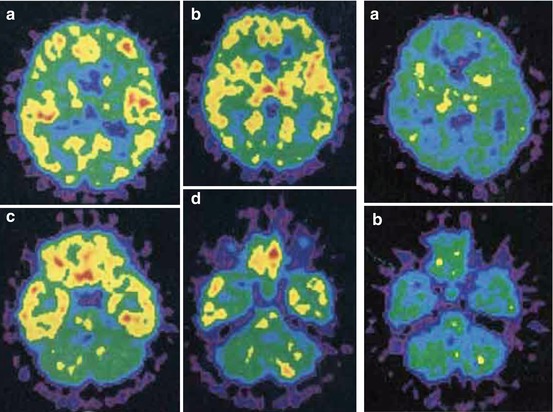
Fig. 13.9
Mapping of H1R in a healthy human using [11C]pyrilamine. Left: transaxial PET images at 30–60 min p.i., with high radioactivity in temporal and frontal cortex, hippocampus and thalamus; localized above the orbitomeatal (OM) line at about 55 (a), 48 (b), 18 (c) and 11 (d) mm. Right: coronal PET images after administration of d-chlorpheniramine at 30–60 min p.i. with marginal reduction of activity in thalamus, striatum and cerebellum; localized above the OM line at about 48 (a) and 11 (b) mm. Reprinted by permission of John Wiley & Sons Ltd from Yanai et al. 1992b, Figure 1 and 2
Metabolite analysis showed strong metabolic degradation of [11C]pyrilamine in arterial plasma up to ~90 % at 30 min p.i. (Yanai et al. 1992b). However, based on the low content of [3H]pyrilamine metabolites in guinea pig brain (~8 % of total radioactivity at 60 min p.i.) (Yanai et al. 1990b), it was concluded that radiolabelled metabolites had no effects on [11C]pyrilamine binding results in human brain. Nevertheless, species differences should be taken in account, which were especially apparent in cerebellum. In guinea pig the highest radioligand uptake occurred in the cerebellar region, which was inhibited significantly by the antihistamine triprolidine (Yanai et al. 1990b). In humans, radioligand uptake in cerebellum was lower than in other brain regions, and inhibition by d-chlorpheniramine was negligible (Yanai et al. 1992b), suggesting higher metabolic degradation of the radioligand or less H1R expression and specific binding. The latter was in accordance with the lowest specific binding of [3H]pyrilamine in the cerebellar fractions of human, dog and rat brain homogenates, respectively (Chang et al. 1979; Yanai et al. 1990a, 1992a, b).
The specific binding of [11C]pyrilamine in the cortical regions appeared to be age dependent (Yanai et al. 1992b) and was examined more closely in a separate PET study of age-correlated H1R binding in normal healthy volunteers (Fig. 13.10) (Yanai et al. 1992a). A decrease of [11C]pyrilamine as well as [11C]doxepin binding in frontal, parietal and temporal cortices about 13 % per decade was shown, implying a loss of H1R density. This went along with age-dependent, significantly increased levels of histamine metabolites in human cerebrospinal fluid (Prell et al. 1988, 1991), indicating increased histaminergic activity. However, in postmortem human brain investigated, [3H]pyrilamine affinity showed no significant differences depending on lifetime (Yanai et al. 1992a). This discrepancy was reasoned by possible tissue autolysis of the postmortem materials and a changed microenvironment of the receptors in vitro. The [11C]pyrilamine PET study, however, offered the possibility to investigate H1R density and activity in an intact physiological system.
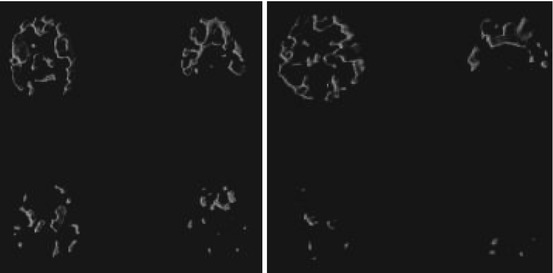
Fig. 13.10
Transaxial PET images obtained at 30–60 min after [11C]pyrilamine (left) and 45–90 min after [11C]doxepin injection (right) in young (25 and 20 years) and aged (69 and 80 years) subjects . The two images of each volunteer are localized at about 48 and 18 mm above the OM line. Reprinted by permission of Wolters Kluwer Health from Yanai et al. 1992a, Figure 1
To evaluate the kinetics of [11C]pyrilamine in the human brain, factor analysis and compartmental modelling were used both under baseline conditions and after H1R blockade (Szabo et al. 1993). Factor analysis conformed that data could be described by two tissue compartments, although the specific signal was small compared to the non-specific signal, as demonstrated by the blocking studies. In addition, metabolism of [11C]pyrilamine was fast. Already at 20 min p.i., radioactivity in plasma was primarily due to radiolabelled metabolites. Only factor analysis was able to detect a significant, although small, change between baseline and blocking conditions.
Moreover, data from this study were inserted into an artificial, self-organizing neural network (Resch and Szabo 1994). Within pixel time series, this network was then able to identify and separate receptor-rich from receptor-poor brain regions. It was therefore supposed to be a helpful tool in comparative analysis of multiple datasets, but there are no further applications of this network in the analysis of histaminergic PET imaging reported yet.
Although some specific signal was shown, [11C]pyrilamine appeared to be less suitable for in vivo use than [11C]doxepin. [11C]Pyrilamine was included in only one more recent study, in which brain uptake of eight radioligands in mice was assessed after P-glycoprotein (P-gp) modulation (Ishiwata et al. 2007). Pretreatment with the immunosuppressant and P-gp modulator cyclosporine A (Linnet and Ejsing 2008; Saeki et al. 1993) (50 mg/kg i.v., 30 min prior to [11C]pyrilamine) led to a significant increase in peak uptake in the brain (2.71–4.61 %ID/g at 15 min p.i.), but also in a decrease in brain-to-blood ratio (7.07–3.21 at 15 min p.i.). As an increase of both factors was defined as indication for P-gp modulation, the authors did not conclude [11C]pyrilamine as to be modulated by P-gp (Ishiwata et al. 2007).
Incidentally, a comparative study demonstrated that imaging characteristics of [11C]doxepin were superior over those of [11C]pyrilamine, also in human (Yanai et al. 1992c). In five healthy subjects, both radioligands showed similar uptake patterns (Fig. 13.11, 1 and 2) in distinguished brain regions (cortices, hippocampus, thalamus), but differed in time-activity profiles and contrast. The highest uptake was observed within 45–90 min p.i. for [11C]doxepin with 7.6 %ID/L and within 30–60 min p.i. for [11C]pyrilamine with 4.7 %ID/L at 57.5 min p.i. in frontal cortex. This can be explained by the somewhat higher affinity for human H1R (K i = 1.9 nM) and the better bioavailability of [11C]doxepin (in plasma 60.4 % parent compound, 0.44 %ID/L, 60 min p.i.), as compared with [11C]pyrilamine (K i = 5.4 nM; 9.5 % parent compound, 1.3 %ID/L). Nevertheless, also for [11C]doxepin high non-specific binding was shown given the lack of blocking with d-chlorpheniramine in cerebellum (cf. Fig. 13.11, block 1 and 3).
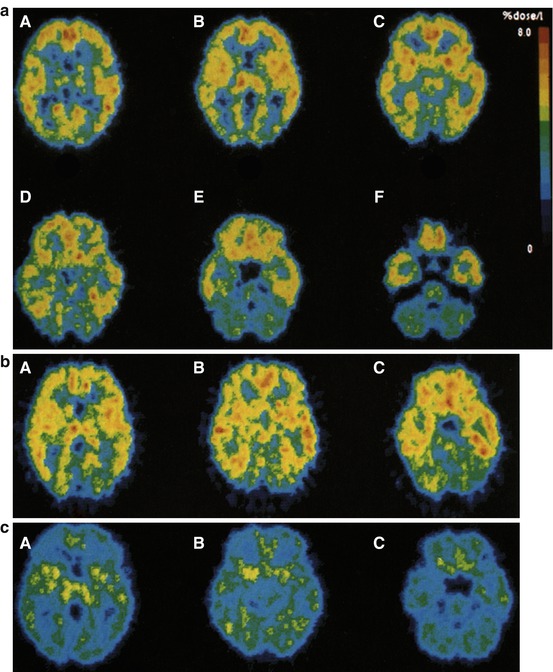
Fig. 13.11
(a) A–F Average transaxial [11C]doxepin images (three healthy volunteers, 45–90 min p.i.). (b) A–C Average transaxial [11C]pyrilamine images (three healthy volunteers, 30–60 min p.i.). (c) A–C Average transaxial [11C]doxepin images after pretreatment with 5 mg d-chlorpheniramine i.v. (two healthy volunteers, 45–90 min p.i.). Reprinted by permission of Elsevier Ltd from Yanai et al. 1992c, Figure 1, 2, and 3
Using several mammalian species, the correspondence between animal and human H1R binding results was investigated (Ishiwata et al. 2004). Uptake expressed as %ID/g, standardized uptake value (SUV) and volume of distribution (V T) under baseline and blocking conditions (230–3500 nmol/kg, d-chlorpheniramine i.v.) were determined in biodistribution (mouse, rat, guinea pig) and PET imaging (rabbit, monkey) experiments and compared with (reanalysed) data from previous studies in human (Yanai et al. 1992c). The fraction of total brain uptake representing H1R specific binding of [11C]doxepin was 10 % in mouse, 20 % in rat and rabbit, and 30 % in monkey compared with 36 % in human. This specific signal was absent in guinea pig. Besides the low specific binding, time-activity curves in mouse brain showed the highest divergence from the other species with a remarkably faster peak uptake than in human (15 vs. 60 min). As expected, both distribution and kinetics of [11C]doxepin were most similar between monkey and human. The highest uptake was observed in cortical regions, with a frontal cortex V T of 49 in monkey and 37 in human. In the same brain region, also highest specific binding was detected, shown by reduced V T values of 33 and ~26, respectively. Furthermore, there was a match in regions with the highest non-specific binding between both species with the lowest [11C]doxepin inhibition in thalamus and cerebellum.
In a comprehensive study, V Ts of [11C]doxepin uptake were determined for 13 brain regions in 12 healthy volunteers (Dogan et al. 2001a), confirming highest H1R expression in anterior cingulate cortex (V T ~ 34.6) and lowest in cerebellum (V T ~ 20.5). Hence, it was concluded that cerebellum was a suitable reference region for calculating binding potentials.
In another study, the optimal compartmental model for analysing [11C]doxepin kinetics was determined (Mochizuki et al. 2004a). PET scans of healthy volunteers were analysed using both two- and single-tissue compartment models. The latter model provided more stable outcome measures in both receptor-rich (cingulate cortex, tissue mass related V T = 37 mL/g) and receptor-poor (cerebellum, tissue mass related V T = 26 mL/g) brain regions. In addition, a single-tissue compartment model would be compatible with the rapid equilibration between bound and unbound compartment.
Acquiring an arterial plasma input function is cumbersome as it requires measurement of radiolabelled metabolites at several time points. In addition, it is inconvenient for the patient, as arterial sampling is an invasive procedure. In the first instance, a simplified PET protocol was developed, reducing blood collection to a single sample around 10 min after injection of the radioligand (Mochizuki et al. 2004b). Further, in this study [11C]doxepin uptake in plasma input function normalized static PET images showed best correlation with V T values within 70–90 min p.i. Therefore, PET scan time could be minimized to this timeframe. Next, implementation of Logan graphical analysis (Logan et al. 1996) with cerebellum as reference tissue enabled quantification of [11C]doxepin binding in human brain without arterial blood sampling (Suzuki et al. 2005). Nevertheless, the high level of non-specific binding made it difficult to quantify [11C]doxepin binding in regions with lower H1R expression (Mochizuki et al. 2004a; Yanai et al. 1992c), and pathological conditions with changes in rCBF and BBB function could make it impossible to use a reference tissue model for [11C]doxepin PET data analysis (Mochizuki et al. 2004b).
First investigations of H1R expression and function under pathological conditions were performed in patients with Alzheimer’s disease (AD), and results were compared with those in young and elderly healthy subjects (Higuchi et al. 2000). In general, analysis using a two-tissue compartment model revealed a diminished binding potential (BPND) of [11C]doxepin in elderly healthy subjects and AD patients over young volunteers. Significantly, the BPND of frontal cortex decreased from young (BPND ~ 0.4) and old (BPND ~ 0.2) to mild (BPND ~ 0.1) and advanced AD (BPND ~ 0.05), whilst changes in BPND of thalamus and striatum showed no significance. Results were similar to those obtained by Logan graphical analysis (Logan et al. 1990) and agreed with values of rCBF ratios, estimated over cerebellum in the same study. rCBF ratios in frontal cortex were significantly diminished in old and AD versus young volunteers (Fig. 13.12), however, to a lower rate than the changes in BPNDs. Further, no changes in rCBF ratios were observed in striatum and thalamus, suggesting that changes in [11C]doxepin binding are mainly based on altered H1R levels. Altogether this study confirmed not only previous reports of decreased H1R activity in aged brain (Higuchi et al. 1998; Yanai et al. 1992a, b) but also relevant loss of H1R expression and/or histaminergic neurons in AD. Therefore, next to PET imaging of acetylcholinesterase and amyloid load, it was actually proposed to include H1R expression in the procedures for diagnosing AD (Okamura and Yanai 2009; Yanai et al. 2007).
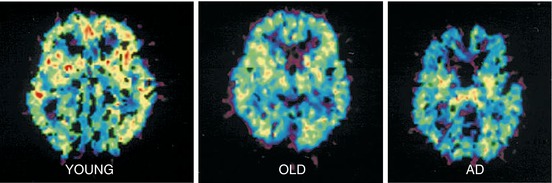
Fig. 13.12
Parametric images of BPND of [11C]doxepin in young (22 years), old (64 years) and AD (early state with 66 years) subjects, generated using Logan graphical analysis. Reprinted by permission of Elsevier Ltd from Higuchi et al. 2000, Figure 2
In male patients with major depressive disorder and of varying age (Fig. 13.13), BPND values of [11C]doxepin significantly decreased in cortical frontal (BPND ~ 0.15) and anterior cingulate (BPND ~ 0.25) areas compared with the same regions in healthy subjects (BPND around 0.2 and 0.35, respectively) (Kano et al. 2004). In these brain regions, BP values also showed a significant negative correlation with individually rated values on a scale for the severity of depression symptoms (Zung 1965). The latter also included phenomena such as disturbances in sleep behaviour and attention, attributed to H1R dysfunction, as mentioned above (see Sect. 13.1), and associated with frontal and anterior cortical brain regions. Although not completely clarifying the underlying pathology (stress-related increase of histamine release or region-specific reduction of H1R expression), this study confirmed an involvement of altered histaminergic neurotransmission in depression.
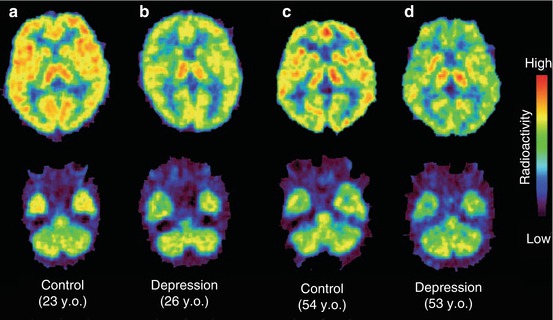
Fig. 13.13
Individual PET images at the thalamic and cerebellar level at 45–90 min after injection of [11C]doxepin in a young healthy (a), a young depressed (b) and a middle-aged healthy (c) as well as a depressed (d) volunteer. Reprinted by permission of John Wiley & Sons Ltd from Kano et al. 2004, Figure 1
In particular frontal cortical areas showed diminished H1R activity in schizophrenia (Iwabuchi et al. 2003, 2005). In young schizophrenic adults, BPND of [11C]doxepin was significantly reduced from ~0.2 (controls) to ~0.1 in prefrontal cortex and from ~0.3 (controls) to ~0.15 in the cingulate region (Fig. 13.14). This was in accordance with reduced H1R density in frontal brain areas of schizophrenic patients, determined postmortem. In contrast to the findings in depression (see above), [11C]doxepin images in schizophrenic patients did not correlate with a symptom scale, but the causative pathophysiology could be deduced. In the cerebrospinal fluid of schizophrenic patients, significantly increased levels of N-methylhistamine were found (Prell et al. 1995), whereas an H1R promoter gene variant appeared without significance (Mancama et al. 2002). Therefore, the downregulated H1R expression, demonstrated by reduced [11C]doxepin binding in the schizophrenic brain, was supposed to be a response to increased presynaptic histamine release (Iwabuchi et al. 2005).
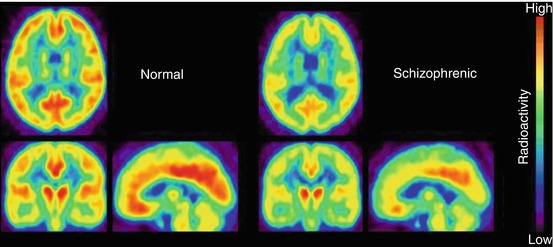
Fig. 13.14
Average transaxial, coronal and sagittal PET images of [11C]doxepin uptake in brains of schizophrenic patients and healthy control subjects, 45–90 min p.i. Reprinted by permission of Elsevier Ltd from Iwabuchi et al. 2005, Figure 1
Significantly higher [11C]doxepin binding was observed in the left lentiform nucleus (BPND ~ 0.35) and right amygdala (BPND ~ 4) of young female anorexia nervosa (AN) patients (Fig. 13.15), compared with female (BPND ~ 0.25 and 0.2, respectively) as well as male (BPND ~ 0.25 and 0.05, respectively) healthy volunteers (Yoshizawa et al. 2009). Even though there was no compliance with body mass indexes or length of disease, BPND of [11C]doxepin in thalamus and left amygdala showed a significant negative correlation with results of an eating behaviour inquiring self-report (Garner et al. 1982; Garner and Garfinkel 1979). Despite the strong association of H1R activity and nutrition, it remained unclear in this study whether AN is a cause or effect of alterations in histaminergic neurotransmission. Histamine levels were shown to be significantly increased in, for instance, food-deprived activity stress in rats (Endou et al. 2001), which means forced physical activity under limited food access, and led to a slow, but also significant decrease in H1R expression. On the other hand, inhibition of histamine metabolism significantly decreased food intake, and a low-protein diet led to upregulated H1R levels in rats (Mercer et al. 1996). Later results of increased [18F]FDG uptake in H1R gene knockout mice (Wang et al. 2010), however, revealed a causative role of decreased H1R expression in the development of obesity (see Sect. 13.1) and would support the concept that AN can result from increased H1R density.
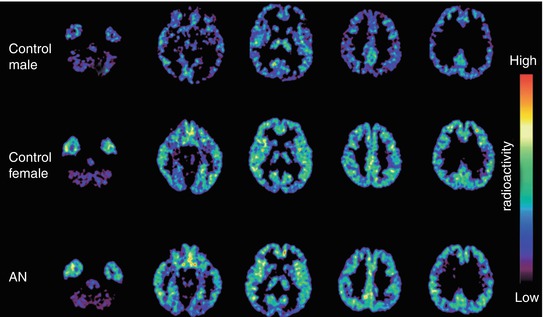
Fig. 13.15
Transaxial PET images of the [11C]doxepin distribution in the brain of control subjects and anorexia nervosa (AN) patients. Reprinted by permission of Elsevier Ltd from Yoshizawa et al. 2009, Figure 1
This study also revealed significant gender differences in H1R expression (Fig. 13.15) in accordance with results of other [11C]doxepin PET studies in humans (Kato et al. 2009; Yanai et al. 2011a). Analysis of data from healthy female volunteers resulted in BPND values of ~0.4 in cortical regions, 0.2 in amygdala and 0.2 in hippocampus, in comparison with ~0.3, 0.1 and 0.1, respectively, in healthy men (Yoshizawa et al. 2009). These differences coincided with significantly higher levels of histamine metabolites in female cerebrospinal fluid (Prell et al. 1991) and emphasized that a higher incidence of eating disorders in women compared with men (Pawluck and Gorey 1998; Smink et al. 2012) is not exclusively the result of social and psychological factors.
Moreover, attempts to assess the role of H1R in attentive waking and circadian rhythm were performed using [11C]doxepin PET (Shibuya et al. 2012). Healthy male volunteers showed slightly decreased BPND values in the morning than in the afternoon (e.g. BPND ~0.55 and ~0.45, respectively, in anterior cingulate gyrus). During calculation tasks, BPND decreased as well, e.g. from ~0.6 (resting state) to ~0.55 (attentive state), in posterior cingulate gyrus. However, this reduction in [11C]doxepin binding was not observed in all cortical brain regions investigated. Consequently, involvement of H1R activity in alertness and cognition could not be established. This lack of involvement also follows from the delayed response of H1R to stress-related histamine release, pointing to the more rapidly downregulated H3R (Endou et al. 2001) as a better target for imaging altered histaminergic neurotransmission (see section 5). Nevertheless, the results demonstrated the good reproducibility of [11C]doxepin PET studies.
The majority of [11C]doxepin investigations, however, were performed to examine potential cognitive side effects of antihistamines, such as affected attention and psychomotor skills (Van Ruitenbeek et al. 2010; Theunissen et al. 2006). As a parameter, receptor occupancy (RO) (Gillman et al. 2009) in human brain following administration of antihistamines was determined. Several antihistamines were evaluated, also taking in account effects of dose and long-term administration (Buczyłko 2009; Dogan et al. 2001b; Tagawa et al. 2001; Tashiro et al. 2006; Yanai et al. 1995a, b, 2008, 2011a). Combination of these studies with investigations of sleepiness and cognitive performance (Kubo et al. 2011; Okamura et al. 2000; Senda et al. 2009; Tashiro et al. 2002a, b, 2004, 2008a, 2009; Yanai et al. 1999; Zhang et al. 2010) and comparison with other effects of antihistamines, such as rCBF (Mochizuki et al. 2002; Okamura et al. 2000; Tashiro et al. 2008c) (see Sect. 13.1), provided the means to correlate RO with neurological effects and/or subjective perception. To give an example, oral administration of the first-generation antihistamine diphenhydramine (30 mg, 120–180 min prior to [11C]doxepin) caused significant subjective sleepiness compared with the second-generation antihistamine bepotastine (10 mg) or placebo (lactobacteria preparation, 6 mg) in healthy humans (Tashiro et al. 2008a; Yanai et al. 2011b). At the same time, cortical H1R RO (BPND in Fig. 13.16) was significantly lower for bepotastine (14.7 %) than for diphenhydramine (56.4 %). These values also correlated significantly with drug plasma concentrations, 71.0 and 16.3 ng/mL at 120 min after administration, demonstrating low blood–brain barrier (BBB) permeability for bepotastine and high brain uptake of diphenhydramine, respectively (Tashiro et al. 2008a).
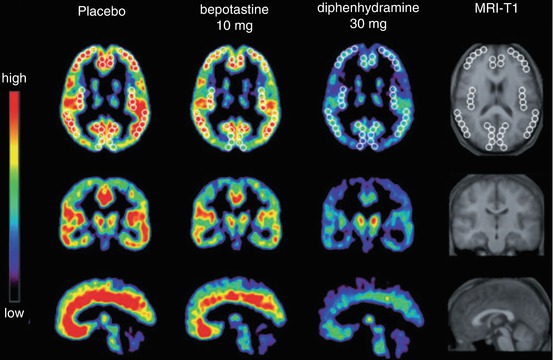
Fig. 13.16
Transaxial (top), coronal (middle) and sagittal (bottom) images of mean BPNDs of [11C]doxepin in the human brain of healthy male subjects (n = 8), about 160 min after oral administrations of placebo or an antihistamine. White circles in the transaxial images indicate ROIs, used for quantitative analysis in the corresponding study. Reprinted by permission of John Wiley & Sons Ltd from Tashiro et al. 2008a, Figure 2
In general, PET results were in line with those reflecting individual perception (Izumi et al. 2008b), although the relationship between RO by an antihistamine and a sedative effect was not significant in all cases (Izumi et al. 2008b; Senda et al. 2009; Tashiro et al. 2002a, 2004, 2009; Yanai et al. 1999; Zhang et al. 2010). One possible explanation could be individual differences in subjective notion (Tashiro et al. 2009; Yanai et al. 1999). In addition, a dependency on type of disease, treated with an antihistamine, was discovered (Izumi et al. 2008a), and several studies also reported mild stimulating effects on attention and task performance by some H1R antagonists (Theunissen et al. 2006). It should also be noted that PET measurements of RO cannot discriminate between occupancy by parent compounds and that by pharmacologically active metabolites (Gillman et al. 2009).
Nonetheless, based on the results of these comprehensive PET studies, a classification of antihistamines in sedative (RO of H1R >50 %, high BBB permeability), less sedative (RO of 20–50 %, BBB permeability moderate) and non-sedative (RO <20 %, low BBB permeable) was proposed (Yanai et al. 2011b). Despite the existence of several caveats, antihistamine evaluation based on quantification of H1R occupancy supports the idea that PET can play an important role in drug development and safety evaluation of new pharmaceuticals (Wong and Pomper 2003).
13.4 Imaging of the Histamine H2 Receptor
Via its Gαs protein, H2R stimulates adenylyl cyclase to cAMP production and hence activation of cationic channels, such as I h , I AHP and Kv3.2. It is involved in the accommodation (or adjustment) of neural action potentials and cell proliferation, for example in brain development (Molina-Hernández et al. 2012). Despite its proven excitatory and proliferative function, over the years H2R has turned out to be a challenge for brain mapping. H2R is widely distributed across all brain regions, often co-expressed with H1R (Martinez-Mir et al. 1990). This conflicts with the prevalently deficient subtype selectivity of H2R targeting ligands (Bongers et al. 2010; Hill et al. 1997). In addition, most H2R ligands are polar compounds and as such exhibit limited BBB permeability, and radiolabelling of the compounds of interest is cumbersome (Crouzel 1990; Hill et al. 1997).
Nevertheless, one carbon-11-labelled ligand has been synthesized and evaluated in vivo in mice (Yanai et al. 1994). The H2R antagonist [11C]nizatidine (Fig. 13.5) was synthesized via conversion of its N-desmethyl-precursor with [11C]CH3I. Unfortunately, this radioligand did not show sufficient uptake in the brain. Instead, it was proposed to use it for imaging H2R in peripheral tissues, but no reports are available yet.
In the periphery H2R is supposed to be involved in smooth muscle relaxation, such as in cardiovascular, airway and gastric systems, and in gastric acid secretion (Hill et al. 1997; Parsons and Ganellin 2006). Nevertheless, only one attempt to image peripheral H2R has been reported using indirect SPECT imaging with [99mTc]pertechnetate and an [111In]indium-diethylenetriaminepentaacetic acid-containing liquid meal to investigate effects of the H2R antagonist ranitidine on gastric motor function (Madsen and Graff 2008). In healthy male volunteers, injection of a 50 mg bolus of ranitidine caused neither a change of gastric volume nor gastric emptying before, during and after administration of the meal. This result is comparable with clinical studies of dyspepsia treatment, where H2R antagonism not necessarily had a significant effect over treatment with placebo (Bytzer 2002). It demonstrates the difficulty in correlating a specific physiological function with a single receptor, in this case H2R.
13.5 Imaging of the Histamine H3 Receptor
In the past two decades, numerous compounds have been developed for targeting H3R (Leurs et al. 2005; Stark et al. 2004; Tiligada et al. 2011). Amongst them, the imidazole-based H3R antagonist thioperamide binds to human H3R with a K i of 7.14 nM (Esbenshade et al. 2003) and a pK i of 7.3 (Lim et al. 2005), and is considered to be the classical H3R antagonist. Its carbimidothioate analogue S-[11C]methylthioperamide (Fig. 13.5) was the first H3R targeting PET ligand to be synthesized and evaluated in mice (Yanai et al. 1994). This radioligand was prepared by S-[11C]methylation using an automated synthesis method (Iwata et al. 1992). With low uptake in mouse brain, however, S-[11C]methylthioperamide was shown to be inappropriate for cerebral imaging in vivo.
Deriving from potent lead compounds, various tritiated and radioiodinated compounds have been developed for pharmacological H3R studies. Nevertheless, developing PET tracers with sufficient brain penetration and specific binding remained difficult for many years (Windhorst et al. 1998). Several miscellaneous radioligands have been evaluated as unsuitable for brain PET, such as the imidazolylbenzophenone [18F]FUB 272 (Fig. 13.5), the first reported fluorine-18-labelled H3R ligand (Ponchant et al. 1997). Radiosynthesis was based on nucleophilic aromatic substitution (SNAr) of the corresponding nitro precursor, yielding 65 % of [18F]FUB 272 with a specific activity of 70.3 GBq/μmol. In rat brain, uptake of [18F]FUB 272 appeared very low, i.e. ≤0.7 %ID/g, with a homogeneous distribution. Uptake in cerebellum indicated nonspecific binding or presence of radiolabelled metabolites in the brain. Comparable results were obtained for the carbon-11-labelled methylthio-phenoxy analogue [11C]UCL 1829 (Ponchant et al. 1997). Synthesized via S-[11C]methylation using [11C]CH3I, this radioligand could be produced with a specific activity of 35 GBq/μmol. Also in this case, however, biodistribution experiments in rats resulted in low and homogenous brain uptake.
Analogues of S-[11C]methylthioperamide, such as fluorine-18-labelled thioperamide derivatives, were developed and investigated in vivo. [18F]VUF 5000 and [18F]VUF 5182 (Fig. 13.5) were synthesized in multistep radiosyntheses, starting from cis-4-[18F]fluoromethylcyclohexylamine as radiolabelled synthon (Windhorst et al. 1999a, c). In a total synthesis time of 3.5–4 h, these radioligands were obtained in RCYs of 23 and 12 %, respectively, and with RCPs >99 %. Specific activity for [18F]VUF 5000 was determined with >95 GBq/μmol (Windhorst et al. 1999c). A K i value of 2.3 nM for the inhibition of rat H3R and high selectivity of VUF 5000 over various other targets, a logD 7.2 of 1.88, and fast blood clearance of [18F]VUF 5000 in rats pointed to good imaging properties (Windhorst et al. 1999a). Nevertheless, both radioligands showed very low uptake in rat brain of ~0.01 %ID/g at 30 min p.i.
With [18F]fluoroproxyfan (Fig. 13.5) another imidazole-based PET ligand was investigated. In a multistep radiosynthesis, starting with radiofluorination of benzaldehyde and a synthesis time of less than 100 min, this radioligand was prepared in an RCY of ~10 %, a specific activity ≥150 GBq/μmol and an RCP >99 % (Funaki et al. 2007; Iwata et al. 2000). After i.v. injection in rats, [18F]fluoroproxyfan distributed heterogeneously in rat brain. The highest uptake was observed in hypothalamus (ratio to cerebellum of 1.9 at 60 min p.i.). In blocking studies, radioligand binding decreased with an increasing dose of nonradioactive compound, resulting in a reduced hypothalamus to cerebellum ratio from 1.6 to 1.0 at 30 min p.i. after pre-administration of 0.5 mg/kg fluoroproxyfan p.i. However, cortex to cerebellum ratios did not change (Funaki et al. 2007). As 94 % of the brain activity at 30 min p.i. was represented by parent compound, interaction of [18F]fluoroproxyfan with binding sites unrelated to H3R was indicated. This was in accordance with the results of a SPECT study using structurally related [123I]iodoproxyfan (Windhorst et al. 1999b), where binding was not inhibited by pretreatment with [R]-α-methylhistamine (see below).
Non-imidazole-based H3R antagonists turned to be more promising clinical candidate pharmaceuticals (Leurs et al. 2005; Zhang et al. 2005), as in general they possess higher target selectivity and less drug-drug interactions. The benzylmorpholine [11C]JNJ-10181457 (Fig. 13.5) was the first reported non-imidazole-based radioligand (Airaksinen et al. 2006). Its nonradioactive analogue was identified as a highly potent (K i = 0.8nM, human) and selective (Apodaca et al. 2003) H3R antagonist, and the moderate lipophilicity (logD 7.4 = 1.54) indicated sufficient uptake via the BBB. The multistep radiosynthesis of [11C]JNJ-10181457 was carried out in a one-pot procedure, starting with [11C]carboxylation of an in situ generated phenyllithium precursor and providing radioligand in 67 min with an RCY of ≥20 %, an RCP >99 % and a specific activity ≥30 GBq/μmol (Airaksinen et al. 2006). This radioligand showed sufficient accumulation in rat brain with up to 1.7 %ID/g in cerebral cortex and 1.4 %ID/g in hippocampus, whilst the lowest uptake was observed in cerebellum with 0.8 %ID/g at 30 min p.i. Unfortunately, uptake could not be significantly inhibited, neither by pre-administration of nonradioactive compound nor by the H3R antagonist JNJ-5207852 (10 mg/kg i.p.). With around 13 %ID/g in the cerebral cortex at 30 min p.i., uptake of [11C]JNJ-10181457 was remarkably high in H3R gene knockout mice. These results, on the one hand, pointed to a high level of non-specific binding. On the other hand, they correlate well with results of investigations of H3R involvement in neuroinflammatory diseases, where H3R and H3H4R gene knockout mice demonstrated increased BBB permeability (Saligrama et al. 2012; Teuscher et al. 2007).
As the only radioligand succeeding in H3R imaging in humans, most progress has been made with the benzoazepane [11C]GSK189254 (Fig. 13.5). The H3R antagonist GSK189254 showed high affinity for human H3R with a pK i of 9.59 and a >10,000-fold selectivity over other histamine receptor subtypes (Medhurst et al. 2007). Synthesis of the radiotracer was achieved by [11C]methylation of the corresponding desmethyl-amide. Starting from [11C]CH3I, [11C]GSK189254 could be produced with an RCY of up to 80 % (Plisson et al. 2009), an RCP >99 %, a specific activity of 50–500 GBq/μmol (Jucaite et al. 2013; Plisson et al. 2006, 2009) and up to 20 % uncorrected RCY in a total synthesis time of 27 min (Ashworth et al. 2010). A second approach by means of [11C]CH3OTf resulted in a maximum RCY of 60 % (based on [11C]CO2) and a specific activity of up to 740 GBq/μmol at EOB in a total synthesis time of 40 min (Wang et al. 2012). Good BBB permeability of [11C]GSK189254, indicated by a logD 7.4 of 1.74 (Plisson et al. 2009) and logP of 2.24 (Wang et al. 2012), led to high brain uptake in first PET experiments in porcine (Fig. 13.17). With 9.0 %ID/L at 20 min p.i. (Plisson et al. 2009), the radiotracer showed the highest accumulation in known H3R-rich regions such as striatum and cortices (Fig. 13.17b). Resulting ratios of striatum and frontal cortex over cerebellum were 4.7 and 2.9 at 85 min p.i., respectively (Plisson et al. 2006).
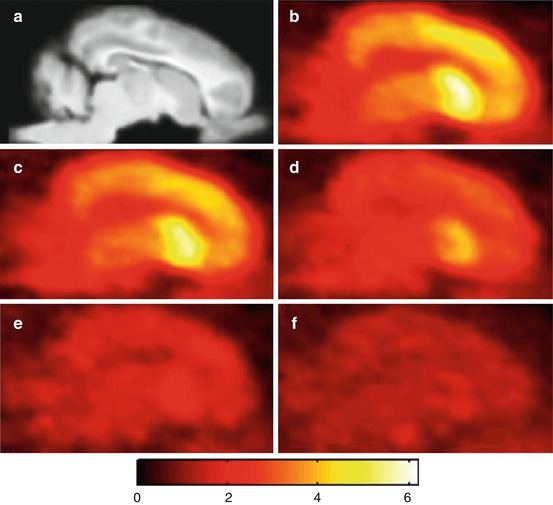
Fig. 13.17
Summed (0–90 min p.i.) sagittal porcine brain images after administration of [11C]GSK189254. (a) Aligned MR image. (b) Baseline PET scan. (c) + 0.006 mg/kg ciproxifan. (d) + 0.06 mg/kg ciproxifan. (e) + 0.6 mg/kg ciproxifan. (f) + 2.0 mg/kg ciproxifan. Reprinted by permission of SNMMI from Plisson et al. 2009, Figure 3
Investigation of metabolism in plasma samples showed degradation of [11C]GSK189254 up to 58 % at 30 min p.i. Radiolabelled metabolites, however, did not affect imaging results in pig brain, as radioligand binding was inhibited in a dose-dependent manner by both co-administration of the H3R inverse agonist/antagonist ciproxifan (Fig. 13.17c–f) and of GSK189254 (0.08–50 μg/kg). The latter experiment enabled in vivo determination of [11C]GSK189254 affinity for pig H3R with a K d of 0.1 nM. H3R expression levels were determined with B max values of 2.65 in striatum and 2.05 nM in cortex (Plisson et al. 2009). The resulting bound-to-free radioligand ratio of B max/K d ≥10 pointed to high suitability for determining H3R alterations using [11C]GSK189254 (Eckelman 1998).
High metabolic stability was observed in humans with ~86 % of parent radioligand present at 75 min p.i. (Ashworth et al. 2010). [11C]GSK189254 rapidly entered the brain and distributed heterogeneously (Fig. 13.18, top). The highest uptake was measured in caudate with a total V T of around 95, which was displaced with 50 μg of non-labelled GSK189254 p.o. (Fig. 13.18, middle; 4 h prior to radioligand) to a V T ~22. Cerebellar uptake, however, with a V T ~ 22, was diminished less conspicuous to a V T of ~11. The resulting lack of a reference region to determine RO values could be overcome by application of the Lassen plot (Cunningham et al. 2010; Lassen et al. 1995; Lassen 1992).
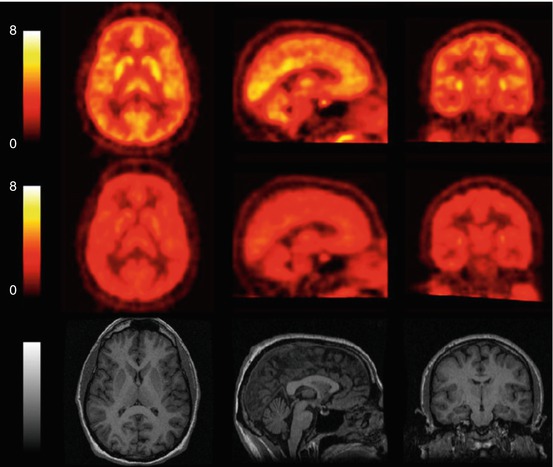
Fig. 13.18
[11C]GSK189254 uptake in a healthy human subject. Mean SUV images (0–90 min) before (top) and 4 h after (middle) a 50 μg oral dose of GSK189254 are shown together with structural MR images of the same subject (bottom). Reprinted by permission of SNMMI from Ashworth et al. 2010, Figure 1
[11C]GSK189254 showed minor washout in regional time-activity curves and a significantly diminished partition between tissue and plasma in the second scans of test-retest studies (e.g. in putamen from V T of 120–68, Δt 2 h). Therefore, an alternative reversible two-tissue compartment model was applied, taking account of GSK189254 carryover from the first to the second scan (Ashworth et al. 2010; Slifstein 2010). In the same study, an affinity (K d) for human H3R of 0.01 nM and a B max in putamen of 3.8 nM were determined. Subsequently, it was demonstrated that the injected dose of [11C]GSK189254 led to an estimated H3R occupancy of >5 %, which exceeds tracer conditions. Hence, [11C]GSK189254 PET studies require high specific activity in order to limit the administered dose of GSK189254 to 0.003 μg/mg. Alternatively, studies should take into account mass dose effects when analysing data (Ashworth et al. 2010), especially for the determination of RO by other H3R targeting compounds.
This was considered in a [11C]GSK189254 PET study of RO by an H3R antagonist in baboon (Logan et al. 2012). Radioligand accumulation was corrected for radiometabolite fractions and tracer mass, and RO was determined using the Lassen plot. Uptake was highest in striatum with a V T of around 130 (Fig. 13.19, left). The diazepan JNJ-39220675, inhibiting H3R with a K i of 1.4 nM (Letavic et al. 2010), blocked around 90 % of [11C]GSK189254 binding after intravenous and oral administration of 1 mg/kg (Fig. 13.19, right). Together with results of preclinical studies, showing reduced alcohol preference in abusive rats (Galici et al. 2011), good BBB permeability and stable H3R blockade by JNJ-39220675 justify further preclinical studies in the treatment of alcoholism (Logan et al. 2012).
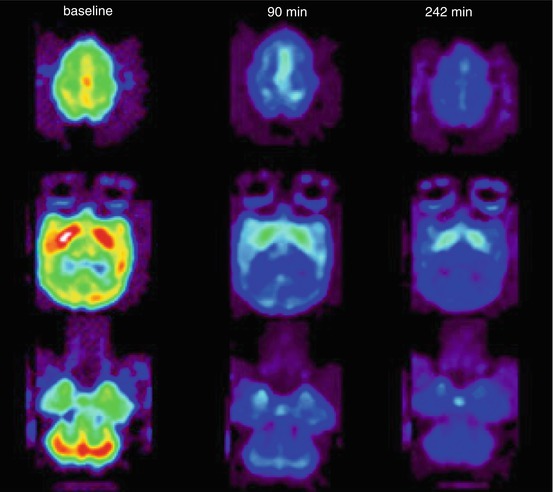
Fig. 13.19
Transaxial [11C]GSK189254 PET images showing the effect of oral administration of JNJ 39220675 (1 mg/kg) in baboon brain at the level of the striatum. Reprinted by permission of Springer Science + Business Media from Logan et al. 2012, Figure 5
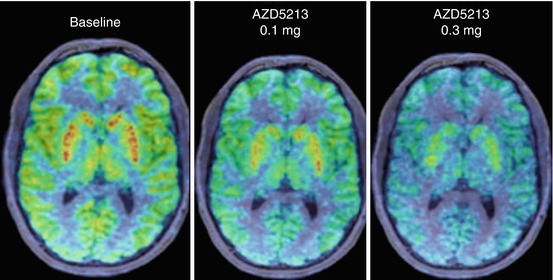
In a recently published [11C]GSK189254 PET study in humans, the highly selective H3R antagonist AZD5213 (undisclosed structure and pharmacological data) was investigated with respect to a dose-dependent effect on circadian rhythm (Jucaite et al. 2013). Taking into account the semi-reversible binding characteristics, means slow dissociation of [11C]GSK189254 (Ashworth et al. 2010), examinations were extended to 120 min. The arterial input function was corrected for dispersion and radiolabelled metabolites. In baseline scans, the highest radioactivity was observed in thalamus. Although known as highly H3R expressing regions and showing high radioligand accumulation (Fig. 13.20), caudate and putamen were excluded from quantitative analyses, as they did not reach equilibrium.
 The Impact of Genetic Polymorphisms on Neuroreceptor Imaging
 Imaging of Central Benzodiazepine Receptors in Chronic Cerebral Ischemia
 PET Tracers for Beta-Amyloid and Other Proteinopathies
 PET Imaging of ABC Transporters in the BBB
 Imaging Type 1 Glycine Transporters in the CNS Using Positron Emission Tomography
 Development of Radioligands for In Vivo Imaging of NMDA Receptors


Related posts:
The Impact of Genetic Polymorphisms on Neuroreceptor Imaging
Imaging of Central Benzodiazepine Receptors in Chronic Cerebral Ischemia
PET Tracers for Beta-Amyloid and Other Proteinopathies
PET Imaging of ABC Transporters in the BBB
Imaging Type 1 Glycine Transporters in the CNS Using Positron Emission Tomography
Development of Radioligands for In Vivo Imaging of NMDA Receptors
Stay updated, free articles. Join our Telegram channel
Full access? Get Clinical Tree
