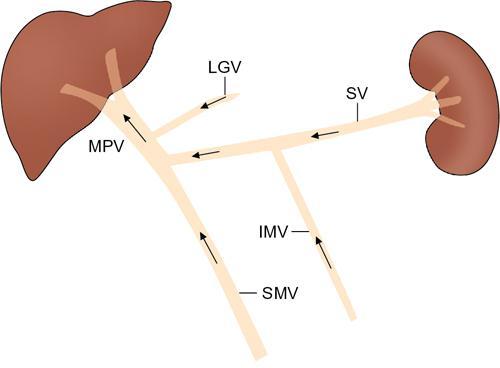
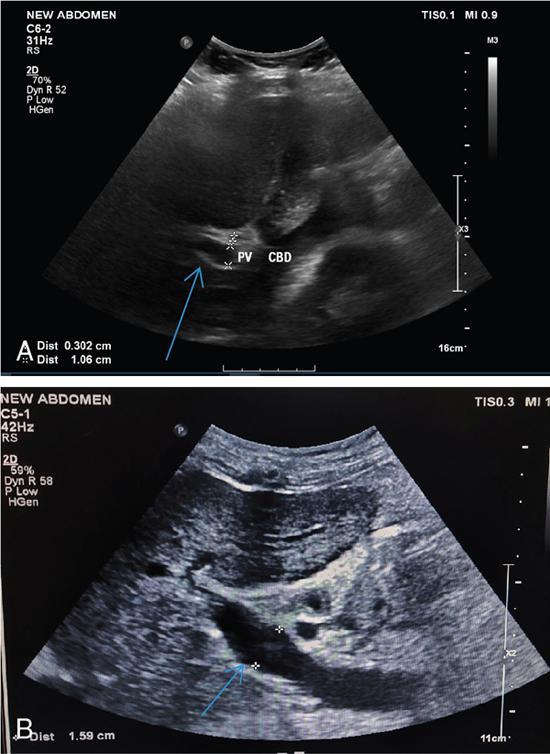
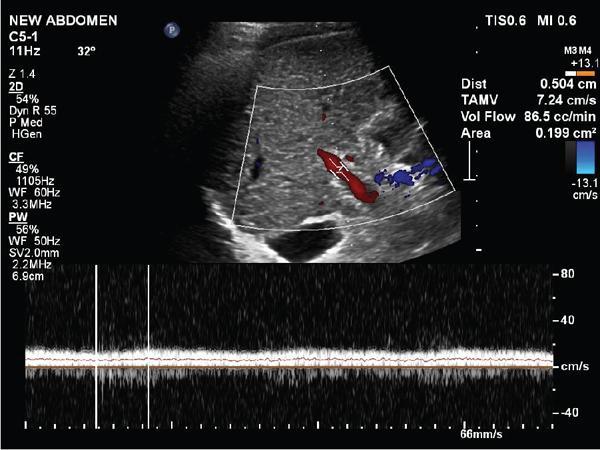
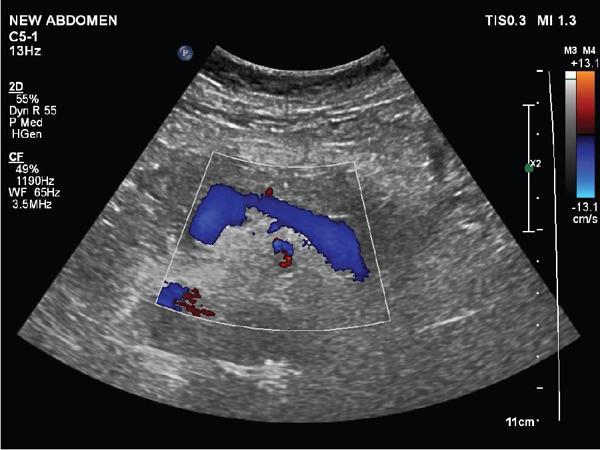
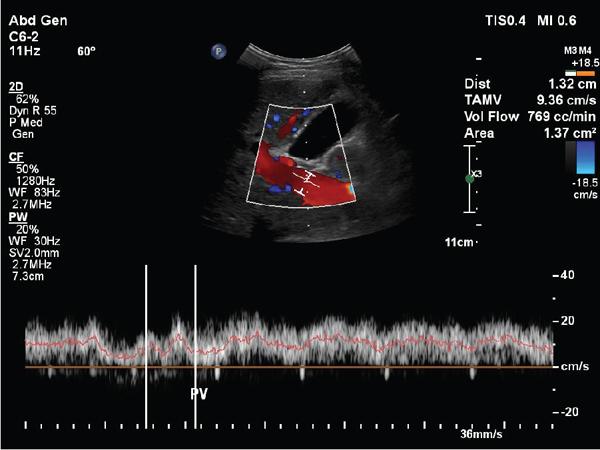
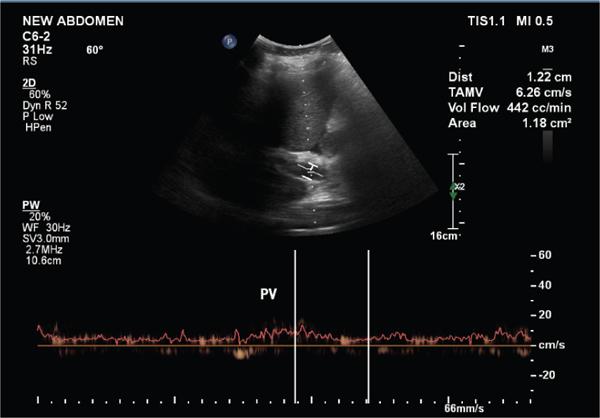
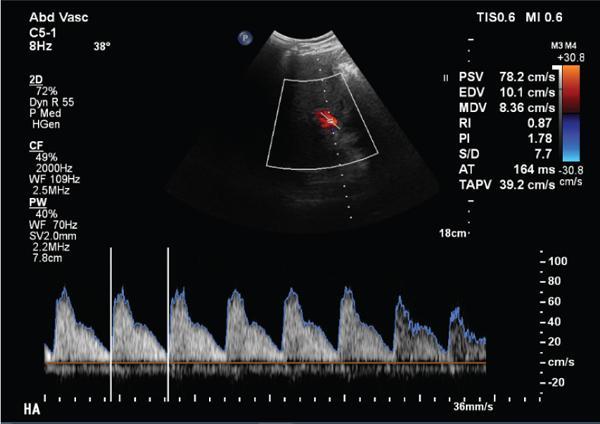
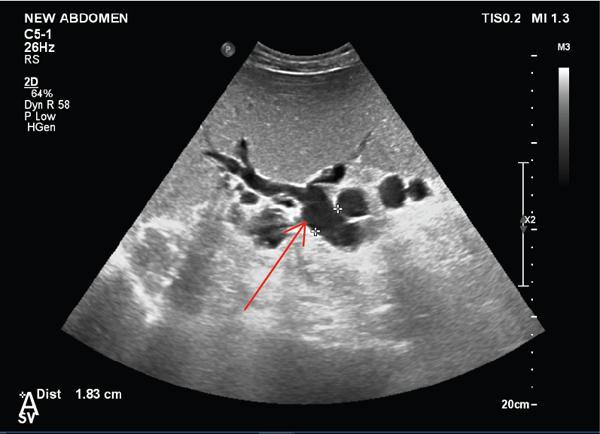
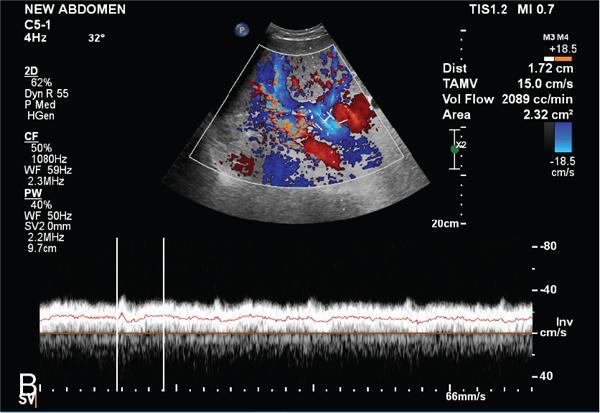
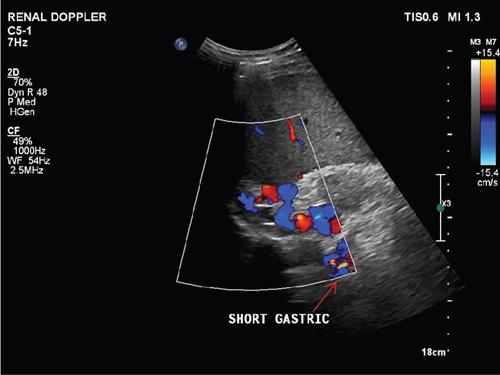
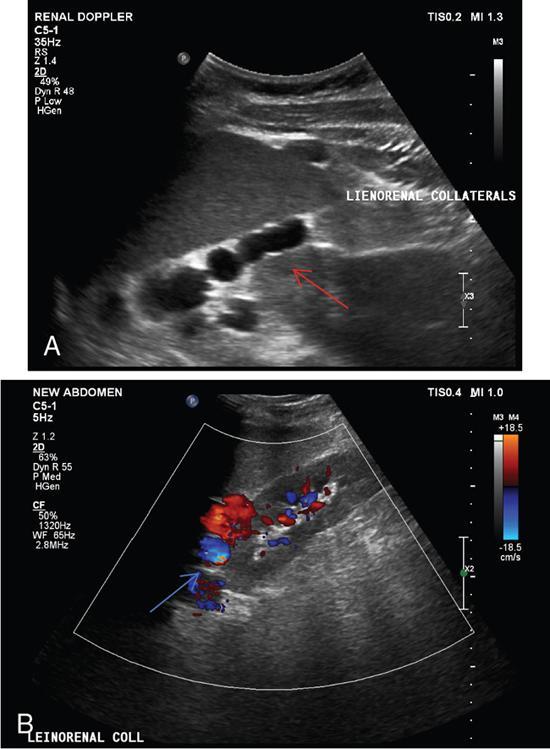
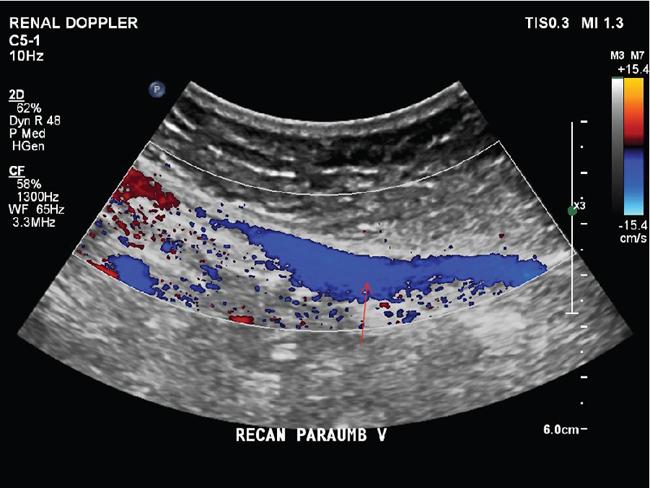
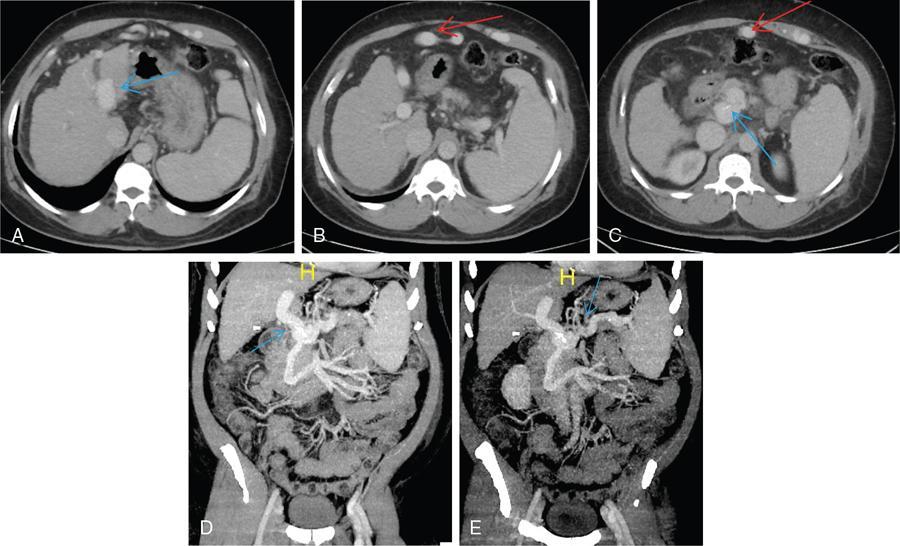
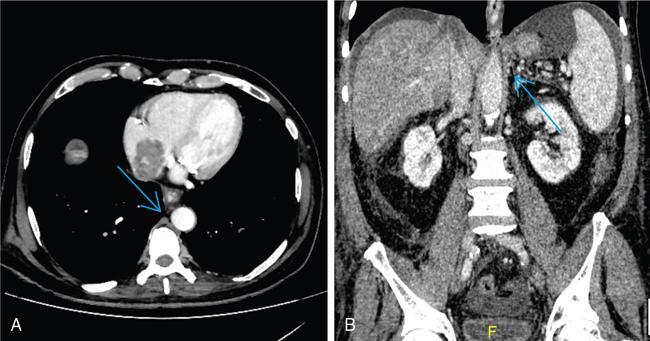
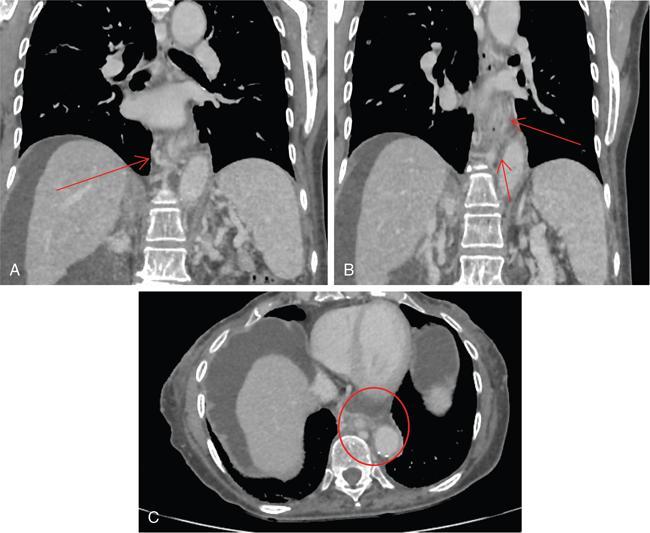
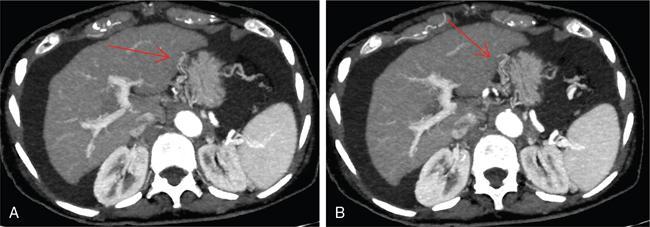
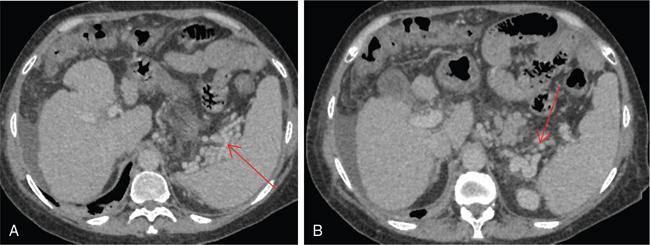
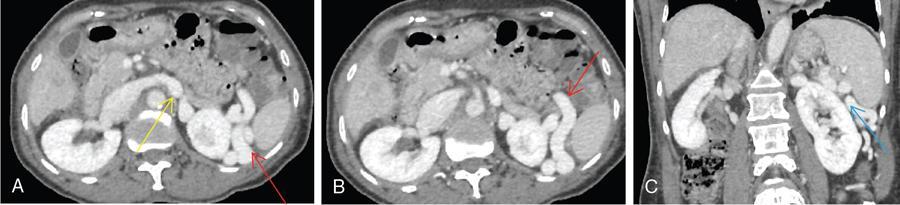
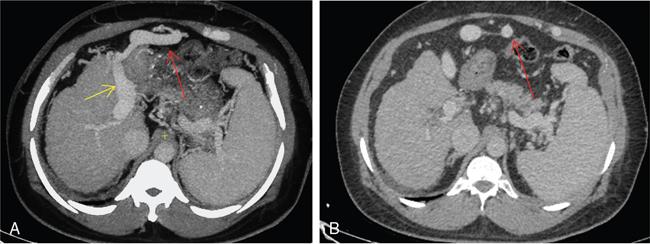
Shrinivas B. Desai, Ritu K. Kashikar, Aman Snehil, Ajay Jhaveri Cirrhosis is a late stage of irreversible scarring of the liver causing abnormality in liver structure and function. Multiple conditions and factors can cause repeated liver damage and scarring ultimately leading to cirrhosis. The most feared complication of liver cirrhosis is the development of hepatocellular carcinoma (HCC). Portal hypertension (PHT) is seen with a variety of conditions but cirrhosis happens to the most important cause. Imaging plays a vital role in noninvasive diagnosis and treatment planning of both cirrhosis and PHT. Liver imaging reporting and data system (LI-RADS) is a standardized reporting system assigning an observation risk of representing HCC. This chapter focuses on discussing aetiologies and imaging of PHT with a lucid review of L1-RADS 2018 version. The portal blood circulation is a unique circulatory circuit as it connects two capillary beds between the liver parenchyma at one end and the gastrointestinal tract and splenic parenchyma at the other end. The portal system ramifies in the liver and ultimately ends in the hepatic sinusoids from where the blood ultimately drains into the inferior vena cava (IVC). The portal vein (PV) originates from the capillary beds in the stomach, intestine and the spleen. The main PV is formed behind the neck of the pancreas by the confluence of the superior mesenteric vein (SMV) and splenic vein. It continues to the porta hepatis where it bifurcates into the left and right branches as it carries nutrient rich but oxygen poor blood to the liver (Fig. 9.9.1). The PV makes up for 75%–80% of the liver’s blood supply while the hepatic artery which arises from the celiac trunk makes up for the remaining 25%. A pathological increase in the portal venous pressure is referred to as PHT. PHT is most often a sequel of chronic parenchymal liver disease and leads to major life-threatening complications due to bleeding from the collateral circulation (most commonly oesophageal varices). Direct measurement of portal pressure (PP) is invasive and often not feasible in most patients and thus imaging plays an important role in the diagnosis of PHT and its complications. The normal portal venous pressure ranges between 5 and 10 mmHg, which is the equivalent of 7–14 cm H2O. The normal hepatic venous pressure gradient (HVPG) is the pressure gradient between the PV and the IVC, is typically 1–5 mmHg. Presence of PHT is indicated by a wedged hepatic venous pressure of more than 5 mmHg. Other definitions include a splenic pressure of more than 15 mmHg or an intraoperative PP of greater than 30 cm H2O. The complications of PHT are seen when HVPG is greater than 10 mmHg and hence this value defines clinically significant PHT. Variceal bleeding is seen with a pressure greater than 12 mmHg. In ideal conditions, the portal circuit is a high flow, low resistance circuit as it has to allow substantial flow rates of 700–1000 mL/min to the hepatic parenchyma from the gastrointestinal tract. Anatomical changes in the organization of the hepatic lobule can result in rise in the portal resistance. These can occur in the form of collagen deposition in the space of Disse, fibrotic scars formed due to regenerative nodule (RN) formation, loss of normal elasticity of the endothelium and distal venous thrombosis. Changes in splanchnic haemodynamics due to factors that increase splanchnic blood flow and increase in intrahepatic vascular resistance due to transformation of stellate cells into myofibroblasts also contribute to the increase in PP gradient. In Western countries, alcoholic cirrhosis and viral cirrhosis are the leading causes of PHT and oesophageal varices. The viral causes form majority of cases leading to cirrhosis and PHT in the Far East and Middle Eastern countries while Schistosomiasis remains an important cause in the African countries. Worldwide, nonalcoholic steatohepatitis (NASH) and hepatitis C are the emerging causes of chronic liver disease (CLD) and PHT. PHT can be classified as cirrhotic and noncirrhotic depending on whether it is associated with cirrhosis or not. This distinction is important as noncirrhotic causes like PV thrombosis are at high risk of development of bleeding but tend to have a better chance of surviving a variceal bleed than a patient with decompensated alcoholic cirrhosis due to preserved hepatic synthetic functions in the former. PHT can also be classified on the basis of the location of the pathology into prehepatic, hepatic and posthepatic causes. Hepatic causes can further be divided into presinusoidal, sinusoidal and postsinusoidal. The causes of portal hypertension have been denoted in Table 9.9.1. The direct measurement of the PP by measuring the HVPG is invasive, expensive not readily available in all patients. Thus, imaging plays an important role in the diagnosis of PHT. Various modalities are used for the imaging diagnosis of PHT. Ultrasonography (USG) and Doppler evaluation have the advantage of being inexpensive, readily available and bedside modality (Table 9.9.2). The role of ultrasound and Doppler in imaging of PHT is to: Grey scale imaging is useful in evaluating the splenoportal anatomy. The evaluation should begin with the liver morphology. Signs of cirrhosis like nodularity of the liver surface with relative atrophy of the right lobe and prominence of the left lobe and caudate should be looked for. Hepatic echotexture appears coarse and more echogenic (Table 9.9.3). Increase in portal venous diameter is a sign of PHT (Fig. 9.9.2). Portal venous diameter of more than 13 or 15 mm has low sensitivity for diagnosing PHT of only 40%–12.5%, respectively. Absolute measurement of the portal diameter as a sign of PHT is also fallacious as in presence of collateral circulation or hepatofugal flow; there may actually be a decrease in the PV diameter. Therefore, a more accurate sign is respiratory variation of PV diameter. An increase in PV diameter of less than 20% with deep inspiration has been reported to indicate PHT with a sensitivity of 80% and specificity of 100%. This has been reported to be an accurate indicator of cirrhosis. Hepatic vein straightness, uniformity of vein wall echogenicity and visualization of at least 1 cm segment of the hepatic vein are the parameters used for evaluation. Splenomegaly is defined as bipolar splenic diameter of greater than 12 cm or largest splenic cross-sectional area passing through the hilum of greater than 45 cm2, and occurs secondary to PHT (Fig. 9.9.3). A total of 65%–80% patients with cirrhosis have splenomegaly on ultrasound. Patients with cirrhosis due to viral hepatitis and primary biliary cirrhosis show splenomegaly more frequently than those with alcoholic cirrhosis. This is an accurate sign of PHT. USG is extremely sensitive with respect to detecting subclinical ascites. Perihepatic space is the most usual site of visualization of minimal ascites. In normal subjects, this ratio is approximately 0.07 and a value above 0.1 suggests the diagnosis of PHT with a 95% sensitivity and specificity. The normal spectral waveform of the hepatic artery is a low resistance flow pattern with forward flow in diastole and a resistivity index in the range of 0.5–0.7. In PHT, the resistivity index of the hepatic artery increases with high resistance flow pattern due to increased peripheral vascular resistance. Resistance index (RI) > 0.78 in the intrahepatic branches of the hepatic artery has been reported to have a sensitivity of 50% and a specificity of 100% for the detection of PHT (Fig. 9.9.11). Pulsatility index (PI) > 1.05 suggests severe PHT with a sensitivity of 86% and specificity of 88% (Fig. 9.9.11). Patency of hepatic veins should be evaluated to rule out Budd–Chiari syndrome as a cause of PHT. The normal hepatic venous waveform (HVW) reflects right atrial activity and this results in a triphasic waveform with one positive and two negative waves. In PHT, this waveform becomes monophasic or biphasic. A monophasic HVW has a sensitivity and specificity of 74% and 95%, respectively, in the diagnosis of severe PHT (Fig. 9.9.12). Dilatation of the splanchnic veins – the SMV and the splenic vein – more than 11 mm are suggestive of PHT with a sensitivity and specificity of 72% and 100%, respectively. A reduction in the respiratory variation of the splenic vein and SMV to less than 40% had a sensitivity and specificity of 79.7% and 100%, respectively, for the diagnosis of PHT (Fig. 9.9.13). The splenic artery reveals an increase in the resistivity index and an RI of >0.63 and a PI of >1 have a sensitivity and specificity of 84.6% and 70.4% for the diagnosis of PHT. Presence of portosystemic collaterals like patent paraumbilical vein, dilated left gastric and short gastric veins are 100% specific sign for PHT (Figs. 9.9.14–9.9.16). Recanalization of the paraumbilical vein, known as the Cruveilhier–Baumgarten syndrome is observed in 43% of patients with PHT, and this is the easiest collateral to assess during the US examination. Various portosystemic collaterals that occur in PHT have been discussed in details in subsection on CT findings in PHT. No Doppler parameter is considered reliable enough to measure PP with sufficient accuracy for use in clinical practice. Oesophageal varices are often present in patients with portosystemic collaterals. Appearance or increase in number of collaterals along with splenomegaly has a high association with variceal formation and growth. USG helps in diagnosis of prehepatic causes like portal stenosis or thrombosis by demonstrating the patency and morphology of the splenoportal system. Arteriovenous fistulae and tumours causing vascular thrombosis as aetiology can be readily detected. USG helps in diagnosis of features of cirrhosis and thus helps differentiate noncirrhotic causes of PHT. USG allows diagnosis of fatty liver disease, which is an emerging cause of cirrhosis. Among the posthepatic causes, USG aids in establishing the diagnosis of Budd–Chiari syndrome by demonstrating the patency and morphology of the IVC and hepatic veins. Owing to the inability of CT to detect flow direction, portal flow rates or pressure gradients, CT is not the primary modality in diagnosis of PHT. Similar to USG dilatation of portosystemic system is a feature of PHT (Fig. 9.9.17). Changes in cirrhosis if present can be seen in the form of surface nodularity, nodules and fibrous septae. CT plays an important role in diagnosis of portal venous thrombosis and evaluating its extent. An acute thrombus is seen as a hypodense filling defect in the vessel causing distension of the venous lumen. Surrounding fat stranding can be seen. A chronic thrombus appears as an eccentric filling defect usually along the wall and is often associated with decrease in vessel diameter. Calcification may be seen in chronic thrombi. Multidetector computed tomography (MDCT) is a useful tool to evaluate portosystemic collateral circulation and recognize complications of PHT. 3D angiography can help understand portal venous and complex variceal anatomy and plan treatment. The various portosystemic collaterals are discussed below. They can be classified into those draining into superior vena cava (SVC) and those draining into the IVC. Magnetic resonance imaging (MRI) is a noninvasive modality used in the evaluation of PHT without the use of ionising radiation. It provides evaluation of parenchymal abnormalities, collaterals and characterization of tumours (Fig. 9.9.28). Spin echo sequences allow characterization of liver masses and liver parenchyma. Loss of flow void allows for detection of thrombosis. Time-of-flight (TOF) angiography is useful in assessing the portal venous system and allows for successful detection of PV thrombosis. The disadvantages of TOF are motion artefacts caused by breathing, long acquisition times and incomplete coverage of the portal venous system. Novel imaging techniques include phase contrast, T1 mapping and magnetic resonance elastography (MRE). The advantage of phase contrast over TOF imaging is that phase contrast imaging acquires information regarding the flow direction in addition to the information regarding the flow velocity. On-phase contrast images signal within vessel is hyperintense when flow is cranial and hypointense when flow is caudal. Look-Locker imaging technique using gradient echo (GRE) MRI sequences with inversion recovery pulse is used to quantify fibrosis by measuring precontrast T1 relaxation times. Interventions in PHT can be aimed at diagnosis or more commonly at management of complications of PHT. HVPG measurement, which is the gold standard for the diagnosis of PHT, can be achieved through cannulation of the PV. Transjugular hepatic biopsy is another diagnostic invasive technique that also allows indirect measurement of PP. Disadvantages include deterioration of hepatic function caused by diversion of portal venous blood flow and shunt dysfunction. TIPSS is contraindicated in patients with congestive heart failure, severe pulmonary hypertension, severe tricuspid regurgitation and hepatic failure. In this technique, a catheter is advanced from the femoral vein into the outlet of the gastrorenal, usually in the region of the left renal vein. The shunt is then occluded with a balloon and sclerosant is injected retrograde to occlude the gastric varices. Histological development of RNs surrounded by fibrous septae in response to chronic liver injury, progressing PHT and end-stage liver disease is termed as cirrhosis. Although initially considered an end-stage phenomenon in CLD, recent evidence suggests that the histological fibrosis can be reversible in early stages with the initiation of specific therapies, for example, in viral cirrhosis with the initiation of antiviral therapy. The one-year mortality rate in cirrhosis varies widely from 1% to 57% depending on the occurrence of complications. Cirrhosis can have a wide variety of causes ranging from congenital to acquired and infectious to noninfectious. It is also a major aetiologic risk factor for the development of HCC. Imaging plays an important role in aetiologic diagnosis of this diverse entity as well as in the diagnosis and management of its complication and surveillance for oncological transformation.
9.9: Imaging in portal hypertension and cirrhosis with emphasis on LI-RADS
Introduction
Portal hypertension
Definition
Aetiopathogenesis and classification of portal hypertension
Intrahepatic Presinusoidal PHT
Sinusoidal PHT
Extrahepatic Presinusoidal PHT
Hepatic Schistosomiasis
Cirrhosis
Budd–Chiari syndrome
Congenital hepatic fibrosis
Noncirrhotic alcoholic liver disease
Right heart failure
Noncirrhotic portal fibrosis
Infiltrative disorders
Constrictive pericarditis
Nodular regenerative hyperplasia
Suprahepatic IVC thrombosis
Primary biliary cirrhosis or primary sclerosing cholangitis
Pulmonary hypertension
Tricuspid valve regurgitation
Intrahepatic postsinusoidal PHT
Extrahepatic presinusoidal PHT
Veno-occlusive disease
Portal vein thrombosis
Peliosis hepatis
SMV thrombosis
Hypervitaminosis A
Splenic vein thrombosis
Imaging in portal hypertension
Ultrasonography and doppler
Grey scale imaging
1. Portal vein diameter
2. Hepatic vein morphology
3. Splenic size

4. Subclinical ascites
Doppler assessment of portal hypertension (Table 9.9.4)
A. Portal vein


B. Hepatic artery
C. Hepatic veins

D. Splanchnic veins
E. Splanchnic arteries
F. Portosystemic collateral channels (Table 9.9.5)
Role of usg in aetiologic diagnosis of portal hypertension
CT scan


Role of MRI and newer techniques
Role of interventional radiology
Imaging in cirrhosis (Table 9.9.6)
Introduction and definition
INFECTIVE
BILIARY PATHOLOGY
TOXIC
AUTOIMMUNE
METABOLIC
VASCULAR
CRYPTOGENIC/ IDIOPATHIC

Related posts:


Stay updated, free articles. Join our Telegram channel

Full access? Get Clinical Tree


