Chapter 1 Imaging modalities
Left ventriculography and aortography
Percutaneous coronary intervention
Transthoracic echocardiography
Transoesophageal echocardiography
Three-dimensional echocardiography
Cardiovascular magnetic resonance
Myocardial perfusion scintigraphy
Radionuclide ventriculography (RNV)
Positron emission tomography (PET)
Cardiovascular imaging
Imaging is of paramount importance in assessment of cardiovascular disease. The diagnosis of disease has been revolutionized by the ability to gain high-resolution imaging of all aspects of the heart and vessels, and we are now able to visualize and assess function of everything ‘from the heart to the capillary’. As a result multiple modalities and approaches are used and the area has matured to a stage where it is not possible for everyone—or anyone—to have the same high level of specialist knowledge across all modalities. For the newcomer the range of options can appear confusing. Fortunately, some common approaches to cardiovascular imaging have developed that are transferable across modalities and allow anyone to pick up an image and begin to interpret what is seen. The basic things to get to grips with are the follwoing.
 Imaging planes—there is a recognizable series of imaging planes of the heart that allows anyone to orientate themselves to a particular structure based on some clues from the image.
 Diseases tend to relate to structures and areas—disease processes tend to affect a predominant area of the heart (although abnormalities in one area may affect other aspects). Different modalities are better at studying different aspects. In general:
• myocardium—MR/SPECT/PET
• cardiac function—Echo/CMR
• valve structure and function—echo
• coronaries—angiography/CT
• central vessels—MR/CT
• peripheral vessels—CT/MR/ultrasound.
 Advantages of particular modalities relate to the patient and the disease:
• Echo—acute settings, high volume, real time
• MR—unlimited by body habitus, any image plane
• CT—rapid collection of volume dataset.
 Disadvantages of modalities relate to how the images are acquired:
• Echo—range limited by penetration of ultrasound
• MR—limited by need for magnetic field, having receivers close to the patient, acquisition over several cardiac cycles
• CT—limited by need for radiation
• SPECT—limited by resolution and need for radiation.
 Availability and users—Use of modalities in different centres is best determined by available resources and local expertise. The value of any modality chosen to investigate the patient is nearly always determined by the individuals involved in the data collection:
• the ability of the physician to make the right differential diagnoses
• the ability of the operator to acquire the appropriate best-quality images
• the expertise of the individual who interprets the image.
Chest X-ray
Background
 The chest X-ray remains the most universal and simplest cardiac imaging investigation.
Advantages
 Wide availability in acute and non-acute setting in hospital.
 Provides information on structures outside the heart to aid differential diagnosis.
 Basis of more advanced techniques such as CT and angiography.
Disadvantages
 Use of radiation.
 2D.
2D.
 Compression of information from the whole of the patient’s chest into a single plane with resultant loss of information.
Pathology on chest X-ray
The key findings identified on chest X-ray that may prompt further cardiovascular imaging are:
 Changes in heart shape or size—these may be due to changes in the myocardium (hypertrophy), chamber size (left atrial enlargement, left ventricular failure) or pericardial (pericardial effusion).
 Changes in lung fields—features of fluid, either interstitial or pleural, suspicious for left ventricular failure.
 Changes in aortic shadow—aortic aneurysm, dissection.
 Changes in tissue—calcification over the heart shadow (e.g. pericardial disease or valvular calcification).
Basics of chest X-ray
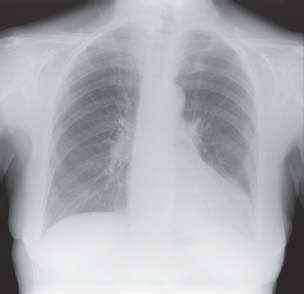
The standard chest X-ray for cardiology investigation is based on the PA (postero-anterior) projection (Fig. 1.1), but in acute settings, with patients in bed, it may be recorded in AP (antero-posterior) format. Lateral views are not often additionally required unless further information on the lung lobes or position of pacing leads is considered necessary. Following the initial chest X-ray, the usual next step is likely to be a further imaging modality.
Fig. 1.1 Chest X-ray in standard PA projection allows study of cardiac size and silhouette as well as lungs, diaphragm, and skeletal structures in the chest.
Coronary angiography
Background
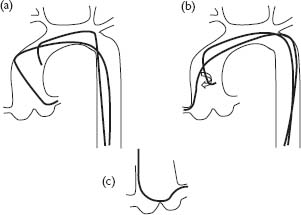
Coronary angiography is one of the first cardiovascular imaging techniques learnt during training in cardiology and is the one most closely linked to cardiology practice and sub-specialization. It is one of the oldest techniques in cardiology. The technique involves injection of radio-opaque contrast via a catheter placed in the coronary ostia (Fig. 1.2) accompanied by simultaneous fluoroscopy to provide a real-time image of coronary luminal anatomy.
Pathology and coronary angiography
Coronary angiography is excellent for studying the coronary lumen. It provides information on:
 Coronary luminal narrowing, usually caused by atherosclerosis in the vessel wall, in order to identify the number and severity of coronary stenoses that may impair distal perfusion, causing symptomatic angina.
 Rupture of coronary atheromatous plaques, central to the patho-physiology of acute coronary syndromes and myocardial infarction with possible associated presence of thrombus.
 Some indication of coronary flow through speed of filling of artery and distal microvascular appearances.
 Further potential diagnostic information central to the processs of percutaneous coronary intervention (PCI) such as anomalous coronary anatomy or dissection.
The other imaging techniques available during the coronary angiography procedure are ventriculography and aortic assessment (p 10).
 Ventriculography allows assessment of left ventricular function including regional wall motion abnormalities (when this information is not available from other imaging modalities or a second assessment is required) and severity of mitral regurgitation (based on a qualitative assessment of the amount of contrast that passes back into the left atrium). Aortic root dimensions are also demonstrated.
 Aortography is indicated for more precise assessment of the dimensions of the aortic root (particularly important in the surgical workup of aortic valve disease) and severity of aortic regurgitation (based on a qualitative assessment of the amount of contrast that passes back into the left ventricle) Aortography can also be used to identify the origin of coronary vessels or grafts.
Fig. 1.2 Positioning and shape of catheters within the aortic root. (a) The Judkins left 4 catheter is shaped to enter the left coronary ostium. (b) The Judkins right coronary catheter requires careful clockwise rotation prior to engagement of the right coronary ostium. (c) The Amplatzer catheter is shaped differently and sits across the aortic root.
Basics of coronary angiography
The team
The specialist team needed to acquire coronary angiographic data comprises an operator, a scrub nurse or assistant, a runner nurse, a cardiac physiologist, and a radiographer. The patient is continuously monitored by ECG and oxygen saturations in addition to the continuous measurement of pressure transduced from the catheter. Patients are not usually anaesthetized, which allows assessment of symptoms during the procedure, but sedation may be used.
Vascular access
Percutaneous arterial puncture is usually performed by the Seldinger technique. The most common routes of access are via the femoral or radial arteries. Occasionally, a brachial cut-down may be used when other routes of access are difficult, in which case an arteriotomy under direct vision rather than a percutaneous approach is used. Haemostasis at the end of the procedure may be achieved with manual pressure or an external compression device (such as a Femstop for femoral procedures or a TR band for radial procedures). There are a number of arterial sealing devices for femoral punctures (e.g. Angioseal® and Starclosure® devices). Once a sheath (usually 5–8 French depending on the nature of the planned procedure and the route of access) is sited in the artery, a catheter is passed over a guidewire to the aortic route. After removal of the guidewire the coronary ostia can be engaged by careful advancement and manipulation of the catheter.
Coronary catheters
The catheters used for coronary angiography and percutaneous intervention are variously shaped to facilitate engagement of the coronary otium and also to provide good back-up support to prevent the catheter backing out of the coronary ostium when angioplasty wires, balloons, and stents are advanced into the coronary artery during PCI.
Fluoroscopic projections
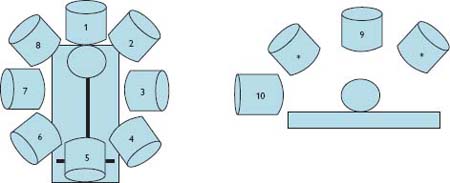
Coronary angiography provides a 2D image of what is in reality a 3D structure (i.e. the lumen of the coronary arteries as they pass around the epicardial surface of the heart). Therefore views from multiple angles are used to overcome problems of vessel overlap and foreshortening. These projections should be individually tailored to each patient’s anatomy and the area of clinical interest, and are adapted from a number of standard projections (Fig. 1.3). Further detailed images on projections can be found in Mitchell A (2008) et al. See further reading p. xix.
Fig. 1.3 X-ray cone standard positions: (1) PA cranial, (2) LAO cranial, (3) LAO, (4) LAO caudal (spider), (5) PA caudal, (6) RAO caudal, (7) RAO, (8) RAO cranial. These views are taken at an angle to the horizontal (*) with the exception of PA (9), which is taken vertically, and lateral (10), which is taken from the patient’s side.
Left ventriculography and aortography
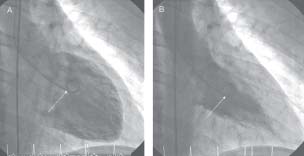
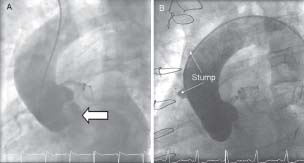
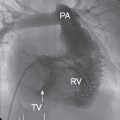
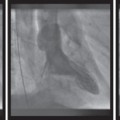
By placing a catheter in the left ventricle, injecting contrast, and then performing fluoroscopy, images in multiple planes of the left ventricular cavity can be generated (Fig. 1.4). These views can also provide a rough guide to mitral valve disease. The extent of calcification can be assessed and regurgitation quantified based on the amount of contrast that passes across the mitral valve during systole.
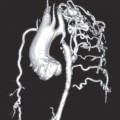
By placing the pigtail catheter in the aorta, injecting and recording fluroscopy images of the lumen of the aorta can be obtained (Fig. 1.5). This can be useful for assessment of aortic dissection or aneurysm.
Percutaneous coronary intervention
In addition to diagnostic information on the location and severity of coronary disease, coronary angiography is used to guide percutaneous intervention. Angioplasty is based on the same Seldinger principles as angiography. A fine angioplasty guidewire is passed from a guide catheter placed in the coronary ostium and used to cross the target lesion. Angioplasty balloons and subsequently stents can be guided into position along this wire. Fluoroscopy is used for direct visualization of angioplasty wires, balloons, stents, etc., thus allowing the operator to manipulate them into the desired position. Simultaneous angiography is used to delineate the target lesion during this process and to observe the effects of balloon inflation and/or subsequent stent deployment on the target stenosis and the coronary artery as a whole.
Fig. 1.4 Left ventriculogram in (A) diastole and (B) systole taken in the RAO projection. A pigtail catheter (arrowed) is placed in the LV cavity and during acquisition 35mL contrast is injected at 15mL/s via an automated injector.
Intravascular ultrasound
Background
Intravascular ultrasound (IVUS) catheters consist of an integral ultrasound probe mounted on a flexible monorail tube which can be guided along an angioplasty wire into the coronary position of interest. Ultrasound frequencies of 10–45MHz are emitted and the reflected signal is received and transmitted to an appropriate computer for analysis and image generation. A real-time image with a frame rate of around 30 frames/s is generated. Blood appears echo-lucent, so the vessel lumen appears black whilst the soft tissue features of the vessel wall are variably echo-opaque with areas of calcification reflecting most ultrasound (therefore these appear the brightest white with an area of echo drop-out beyond). The IVUS probe can be mechanically pulled back along the angioplasty wire at a preset speed (0.5m/s) allowing images along a known length of coronary artery to be obtained and the distances separating particular features to be measured.
Pathology and IVUS
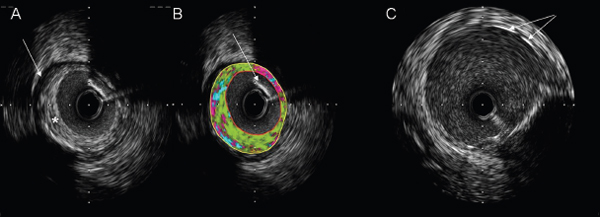
IVUS per se has not been shown to alter clinical endpoints in percutaneous intervention. However, it is useful as a clinical and research tool. In clinical practice the 3D assessment of coronary anatomy provided by IVUS can improve assessment of eccentric atheromatous plaque where angiographic appearances are equivocal or even misleading (Fig. 1.6). It can enhance assessment of complex lesions such as left mainstem lesions, bifurcation points, and calcific coronary disease (where concentric calcification may hinder conventional balloon inflation and rotational atherectomy may be preferred). IVUS enables a number of measures to be made to guide PCI, e.g. relative luminal diameter, and hence severity of stenosis, or internal elastic lamina of pre-stenotic, post-stenotic, and stenotic segments to estimate the original vessel diameter. These can be used to aid selection of optimal stent diameter. Measurement of lesion length during pullback can be used to select the best stent length. Following stent deployment, IVUS can be used to image stent apposition and identify areas of underdeployment. It also allows assessment of the effects of stent deployment on significant side branches which may be affected by both stent struts and plaque shift.
Fig. 1.6 IVUS images. (A) intracoronary image showing elliptical plaque (asterisk) around a 3mm lumen. The boundary of the external elastic lamina is clearly demarcated (arrow). (B) Post hoc image analysis can be used to estimate the plaque composition (green, fibrotic; yellow, lipid; pink, necrotic; blue, calcification). In this example the plaque is predominantly fibrotic. Note that the area of acoustic shadow cast by the angioplasty guidewire (arrow) in the top right sector leads to a misallocation of the plaque constituents in this area as being of lower echo density (i.e necrotic). (C) Image taken following stent deployment. Stent struts are seen as bright echodense points or lines (arrow).
Optical coherence tomography
Background
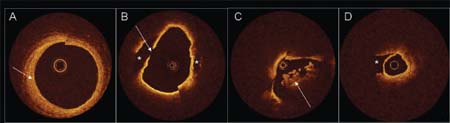
Like IVUS, optical coherence tomography (OCT) provides a crosssectional assessment of the coronary lumen and part of the vessel wall (Fig. 1.7). In the case of OCT the imaging modality used is reflected light. This provides a much higher resolution (10–20μm) image of the vessel wall than IVUS but with more limited penetration. In practical terms the OCT probe is integral to a wire which can be passed via a guide catheter into the coronary position of interest. Because red blood cells scatter light, prior to OCT imaging blood must be displaced by an optically clear medium such as an appropriate contrast or crystalloid. To image longer segments of coronary artery a proximal occlusion balloon may be inflated prior to blood dispacement and an automated pullback activated at ∼1mm/s with a frame rate of ∼15/s.
Pathology and OCT
Currently, OCT is predominantly a research tool. The high-resolution images provided allow assessment of luminal features such as thrombus, ruptured plaque, and coronary dissection. As with IVUS, the luminal diameter and length of stenotic segment can be easily measured. However, unlike IVUS, image penetration often does not allow visualization of the internal elastic lamina and therefore estimation of the original vessel diameter. OCT provides detailed images of the location and apposition of stent struts. It is also being used experimentally to assess the duration of luminal exposure of stent struts prior to re-endothelialization and neo-intima formation following PCI. Prolonged strut exposure may be a marker of the risk for in-stent thrombosis. Despite the amazing image quality provided by OCT, a precise clinical role for this imaging modality remains to be elucidated.
Fig. 1.7 Optical coherence tomography: examples of coronary cross-sectional images. (A) Saphenous vein graft showing concentric fibrous neo-intima (arrow). B. Subendothelial lipid-rich plaque (asterisks) with evidence of plaque rupture (arrow). (C) Intracoronary thrombus (arrow) in acute coronary syndrome. (D) Coronary dissection. The imaging wire is in the true lumen with the false lumen indicated by the asterisk.
Transthoracic echocardiography
Background
Echocardiography remains the most important diagnostic imaging tool in clinical cardiology practice. Since its development by Edler and Herz almost five decades ago, and routine clinical implementation a decade later, echocardiography has developed into an intuitive, comprehensible, and practical method for evaluating cardiac morphology and function rapidly and repeatedly.
Pathology and echocardiography
Echocardiography provides a rapid real-time assessment of cardiac anatomy and function (Fig. 1.8). It is indicated as a first-line test in virtually all types of cardiac pathology and can be used to guide any further imaging that is required.1
Basics of echocardiography
Ultrasound physics
 All forms of ultrasonic imaging are based on generation of high-frequency (>1MHz) acoustic pressure waves from a transducer consisting of one or more piezoelectric crystals.
 As current is passed across the crystals they deform and generate the ultrasound wave.
 The piezoelectric element also serves as a receiver. Waves returning from objects (e.g. walls, valves) deform the crystals which, in turn, generate a current that can be recorded.
 Because the velocity of sound is constant, object location (spatial resolution) can be determined based on the time it takes for a wave to return.
 The amplitude of the returning signal depends on the angle of incidence (surfaces perpendicular to the ultrasound beam are stronger reflectors) and the interface of acoustic impedances (greater differences such as occurs in the left ventricle at the tissue–blood interface lead to greater reflectivity).
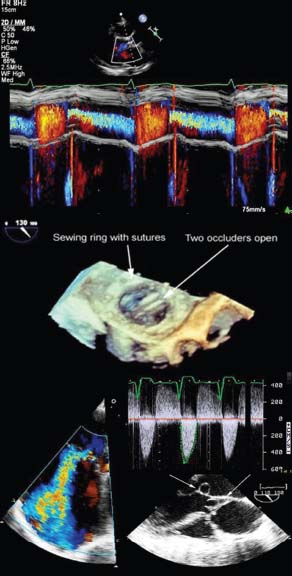
Fig. 1.8 Figure shows colour M-mode echocardiography (top), live 3D echocardiography (middle) and Doppler echocardiography (bottom).
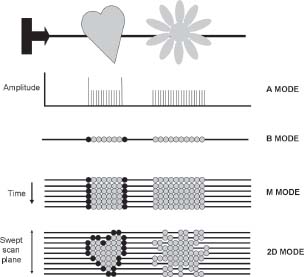
A, B, and M modes
The progress of echocardiography has followed the transition from initial images which only provided information on the amplitude of the returning ultrasound signal (A mode) in a single ‘scan line’, to representation of the amplitude as brightness (B mode). The next available image was the M or motion mode. This depicted the single scan line but represented it over time. The information has a high temporal resolution (>1kHz) and can study rapidly moving structures, but is still limited to single ‘scan line’.
2D imaging
The main echocardiography mode used today is 2D imaging. When the ultrasound beam is swept across a chosen cardiac window, rapid sequential sampling can be performed, leading to display of multiple ‘scan lines’ of information and a sector image created nearly instantaneously.
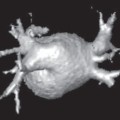
3D imaging
The natural advance of echocardiography was to sweep the ‘scan plane’ in the axis perpendicular to the 2D image and thereby generate the data to reconstruct a 3D images. Such imaging is now also a routine function.
Fig. 1.9 Types of image. The A (amplitude) mode traces the amplitude of a reflection against distance from the probe (of historical interest as one of the first types of ultrasound image). The B (brightness) mode represents amplitude as intensity or brightness of a dot. The M (motion) mode traces changes in brightness over time. 2D images are generated by sweeping across the field of interest.
A powerful aspect of echocardiography is the ability to assess the speed of movement of objects with the same equipment that generates 2D and 3D structural images. Quantification of object motion is possible with Doppler-based technologies. The principles of Doppler are as follows.
 Frequencies of returning ultrasound are shifted upwards or downwards by cells depending on whether the cells are travelling towards or away from the transducer, respectively. The amount that the frequency shifts is proportional to the velocity of the object.
 The signal intensity depends on the number of cells moving at a particular velocity.
 Velocity information is depicted as a spectral pattern over time similar to the M mode (continuous and pulsed wave Doppler) or mapped to pixels as colour overlying the 2D or 3D image (colour flow imaging) (Fig. 1.10).
 The ultrasound beam must be as parallel as possible to the target for accurate measures. Off-axis angulation by >30° leads to significant underestimation of velocities.
Pulsed wave Doppler
Pulsed wave (PW) Doppler permits accurate sampling of blood velocities averaged within a limited region of interest or ‘sample volume’.
 Transducer elements serve as both transmitters and receivers, permitting selective sampling of reflected ultrasound and accurate range or spatial information.
 PW Doppler spectral displays portray velocity vectors over time. However, the velocity range that can be presented by PW Doppler is limited by the Nyquist limit).
Continuous wave Doppler
Continuous wave (CW) Doppler involves continuous transmission of ultrasound with one transducer element while a second element serves as a receiver.
 Higher sampling rates are achieved, and consequently higher velocities, such as those found in stenotic and regurgitant lesions can be measured.
 CW Doppler does not permit ranging information to be acquired and all velocities along a scan line are included in the spectral trace.
Aliasing and the Nyquist limit
Doppler is restricted in its ability to sample high velocities by the Nyquist limit which depends on the sampling rate (the lower the frequency, the higher the evaluable velocity) and object depth (the deeper the object, the lower the sampling rate). When the frequency shift of moving objects (i.e. velocity) exceeds the Nyquist limit, aliasing occurs which precludes velocity assessment.
Fig. 1.10 Colour flow mapping. In this example colour flow Doppler has been placed across the mitral valve in a parasternal long-axis view to assess mitral regurgitation.
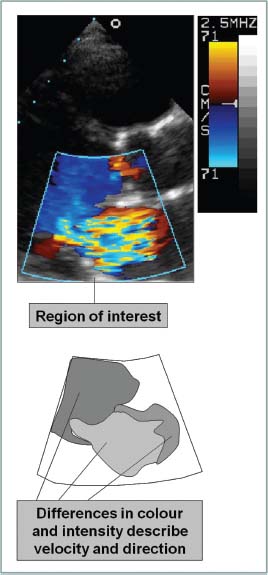
Colour flow Doppler imaging (Fig. 1.8)
Colour flow Doppler imaging employs multigate PW Doppler to portray blood flow overlying the 2D image. Information is used to detect regurgitant or stenotic lesions or shunts and qualitative assessment of velocities is possible using colour maps.
 Pixels are assigned a colour based on the scale selected by the user. Pixel colour reflects the direction and average velocity in the pixel region of interest.
 By convention, the BART colour map system is used (Blue represents flow Away from the transducer and Red represents flow Towards the transducer). The lighter the colour the higher is the velocity.
 Abnormal velocity distributions characteristic of turbulence can be mapped by including a green hue (‘variance mapping’).
 Aliasing is depicted as a mix of colours or a ‘mosaic’ pattern.
Tissue Doppler imaging
Tissue Doppler imaging (TDI) is used to assess low-velocity displacement of structures. A high-pass filter excludes higher-frequency shifts caused by red cell flow, leaving only low-velocity shifts attributable to wall motion.
 Mitral or tricuspid annular motion can be tracked and correlates with systolic and relaxation performance of the associated ventricles.
 Regional wall motion can be assessed for displacement which may be affected by overall cardiac motion or local tethering.
Doppler spectral traces can provide important information regarding flow quantitation (e.g. for assessing valve dysfunction) or timing (e.g. in dyssynchrony studies). The major use of Doppler is for assessing valve function with colour flow mapping used to demonstrate regurgitation, and CW and PW Doppler used to quantify both stenosis and regurgitation. Two key measures obtained with Doppler are pressure gradients across valves and valve area.
Pressure gradients across valves
The velocity of blood cells travelling across a narrow orifice is directly proportional to the pressure gradient at that point in time. This relationship is approximated by the simplified Bernoulli formula:
gradient (mmHg) = 4 V2
where V
Related posts:
Stay updated, free articles. Join our Telegram channel

Full access? Get Clinical Tree


