Fig. 1.
Optical components of a differential interference contrast (DIC) microscope and schematic light path. (a) Illumination light path. The arrows show the vibration directions of the light beam at different locations. (b) Imaging light path. Curves a, b, and c show the lateral distribution of the phase information for the light beams.
DIC microscopes can detect objects much smaller than the theoretical diffraction limit of light, such as unstained microtubules of 25 nm in diameter (10) and noble metal nanoparticles of <10 nm in diameter (11) (see Note 1). In addition, DIC microscopy makes full use of the numerical apertures (NA) of the objective and condenser simultaneously to create a shallow depth of focus, which allows optical sectioning with minimal interference from obscuring structures above and below the focal plane (12). Compared to other wide-field light microscopy techniques, such as bright-field, dark-field, and phase contrast microscopies, DIC microscopy provides the best image quality in terms of contrast, and lateral and axial resolutions.
A commercial DIC microscope normally comes with a green filter centered at around 540 nm, because the human eye is more sensitive to green light than other wavelengths in the visible range. However, 540-nm light is not the best wavelength to image many non-fluorescent nano-objects. As shown in Fig. 2a, the unstained microtubules of 25 nm in diameter are visible with good contrast at wavelengths shorter than 465 nm, but are barely visible at wavelengths longer than 565 nm. Another example, as shown in Fig. 2b, 30-nm silver nanospheres generate high DIC image contrasts when the sample is illuminated at the localized surface plasmon resonance (LSPR) wavelength of 420 nm.
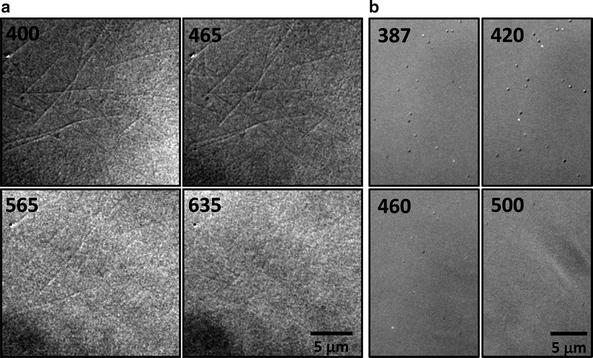
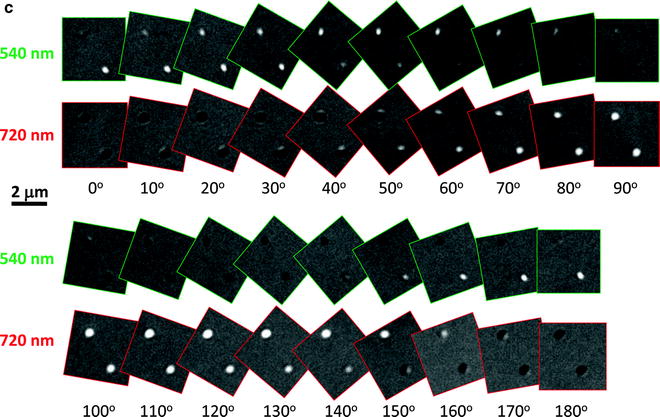
Fig. 2.
Wavelength-dependent DIC images. (a) Microtubules observed at 400, 465, 565, and 635 nm. (b) 30-nm silver nanospheres observed at 387, 420, 460, and 500 nm. (c) Orientation-dependent DIC images of gold nanorods (25 nm × 73 nm) at the longitudinal (720 nm) and transverse (540 nm) plasmon resonance wavelengths (Reprinted with permission from Wang et al. (16). Copyright 2011 American Chemical Society).
The underlying mechanism of the wavelength-dependent DIC image contrast is based on the fact that samples made of different materials show varying apparent refractive indices at different wavelengths. Thus the refractive index difference between a nanoparticle and its local environment changes at different wavelengths, which gives rise to a unique DIC contrast spectrum. By taking advantage of this effect, different nanoparticles and cellular features in the same sample can be differentiated by simply comparing the DIC contrasts at certain signature wavelengths (13).
Furthermore, wavelength-dependent DIC microscopy is capable of resolving the rotational motion of anisotropic noble metal nanoparticles (14–16). Gold nanorods appear in different DIC image patterns when positioned in different orientations and illuminated at the longitudinal and transverse plasmon resonance wavelengths (Fig. 2c). This phenomenon is quite different from the optically isotropic nanoparticles which always appear as half bright and half dark dots in DIC images. The unique DIC image patterns of gold nanorods result from the asymmetrical phase retardations imposed on the two orthogonally polarized beams split by the first Nomarski prism. The wavelength-dependent DIC image patterns can conveniently be used to distinguish gold nanorods from other cellular nano-features. The 2D orientation of gold nanorods relative to the two orthogonally polarized beams can be estimated directly from the bright and dark DIC intensities (16) or by calculating the DIC polarization anisotropy (17), which is defined as  , where I B and I D are the normalized bright and dark intensities at the longitudinal plasmon resonance wavelength, respectively. The 3D orientation of gold nanorods can also be determined in each DIC image because the bright and dark intensities are the projections of the dipole of the nanorod onto the two polarization directions (16).
, where I B and I D are the normalized bright and dark intensities at the longitudinal plasmon resonance wavelength, respectively. The 3D orientation of gold nanorods can also be determined in each DIC image because the bright and dark intensities are the projections of the dipole of the nanorod onto the two polarization directions (16).1.2 Planar Illumination Microscopy
Rayleigh scattering is another source of signal from nanoparticles. Scattering-based microscopy imaging of nanoparticles in living cells is not trivial because a cell itself is a highly scattering medium due to the presence of many particular and tubular nano- and micro-structures. Microscopic scattering images can be obtained in wide-field mode with a conventional dark-field microscope, in which oblique illumination is applied through a condenser with the center portion blocked by a disc stop, leaving only the outer ring of light for illumination. The Rayleigh scattering of light, which is spatially separated from the direct illuminating light, is collected with an objective with a NA smaller than that of the condenser.
In recent years, other types of microscopy have been developed to harvest scattering signals from nanoparticles (18–21). In this chapter, we will limit our discussion to PIM, which was originally implemented by Stelzer and coworkers (22–24) and was recently modified for tracking gold nanorods in living cells (21). The translational information of a target object is obtained through projecting the focal plane scattering signal to a CCD camera, and the rotational information is deduced from the measured anisotropic scattering signal from the gold nanorods (see Note 2).
2 Materials
2.1 Microscope Systems
1.
Nikon Eclipse 80i microscope. While a number of commercially available microscope systems offer good DIC imaging capability, the discussion here is based on an upright Nikon Eclipse 80i microscope, which can be switched conveniently between DIC mode and epi-fluorescence mode. A motorized rotary stage (model no. SGSP-60YAM, Sigma Koki, Japan) is coupled to the fine-adjustment knob on the microscope to help image sample areas with different depths. In DIC mode, the sample is illuminated through an oil-immersion condenser (NA 1.40) (see Note 3) and the optical signals are collected with a ×100 Plan Apo NA 1.40 oil immersion objective. When the sample is imaged in fluorescence mode, a mercury lamp or X-cite 120 light source (Mississauga, ON, Canada) is used (see Note 4). A dual-view filter (Photometrics, Tucson, AZ) is used when imaging at two wavelengths simultaneously. The wavelength selection is accomplished with a set of filters (purchased from Thorlabs, Newton, NJ and Semrock, Rochester, NY) with central wavelengths in the range of 380–780 nm (see Note 5) and a full width at half-maximum (FWHM) of 10 nm.
2.
PIM was setup on a similar upright microscope. The scheme of the home-built PIM is shown in Fig. 3. Light from an external halogen lamp was split evenly with a Y-shaped optical fiber bundle and focused into two thin sheets by two cylindrical lenses (with thickness around 0.2 mm), respectively, and arranged orthogonally to achieve the planar illumination. To generate in-plane polarized sheet light, a polarizer was put behind each cylindrical lens with the optical axis parallel to the surface of the cover glass. Each thin light beam was then carefully adjusted to transmit between the two cover-glasses. Scattering light from the transverse and longitudinal modes is separated by a BrightLine Cy3 filter (Semrock). To separate the X and the Y polarized light scattered from gold nanorods, a birefringent prism was placed in the detection light path.
Fig. 3.
Scheme of the home-built planar illumination system and the corresponding coordinate system for gold nanorods.
2.2 Detectors
1.
Andor iXonEM+ EMCCD camera (512 × 512 imaging array, 16 × 16 μm pixel size, Belfast, Northern Ireland) and Photometrics CoolSNAP ES CCD camera (1,392 × 1,040 imaging array, 6.4 × 6.4 μm pixel size) were used to record both the DIC and fluorescence images and videos (see Note 6).
2.
For planar illumination, the scattered light from gold nanorods was captured with a color CCD camera (DP72, Olympus, Japan) and a Photometrics CoolSNAP HQ2 CCD camera (1,392 × 1,040 imaging array, 6.4 × 6.4 μm pixel size) from the rear and the front port of the microscope, respectively. When collecting images, different exposure times are set depending on the filter transmission and light source power (see Note 7).
2.3 Materials and Reagents
1.
400-, 200-, and 100-nm Polystyrene nanoparticles from Thermo Scientific (Pittsburg, PA).
2.
25 nm × 73 nm gold nanorods from Nanopartz (Salt Lake City, UT).
3.
Glass coverslips (No. 1.5, 22 mm × 22 mm).
4.
Glass microscope slides (25 mm × 75 mm × 1 mm).
5.
T25 Cell culture flasks.
6.
Petri dishes (50 mm × 12 mm).
7.
Detergent (Contrad 70) from Fisher Scientific (Pittsburg, PA).
8.
3-Aminopropyltriethoxysilane (APTES) from Sigma (St. Louis, MO).
9.
Poly-l-lysine (PLL).
10.
100% Ethanol.
11.
Acetone (certified ACS grade).
12.
Glycerol (molecular biology grade).
13.
A549 human lung cancer cell line (CCL-185) from American Type Culture Collection (ATCC, Baltimore, MD).
14.
Kaighn’s modification of Ham’s F-12 cell culture media (F-12K medium) from ATCC.
15.
Stainless steel staining rack was obtained from Electron Microscopy Sciences.
16.
Kimwipes from Kimberly-Clark Inc.
17.
Nail polish.
2.4 Software
1.
NIH ImageJ was used to analyze the collected images and videos.
3 Methods
To achieve the best image quality in single nanoparticle imaging experiments, the sample slides must be prepared with extra care.
3.1 Cleaning Glass Slides and Coverslips
Thorough cleaning of coverslips and glass slides to remove dust and other unnecessary interfering material is an essential step towards successful imaging of target nanoparticles. A reliable cleaning procedure is as follows:
1.
Put coverslips and slides into a stainless rack; the rack can prevent the coverslips and glass slides from touching each other during the cleaning process.
2.
Immerse in 3% Contrad 70 solution and sonicate for 15 min; repeat this step one to two times.
3.
Rinse with pure water and sonicate in pure water for 15 min; repeat this step one to two times.
4.
Rinse with 100% ethanol and sonicate in 100% ethanol for 15 min; repeat this step one to two times.
The coverslips and slides can be stored in ethanol for future use. Unlike other cleaning protocols using stronger chemicals, this cleaning protocol does not alter the optical quality of the glass surface.
It is worth mentioning that high-quality coverslips of a precise thickness that matches the objective should be used to prepare the sample slides (see Notes 8 and 9). For example, the ×100 Plan Apo NA 1.4 and ×40 Plan Apo NA 0.75 objectives used in our experiments are designed to work with No. 1.5 coverslips.
3.2 Immobilizing Gold Nanoparticles on Glass Slides or Coverslips
Before imaging nanoparticles in cells, it is necessary to examine the optical properties of single nanoparticles immobilized on a surface. For positively charged nanoparticles, a clean bare glass coverslip or slide can be used directly as the substrate due to electrostatic attraction between nanoparticles and the negatively charged glass surface. For negatively charged nanoparticles, additional steps are required to immobilize nanoparticles on the glass surface. One method to immobilize the nanoparticles is to put one drop of nanoparticle solution on the surface of the coverslip and allow it to dry. However, there may be lots of aggregates due to the self-assembly during the drying process. The better method is to modify the glass surface with APTES to form positive charges on the glass surface. The surface modification procedure is as follows:
1.
Take out the rack containing the previously cleaned coverslips from the ethanol, and dry them in a 37°C oven for 1 h.
2.
Place the rack into a glass dish and add 1.5% APTES in acetone solution to fully immerse the coverslips.
3.
Set the glass dish on a shaker, and transfer them to the 37°C oven; shake for 1 h.
4.
Stop the shaker, pour out the APTES solution, and use acetone to wash the coverslips three or more times (see Note 10).
5.
Leave the rack containing the coverslips in a 104°C oven for 1 h.
6.
 Histochemical Detection of Lipid Droplets in Cultured Cells
Environmental Scanning Electron Microscopy Gold Immunolabeling in Cell Biology
Histochemical Detection of Lipid Droplets in Cultured Cells
Environmental Scanning Electron Microscopy Gold Immunolabeling in Cell Biology
 Colocalization Analysis in Fluorescence Microscopy
 Atomic Force Microscopy Functional Imaging on Vascular Endothelial Cells
 A Novel Combined Imaging/Morphometrical Method for the Analysis of Human Sural Nerve Biopsies for Clinical Diagnosis
 Environmental Scanning Electron Microscopy in Cell Biology


Transfer the rack into a desiccator for long-term storage (see Note 11).
Related posts:
Histochemical Detection of Lipid Droplets in Cultured Cells
Environmental Scanning Electron Microscopy Gold Immunolabeling in Cell Biology
Colocalization Analysis in Fluorescence Microscopy
Atomic Force Microscopy Functional Imaging on Vascular Endothelial Cells
Environmental Scanning Electron Microscopy in Cell Biology
Stay updated, free articles. Join our Telegram channel
Full access? Get Clinical Tree
