Fig. 5.1
American College of Radiology (ACR) appropriateness criteria. The ACR recently updated the appropriateness criteria for the investigation of incidental adrenal lesions. A summary from the recommendations is shown in the flow charts (a and b) [26]. The two main features in risk stratification are history of prior malignancy and the size of the adrenal lesion (1–4 cm vs >4 cm). Change in size of the lesion is the other major feature that alters decision-making once the lesion has been stratified. (a) In a patient with no history of malignancy presenting with a 1–4 cm adrenal mass, most lesions will turn out to be benign. If the lesion has been stable for at least 1 year (based on prior available studies) or has classic benign features (e.g., fat in a myelolipoma), no additional follow-up is needed. If the lesion has enlarged, then biopsy or resection is an appropriate next step. If no prior studies are available and the lesion has no suspicious features, it may be safe to follow-up in 1 year with a non-contrast CT (NCCT) or chemical shift MRI (see Figs. 5.4 and 5.5). However, if suspicious features (e.g., heterogeneity or lobulation) are present, a NCCT or chemical shift MRI should be performed immediately to determine if it represents an adenoma (see Fig. 5.4). If the lesion remains indeterminate, contrast-enhanced CT using washout technique (see Fig. 5.7) should be the next step. If the lesion does not meet imaging criteria for a benign lesion at this point, a biopsy may be appropriate after a pheochromocytoma has been excluded with biochemical work-up. An incidentally discovered adrenal mass measuring greater than 4 cm in a patient with no history of malignancy, is generally resected if it is not consistent with an adenoma, myelolipoma, hematoma, or simple cyst. In this situation, CT or MRI with contrast is recommended for staging purposes only. (b) In a patient with a history of malignancy and an incidental 1–4 cm adrenal nodule, the nodule need not be worked-up further if the patient has metastatic disease elsewhere and the presence of an additional metastasis in the adrenal gland would not alter therapy. However, in the absence of metastatic disease elsewhere, this nodule should be worked-up further with PET-CT, NCCT, or chemical shift MRI if the lesion does not have imaging features that are diagnostic for a benign lesion. If the lesion does not behave like a typical adenoma on any of these studies, then an adrenal CT with washout should be performed. At this point if the lesion does not behave like an adenoma, a biopsy should be performed. In a patient with a history of cancer and an adrenal mass greater than 4 cm, a biopsy or PET-CT should be performed
This chapter will discuss both common and uncommon adrenal masses in adults (pediatric tumors are discussed in Chap. 10). Adenoma is by far the most common benign tumor of the adrenal gland. Although uncommon, myelolipoma is the next most frequent benign tumor of the adrenal gland. Pheochromocytoma and hemangioma are rare benign tumors. Hyperplasia and cysts are benign non-neoplastic entities that will also be discussed. Metastatic disease is by far the most common malignant tumor of the adrenal gland, although less common than adenoma, even in patients with known primary malignancy. Adrenal cortical carcinoma is the most common primary malignant tumor of the adrenal gland in adults, but is still rare, with an annual incidence of approximately 1–2 cases per million [24, 27, 28]. Although up to 4 % of patients with non-Hodgkin lymphoma have adrenal involvement [28], primary adrenal lymphoma is extremely rare. Other extremely rare, primary malignant adrenal tumors include sarcoma (the few reported cases including leiomyosarcoma and angiosarcoma) and melanoma.
Normal Anatomy and Imaging Techniques
Anatomy
The right adrenal gland is located superior to the upper pole of the right kidney, lateral to the crus of the diaphragm, medial to the right lobe of the liver, and just posterior to the inferior vena cava. The left adrenal gland is located anteromedial to the upper pole of the left kidney, lateral to the crus of the diaphragm, and lateral or slightly posterior to the abdominal aorta.
Each gland has two main components with different embryologic origins: the inner core, or adrenal medulla, which is thinner and arises from the neural crest, and the outer adrenal cortex, which is thicker and arises from the mesothelium. The cortex has three distinct divisions with separate functions: the zona glomerulosa, zona fasciculata, and zona reticularis secrete aldosterone, cortisol, and androgens, respectively. Catecholamines are secreted by the adrenal medulla. Eighty percent of the adrenal medulla secretes adrenaline (epinephrine) and 20 % secretes noradrenaline (norepinephrine). The adrenal glands have a very rich arterial supply: the superior adrenal artery arising from the inferior phrenic artery, the middle adrenal artery arising from the abdominal aorta, and the inferior adrenal artery arising from the renal artery. The suprarenal veins drain directly to the inferior vena cava (IVC) on the right and to either the left renal vein or the left inferior phrenic vein on the left.
Fig. 5.2
Normal anatomy. (a, b) Contrast-enhanced CT demonstrates the classic appearance of the adrenal glands, which are seen at the same level in this case. (c) Contrast-enhanced CT in a different patient demonstrates a triangular-shaped left-adrenal gland, which is one of a number of normal variants in the shape of the left adrenal gland
On cross-sectional imaging, the shape of the adrenal glands is quite variable [29]. The right adrenal gland typically has an inverted V or Y shape in the axial plane (with symmetric or asymmetric limbs), and less often horizontal or K-shaped. The left adrenal gland tends to be more variable in shape, appearing like an inverted V, an inverted Y, linear, or triangular [30]. However, it is usually an abnormal increase in thickness of the adrenal gland on axial images, rather than length, that triggers further investigation.
Imaging Techniques
CT and MRI are the primary imaging modalities used to evaluate adrenal lesions. Depending on the clinical scenario, CT can be performed as a non-contrast study, a contrast study (with images acquired 80 seconds post contrast injection), or a combination of the two with additional delayed acquisition at 15 min post contrast (a three-phase study). If the entire abdomen is scanned, oral contrast is generally utilized; if the examination is limited to the adrenal glands only, oral contrast is generally unnecessary. Images can be reconstructed at 5 mm intervals for a general abdomen, or at 2.5 mm intervals for a dedicated adrenal imaging study. Sagittal and coronal reconstructed images are also generated. The dedicated adrenal MR protocol at our institution includes high-resolution axial and coronal spoiled gradient-echo T1-weighted in-phase (TE 4.2 ms at 1.5 T) and out-of-phase images (TE 1.2 ms at 1.5 T) with a 4 mm slice thickness and 1 mm gap. We also perform axial T2 fast spin-echo images with fat saturation and coronal single-shot fast spin-echo (SSFSE) images. Gadolinium is not necessary for the work-up of adenomas, which represent the majority of adrenal masses.
Fig. 5.3
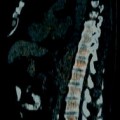
MR imaging technique. (a, b) These are high-resolution axial in-phase (a) and opposed-phase (b) gradient-echo T1WI images through the right adrenal gland, which are the critical images needed to diagnose adrenal adenomas
Pathology
Benign Tumors
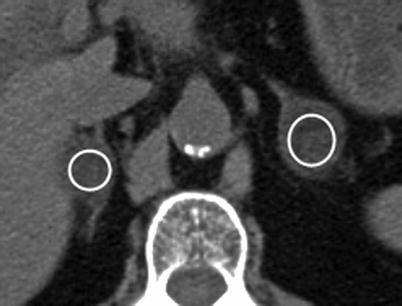
Fig. 5.4
Adrenal adenoma: NCCT. This NCCT demonstrates bilateral adrenal nodules (shown with circular regions of interests [ROIs]) measuring 1 HU on the right and −17 HU on the left, consistent with adenomas. Due to the presence of intracellular lipid within these lesions, the mean attenuation of adenomas is significantly lower on NCCT than nonadenomatous lesions [31]. Given this fact, many adenomas, specifically those that are lipid-rich, can be confidently diagnosed by CT-densitometry
When drawing a ROI to measure attenuation, the following key technical points should be noted. The ROI must be drawn on a noncontrast-enhanced CT study; the size of ROI should be representative of the whole lesion (e.g., >50 % surface area included on an axial image)—this will also reduce noise artifact; the ROI should be placed in the center of the lesion to avoid measuring adjacent retroperitoneal fat. In addition, areas of hemorrhage or necrosis should be avoided. The most commonly used cutoff to diagnose a lipid-rich adenoma is 10 HU, such that those lesions measuring less than 10 HU are consistent with lipid-rich adenomas whereas those measuring more than 10 HU can represent either lipid-poor adenomas or nonadenomas. Using a value of 10 HU to make the diagnosis of adenoma has a sensitivity of 71 % and specificity of 98 % [32]. If a cutoff value of 0 HU is used, the specificity becomes 100 %, but the sensitivity drops to 47 % [31]. Alternatively, a cutoff value of 20 HU would have a higher sensitivity (88 %), but would result in an unacceptably high false-positive rate, with a specificity of only 84 %.
Fig. 5.5
Adrenal adenoma: MRI. (a) Contrast-enhanced CT in this patient with breast cancer demonstrates an incidentally detected 2.7 cm left adrenal nodule (arrow). A dedicated adrenal MRI was subsequently performed to determine if this nodule represents an adenoma. (b) Axial T1-weighted in-phase gradient-echo (GRE) image demonstrates that the adrenal nodule (arrow) is intermediate in signal (relative signal intensity of 75 [not shown]; this represents a unit-less number used for comparison purposes only). (c) Opposed-phase GRE sequence through the same lesion (arrow) demonstrates that the lesion is now very low in signal (relative signal intensity dropped from 75–17) consistent with a lipid-rich adenoma. (d) The same lesion (arrow) on this T2FS sequence demonstrates intermediate T2 signal, which is not specific for an adenoma
In-phase (ip) and opposed-phase (or out-of-phase [op]) sequences are based on the principles of chemical shift imaging, which relies on differences in resonance frequencies within a given voxel between fat and water, with fat protons processing at a lower frequency than water protons. Thus, at certain times (TE of 4.2 ms on 1.5 T magnets), water and fat protons are in-phase and their signals will add together. At a time halfway between each in-phase time (TE of 2.1 ms with 1.5 T magnet), the fat and water protons will be out of phase within a given voxel, thus cancelling or demonstrating signal loss on opposed-phase sequences. Since lipid-rich adenomas contain both microscopic fat and lipid within the same voxel, these lesions demonstrate signal loss from the in-phase images to the out-of-phase images. With lipid-rich adenomas, this method can usually be performed qualitatively by visually determining if there is signal drop-out on opposed phase images. However, in cases where the signal loss is not so obvious, the lesions may also be evaluated quantitatively by placing ROI cursors over representative portions of the lesion and calculating the ratio of the in-phase signal (SI[ip]) of the lesion to the opposed-phase signal (SI[op]) at the same location. The spleen should be used to standardize the signal intensities between the two phases (the spleen should theoretically have the same SI value on in-phase and out-of-phase images, and thus, is used as the reference standard) such that: adrenal lesion to spleen SI ratio (op)/adrenal lesion to spleen SI ratio (ip) ≤0.71 is consistent with a lipid-rich adenoma [33].
Fig. 5.6
Adrenal adenoma: NCCT versus MRI. (a) NCCT demonstrates a right adrenal nodule that measures 23 HU (circular ROI on adrenal nodule), not consistent with a lipid-rich adenoma. (b, c) Chemical shift MRI with in-phase (b) and opposed phase (c) sequences demonstrating mild signal loss on opposed phase image (approximately 20 % dropout) indicating the presence of some intracellular lipid, and thus, consistent with an adenoma (arrows on adrenal nodule in b, c)
It can be assumed that adrenal adenomas, which contain sufficient lipid to measure less than 10 HU on noncontrast CT, will also have sufficient lipid to demonstrate qualitative signal loss with chemical shift imaging. However, for adenomas that measure more than 10 HU on NCCT, at what threshold will these lesions have insufficient lipid to be detected with chemical shift MRI? A study by Haider et al. [34], answered this question: for those adenomas measuring between 10 and 20 HU on NCCT, 100 % of these lesions demonstrated sufficient signal loss on chemical shift imaging to be confidently diagnosed as adenomas. For adenomas measuring 20–30 HU on NCCT, 75 % demonstrated significant signal loss on opposed phase images. However, for adenomas measuring more than 30 HU on NCCT, only 13 % demonstrated signal loss on opposed phase images [34]. Thus, they concluded that chemical shift MRI can still be of value for adrenal lesions that measure between 10 and 30 HU. The sensitivity of chemical shift imaging in distinguishing benign from malignant lesions has been reported to be 81–100 %, with the specificity ranging from 94 to 100 % [35]. Signal loss on chemical shift imaging is pathognomonic for the presence of lipid and water in same voxel, thus, indicating an adenoma or, much less frequently, a myelolipoma (also a benign lesion), the latter of which can contain trace amounts of fat mixed with soft tissue in the same voxel. Some ACCs also contain enough lipid to demonstrate signal loss with chemical shift imaging; however, ACC is a rare lesion, is generally large and heterogenous compared to adenomas, and demonstrates patchy areas of signal loss on the opposed phase images, in contrast to adenomas, which demonstrate uniform signal loss [36].
The key limitation of using NCCT alone to evaluate lipid content is that approximately 30 % of adenomas are lipid poor and will demonstrate an attenuation more than 10 HU on NCCT [32]. Given this limitation, an alternative technique has been developed that relies on the following principle: although both adenomas and malignant lesions enhance rapidly after IV contrast administration, the rate of washout is faster in adenomas than malignant lesions due to the presence of leaky capillaries in the latter [37]. As a result, measuring the percentage washout of contrast material on delayed images (different studies have used delayed imaging times ranging from 10 to 15 min) has been shown to be both a sensitive and specific method to identify adenomas. The washout method is only valid for lesions that are relatively homogenous in attenuation. The diagnosis of an adenoma cannot be made in lesions that contain large areas of low attenuation (often representing hemorrhage and/or necrosis) because these areas generally do not enhance significantly [3].
Fig. 5.7
Adrenal adenoma: CT washout technique. (a) Absolute washout technique: this protocol uses unenhanced, portal venous phase (approximately 70 or 80 s post injection) and 15-min delayed post-contrast images. The mean attenuation of the lesion is measured at each phase, and the resultant measurements are applied to the following formula yielding the absolute percentage washout (APW): ![$$[APW=(H{U}_{\text{portal venous}}-H{U}_{15\mathrm{min}})\text{}/(H{U}_{\text{portal venous}}-H{U}_{\text{preconstrast}})\times 100]$$](/wp-content/uploads/2016/03/A209930_1_En_5_Chapter_IEq00051.gif) If the APW equals 60 % or greater, then the lesion is consistent with an adenoma (sensitivity and specificity of 89 and 95 %, respectively, for lipid-poor adenomas) [38]. (A) This bar graph demonstrates a theoretical example of a lipid poor adenoma with a precontrast attenuation of 20 HU. The attenuation of the lesion is 80 HU in the portal venous phase (B) and 30 HU at 15 min (C). Utilizing the above formula, the calculated washout percentage equals 50/60, or 83 %, consistent with an adenoma. When one uses this technique to characterize an adrenal lesion, the images should be checked immediately after the precontrast images are performed, because if the lesion measures less than 10 HU, confirming the presence of a lipid-rich adenoma, the study can be terminated before the contrast injection. (b) Relative washout: the absolute washout method requires that a noncontrast CT be performed first, which is not routinely performed in most abdominal CT protocols. Therefore, if an adrenal lesion is incidentally detected at the time of a contrast-enhanced study while the patient is still on the table, delayed images can still be performed and the relative percentage washout (RPW) can be calculated (without precontrast images) as follows: RPW = (HUportal venous – HU15 min)/(HUportal venous) × 100. If RPW is greater than or equal to 40 %, then the lesion is consistent with an adenoma with sensitivity and specificity of 93 and 98 %, respectively for lipid-rich adenomas, and 83 and 93 % for lipid poor adenomas [38]. The bar graph demonstrates the relative washout calculation for the same theoretical lesion: 50/80 = 63 %. Since this value is greater than 40 %, the lesion is consistent with an adenoma. A precontrast attenuation; B attenuation at portal venous phase; C attenuation at 15 min
If the APW equals 60 % or greater, then the lesion is consistent with an adenoma (sensitivity and specificity of 89 and 95 %, respectively, for lipid-poor adenomas) [38]. (A) This bar graph demonstrates a theoretical example of a lipid poor adenoma with a precontrast attenuation of 20 HU. The attenuation of the lesion is 80 HU in the portal venous phase (B) and 30 HU at 15 min (C). Utilizing the above formula, the calculated washout percentage equals 50/60, or 83 %, consistent with an adenoma. When one uses this technique to characterize an adrenal lesion, the images should be checked immediately after the precontrast images are performed, because if the lesion measures less than 10 HU, confirming the presence of a lipid-rich adenoma, the study can be terminated before the contrast injection. (b) Relative washout: the absolute washout method requires that a noncontrast CT be performed first, which is not routinely performed in most abdominal CT protocols. Therefore, if an adrenal lesion is incidentally detected at the time of a contrast-enhanced study while the patient is still on the table, delayed images can still be performed and the relative percentage washout (RPW) can be calculated (without precontrast images) as follows: RPW = (HUportal venous – HU15 min)/(HUportal venous) × 100. If RPW is greater than or equal to 40 %, then the lesion is consistent with an adenoma with sensitivity and specificity of 93 and 98 %, respectively for lipid-rich adenomas, and 83 and 93 % for lipid poor adenomas [38]. The bar graph demonstrates the relative washout calculation for the same theoretical lesion: 50/80 = 63 %. Since this value is greater than 40 %, the lesion is consistent with an adenoma. A precontrast attenuation; B attenuation at portal venous phase; C attenuation at 15 min
If the APW equals 60 % or greater, then the lesion is consistent with an adenoma (sensitivity and specificity of 89 and 95 %, respectively, for lipid-poor adenomas) [38]. (A) This bar graph demonstrates a theoretical example of a lipid poor adenoma with a precontrast attenuation of 20 HU. The attenuation of the lesion is 80 HU in the portal venous phase (B) and 30 HU at 15 min (C). Utilizing the above formula, the calculated washout percentage equals 50/60, or 83 %, consistent with an adenoma. When one uses this technique to characterize an adrenal lesion, the images should be checked immediately after the precontrast images are performed, because if the lesion measures less than 10 HU, confirming the presence of a lipid-rich adenoma, the study can be terminated before the contrast injection. (b) Relative washout: the absolute washout method requires that a noncontrast CT be performed first, which is not routinely performed in most abdominal CT protocols. Therefore, if an adrenal lesion is incidentally detected at the time of a contrast-enhanced study while the patient is still on the table, delayed images can still be performed and the relative percentage washout (RPW) can be calculated (without precontrast images) as follows: RPW = (HUportal venous – HU15 min)/(HUportal venous) × 100. If RPW is greater than or equal to 40 %, then the lesion is consistent with an adenoma with sensitivity and specificity of 93 and 98 %, respectively for lipid-rich adenomas, and 83 and 93 % for lipid poor adenomas [38]. The bar graph demonstrates the relative washout calculation for the same theoretical lesion: 50/80 = 63 %. Since this value is greater than 40 %, the lesion is consistent with an adenoma. A precontrast attenuation; B attenuation at portal venous phase; C attenuation at 15 minFig. 5.8
Lipid poor adrenal adenoma: absolute CT washout. These images are from a patient with breast cancer with an incidentally detected indeterminate adrenal nodule on contrast-enhanced chest CT (not shown). A dedicated adrenal protocol CT was subsequently performed to work-up this lesion. (a) NCCT from this study demonstrates that the nodule (arrow) measures 25 HU, not consistent with a lipid-rich adenoma. The portal venous phase (b) and 15-min delayed image (c) demonstrates that the nodule measures 98 HU and 46 HU, respectively. The APW is calculated as follows: (98–46)/(98–25) = 52/73 = 71 % absolute washout. Thus, this lesion is consistent with a lipid-poor adenoma by CT criteria. Park et al. [39] compared CT washout with quantitative chemical shift imaging and found the sensitivity, specificity, and accuracy using absolute washout to diagnose adenomas to be 100 % (37 of 37), 83 % (5 of 6), and 98 % (42 of 43), respectively, versus 41 % (15 of 37), 100 % (6 of 6), and 49 % (21 of 43), for chemical shift MRI. This study and others suggest that CT washout is superior to chemical shift MRI for diagnosing adrenal adenomas [39]
Fig. 5.9
Myelolipoma: CT. (a) This contrast-enhanced CT demonstrates a small fat attenuation nodule (arrow) in the left adrenal gland consistent with a classic myelolipoma. Axial (b) and coronal reconstruction (c) images from a contrast-enhanced CT on a different patient demonstrate an 18 cm left adrenal mass containing large areas of gross fat intermixed with areas of soft tissue, also consistent with a myelolipoma. This lesion could potentially be confused with a retroperitoneal liposarcoma. The key distinguishing feature, however, is that this mass is inseparable from the left adrenal gland in (c) (arrowhead), and consequently, displaces the kidney inferiorly. This lesion is also very well-circumscribed, a feature that is more typical of myelolipoma than liposarcoma. Note the small calcification within the lesion (arrow). (d) This contrast-enhanced CT demonstrates a 5 cm left adrenal mass composed predominantly of soft tissue, but with a small focus of gross fat (arrow), also consistent with a myelolipoma
Myelolipoma is one of the most common adrenal neoplasms (following adenoma and metastasis). In one large series of patients without known malignancy, myelolipomas represented 6 % of all adrenal masses [20]. They are usually clinically silent with no known malignant potential and are usually discovered incidentally. Occasionally, large myelolipomas may cause pain due to hemorrhage, necrosis, or compression of adjacent structures [28, 40]. Myelolipomas are composed of mature adipose tissue with variable amounts of hematopoietic tissue (erythroid and myeloid) [28, 40]. Often one component can predominate over the other, but only a small amount of gross fat is required to make the diagnosis; in fact, the presence of macroscopic fat (measuring between −30 and −100 HU) within an adrenal mass on cross-sectional imaging is virtually diagnostic of myelolipoma because adrenal lipomas and liposarcomas are extremely rare, and adenomas and ACC contain microscopic (rather than macroscopic) intracellular lipid [28, 40]. Up to 20 % of myelolipomas contain calcifications from prior hemorrhage [41]. Myelolipoma can occasionally be confused with a retroperitoneal liposarcoma that arises adjacent to the adrenal gland or an angiomyolipoma arising in the upper pole of the kidney; however, if one can confirm that the lesion actually arises from the adrenal gland, the diagnosis of myelolipoma should be made.
Fig. 5.10
Myelolipoma: MRI. (a) NCCT on a patient with a 7 cm left adrenal myelolipoma. Note that the lesion is predominantly fatty in attenuation with a small focus of soft tissue (arrow) and punctate calcifications (arrowhead). (b) Axial T1WI in-phase without fat saturation demonstrates that the same lesion is predominantly high in signal except for the small focus of non-fatty tissue (arrow). (c) This T1 out-of-phase image demonstrates a band of low signal (arrow) at the interface between fat and soft tissue caused by the cancellation of lipid and water protons in the same voxel (the so-called “India ink” artifact because it appears as if someone has outlined these structures with ink). (d) This T2WI with fat-saturation (same lesion) demonstrates that the majority of the lesion is low in signal due to saturation of the fat. However, the non-fatty soft tissue component (arrow) is high in signal. (e, f) This 18 cm left adrenal myelolipoma (same patient as in Fig. 5.9b and c) is shown on T1-weighted fat-suppressed spin-echo (T1FS) pre- (e) and post- (f) gadolinium. Note that the non-fatty component (arrow in f) demonstrates a greater degree of enhancement than the fatty component. The MR features of myelolipomas vary depending upon the amount of fat within the lesion. The fatty components of these lesions are bright on T1WI, intermediate signal on T2WI, and low in signal on fat-saturated sequences (both T1 and T2). In fact, loss of signal in an adrenal mass on fat-saturated sequences confirms the presence of fat, and thus, the diagnosis of myelolipoma [28]. The non-fatty soft tissue components are low to intermediate signal on T1WI and heterogeneously hyperintense on T2WI [28]. The solid components enhance more than the fatty components
Unlike adenomas, myelolipomas do not typically demonstrate signal loss on opposed-phase sequences because the lipomatous components are usually “bulk” fat, rather than the microscopic intracellular fat seen with adenomas. As a result, myelolipomas demonstrate “India ink” artifact at the interface between the bulk fat and soft tissue components. A minority myelolipomas, however, will show some signal loss on opposed phase sequences if small fatty components are mixed with non-fatty components in the same voxel.
Fig. 5.11
Pheochromocytoma: CT. (a) This portal venous phase contrast-enhanced CT in a 67-year-old man with melanoma demonstrates a hypervascular 2 cm left adrenal mass that proved to be a pheochromocytoma at pathology. The imaging features are typical of a small pheochromocytoma, but are nonspecific, and the lesion was thought to represent metastatic melanoma prior to biopsy. The patient had hypertension but no other symptoms typically seen with pheochromocytoma. (b, c) This contrast-enhanced CT demonstrates a 3.5 cm right adrenal mass (arrows) that is hypervascular in both the arterial (b) and portal venous phases (c) in a patient who presented with headaches, diaphoresis, chest pain, and markedly elevated catecholamines (although only mild hypertension). Note that the mass lies just posterior to the IVC (arrowhead). (d) Slightly more inferiorly, the mass contains foci of low attenuation (arrows) consistent with necrosis. A hypervascular adrenal mass in a patient with elevated catecholamines is pathognomonic for pheochromocytoma
Pheochromocytoma is a catecholamine-secreting tumor arising from neuroectodermal tissue in the adrenal medulla. Common symptoms that suggest the diagnosis include paroxysmal (episodic or sporadic) hypertension, palpitations, tachycardia, headaches, anxiety, diaphoresis, flank pain, pallor, and weight loss, among other symptoms. The diagnosis is confirmed by the presence of elevated plasma or urinary catecholamines. Thus, cross-sectional imaging (CT and MRI, less often metaiodobenzylguanidine [MIBG] scan) is not generally used to make the diagnosis but rather to localize a known pheochromocytoma. CT demonstrates a mass that usually measures between 2 and 5 cm. Solid (noncystic) pheochromocytomas are classically hypervascular in both the arterial and portal venous phases following contrast administration with slow washout. The enhancement pattern can be quite variable, however; some tumors can demonstrate hypervascularity in the arterial phase with early washout, whereas others can demonstrate moderate or slow enhancement with early or delayed washout. Small tumors are typically homogeneous in attenuation whereas larger tumors frequently demonstrate areas of cystic degeneration due to hemorrhage and necrosis, which appear as areas of lower attenuation on contrast-enhanced CT. Small, homogenous pheochromocytomas typically measure between 40 and 50 HU on NCCT. However, noncontrast images alone can be deceiving if the tumor is predominantly necrotic, because necrotic areas can measure less than 10 HU, mimicking an adenoma (pheochromocytoma is one cause of false positives when utilizing CT-densitometry to make the diagnosis of an adenoma). Nevertheless, when contrast-enhanced images are also performed and the appropriate clinical and laboratory data are available, pheochromocytoma should rarely be mistaken for an adenoma.
Fig. 5.12
Pheochromocytoma: MRI. (a) Arterial phase post-contrast image in this patient with Von Hippel-Lindau syndrome (VHL) demonstrates a 7 mm homogenously hypervascular nodule (arrow) in the lateral limb of the left adrenal gland consistent with a pheochromocytoma. There is no associated necrosis with this small nodule. (b) The same lesion (arrow) on this T2FS image is mildly hyperintense, yet lower in signal than the fluid seen in an adjacent pancreatic tail cyst (arrowhead). (c) This SSFSE T2WI without fat saturation demonstrates a 3.5 cm left adrenal nodule that proved to be a pheochromocytoma. Note the fluid–fluid level (arrow) indicating a cystic, necrotic component which is very high in T2 signal. (d) This T1FS precontrast image of the same lesion demonstrates that the mass is mildly hyperintense due to hemorrhage. (e) Post-contrast T1WI in the portal venous phase shows that the mass is largely necrotic with multiple enhancing septations consistent with small areas of viable tumor (arrows)
The solid components of pheochromocytomas are moderately hyperintense in T2 signal, whereas the cystic, necrotic components are very bright on T2WI. These lesions are low to intermediate signal on T1WI but can contain areas of high T1 signal if hemorrhage is present. As with CT, noncystic components of pheochromocytomas are frequently hypervascular on post-contrast MR images.
Fig. 5.13
Pheochromocytoma: hereditary. (a) This contrast-enhanced CT scan demonstrates small enhancing bilateral adrenal nodules (arrows) in a 32-year-old female who presented with elevated urinary catecholamines, consistent with multifocal pheochromocytomas. (b) A thyroid ultrasound on the same patient demonstrates bilateral heterogenous solid thyroid nodules that proved to be medullary carcinoma at pathology. (c) Note the marked hypervascularity of one of the nodules on color Doppler imaging (arrow). This patient originally presented with elevated serum calcium levels and was subsequently shown to have a parathyroid adenoma. The triad of parathyroid adenoma, medullary carcinoma of the thyroid, and pheochromocytoma is known as multiple endocrine neoplasia type 2B (MEN IIB)
Pheochromocytomas are known to follow the “10 % rule;” that is, approximately 10 % are malignant and can metastasize, 10 % are bilateral, 10–15 % are extra-adrenal (extra-adrenal pheochromocytomas, also called paragangliomas, can arise anywhere from the neck to the pubis where neuroectodermal tissue is found, although most occur in the abdomen, especially in the retroperitoneum), 10 % occur in children, and 10 % are associated with heritable syndromes [28]. These syndromes include MEN II (see Fig. 5–13), Von Hippel-Lindau, and neurofibromatosis type 1. Recently, Welander [42] reviewed the literature on these syndromes and summarized the results (see Table 5.1). Notable features of hereditary pheochromocytoma include an earlier onset compared to the sporadic form and a predilection for multifocal and bilateral tumors. Pheochromocytoma can also occur in up to 6 % of patients with a very rare syndrome called Carney’s triad (paragangliomas/pheochromocytoma, gastrointestinal stromal tumor, and pulmonary chondromas) [43]. Even more rarely, pheochromocytoma can occur in association with MEN 1 syndrome [42].
Syndrome | Genetic defect | Incidence of syndrome | Incidence of pheochromocytoma in this population (%) | Mean age of onset of pheochromocytoma, y | Bilateral (%) | Malignant (%) |
|---|---|---|---|---|---|---|
MEN 2A and MEN 2B pheochromocytoma, medullary carcinoma of thyroid, and either parathyroid tumor (2A) or mucocutaneous neuroma (2B) | RET (autosomal dominant) | 1/40,000 | 50 | 36 | 63 | 3 |
VHL hemangioblastomas, pheochromocytoma, pancreatic islet cell tumors, renal tumors, lymphatic sac tumors | VHL (autosomal dominant) | 1/36,000 | 10–20 (PCC or paragangliomas) | 29 | 44 | 3 |
NF1 neurofibromas, café au lait patches, skin fold freckling, iris Lisch nodules, optic gliomas, bone dysplasias, pheochromocytoma | NF1 (autosomal dominant, but up to 50 % can be sporadic) | 1/3,500 | 5.7 (up to 13 % at autopsy) | 42 | 14 | 9 |
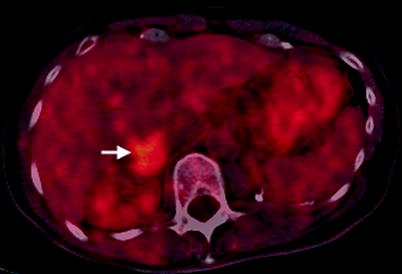
Fig. 5.14
Pheochromocytoma: PET. This fused PET-CT image demonstrates a 3 cm right adrenal mass (arrow) with a standardized uptake value (SUV) of 5
The high metabolic activity of pheochromocytoma allows detection with functional imaging. Because the diagnosis of pheochromocytoma is usually suggested by clinical symptomatology and laboratory data, PET is generally used for localizing site(s) of tumor rather than for diagnostic purposes. A higher percentage of malignant pheochromocytomas demonstrate increased uptake on fluorodeoxyglucose (FDG) PET than benign pheochromocytomas (82 % vs. 58 % sensitivity, respectively) [44]. However, radioiodinated MIBG is actually more sensitive than FDG PET in detecting both benign (83 % vs. 58 %) and malignant pheochromocytoma (88 % vs. 82 %), as demonstrated in a study by Shulkin et al. [45]. Of note, all the pheochromocytomas that failed to concentrate MIBG in this study actually demonstrated FDG avidity, indicating that FDG PET should play a major role in staging this subset of patients [45]. More recently, FDG PET using agents such as 6-[18F]fluoro-l-dopa (18F-DOPA) and 18F-fluorodopamine have yielded impressive results in the detection of both primary tumors and metastatic disease [46– 48]. Radiolabeled octreotide analogues may also be of use in detecting extra-adrenal or metastatic pheochromocytoma. 68Ga-DOTOTATE-PET has been shown to identify pheochromocytoma not detected with MIBG [49, 50]. Overall, it is likely that a combination of anatomic imaging (to assess local disease involvement) and functional imaging (to detect extra-adrenal and distant metastatic disease) is the optimal method to stage pheochromocytoma.
Fig. 5.15
Adrenal hyperplasia. (a, b) This contrast-enhanced CT in a patient with Cushing syndrome demonstrates marked diffuse thickening of both adrenal glands consistent with hyperplasia (arrows). Both adrenal glands were subsequently resected revealing diffuse adrenocortical hyperplasia. The cause of the hyperplasia in this case was an adrenocorticotropic hormone (ACTH)-secreting neuroendocrine tumor of the pancreas that metastasized to the liver (arrowheads on metastases in a)
Hyperplasia is defined as diffuse adrenal thickening, most often bilateral, and is usually due to hyperstimulation by excessive ACTH, which results in Cushing syndrome. Excluding exogenous hormone administration for medical purposes, Cushing syndrome is caused by ACTH overproduction in 80–85 % of cases, 85 % of which are caused by a pituitary adenoma (also known as Cushing disease) whereas the other 15 % are caused by an ectopic ACTH-secreting tumor. Fifteen to twenty percent of Cushing syndrome cases are non-ACTH dependent and are caused by primary adrenal overproduction from hyperplasia, adenoma, or adrenal cortical carcinoma [30]. A less common manifestation of hyperplasia than Cushing syndrome, Conn syndrome, or hyperaldosteronism can be caused by idiopathic bilateral adrenal hyperplasia, idiopathic unilateral adrenal hyperplasia, adrenal adenoma, or adrenal cortical carcinoma [30]. On CT, adrenal enlargement associated with these syndromes is most often diffuse, but can also be nodular or mixed [30]. Smooth, diffuse enlargement of both adrenal glands is the most common abnormality seen in Cushing disease, although 30–52 % of patients with Cushing disease have normal-appearing adrenal glands [30, 51]. In contrast, ectopic ACTH-secreting tumors more commonly present with nodular or lobular enlargement [51]. On MRI, adrenal hyperplasia can also be smooth or nodular and is frequently the same signal intensity as normal adrenal gland on all sequences. However, hyperplastic adrenal glands may demonstrate signal loss on opposed phase images, particularly in the presence of nodular thickening [24].
Fig. 5.16
Adrenal cysts. (a) Scout radiograph from CT in a 61-year-old man with a history of lung cancer demonstrates a 3.5 cm rim calcified mass in the right upper quadrant (arrow). (b, c) NCCT and contrast-enhanced CT, respectively, demonstrate a right adrenal mass with rim calcification and a few thin calcified septations (arrow). The noncalcified portion of the mass measures between 35 and 40 HU on both the pre- and post-contrast images consistent with a cystic, hemorrhagic lesion. No solid, enhancing component is identified. However, due to the complex nature of the lesion, it was resected and pathology confirmed a pseudocyst with extensive fibrosis and calcification. (d) This T2WI demonstrates a 2 cm left adrenal mass, which is very high in signal consistent with a cyst (arrow)
Adrenal cysts are rare, with a reported incidence of 0.064 and 0.18 % on autopsy series. They represent approximately 5 % of incidentally detected adrenal lesions [40]. Adrenal cysts are classified as endothelial cysts (45 %), pseudocysts (39 %), epithelial cysts (9 %), and parasitic cysts (7 %) [28, 40].
Endothelial cysts, also known as simple cysts, are usually asymptomatic unless they undergo hemorrhage or infection, or if they are large enough to cause mass effect upon adjacent structures [24]. More than 90 % of endothelial cysts are lymphangiomatous cysts, whereas the remaining are hemangiomatous. On CT, they are fluid-attenuation structures measuring less than 20 HU with smooth borders and thin walls that measure less than 3 mm [52]. Punctate or curvilinear calcifications are occasionally seen [40]. On MRI, these lesions are identical to fluid on all sequences: homogenously low in T1 signal and very high in T2 signal with no internal enhancement. Lymphangiomatous cysts can occasionally contain enhancing septations [40]. If hemorrhage or infection occurs within a cyst, the diagnosis will be difficult to make on single phase CT due to the increased attenuation. However, the diagnosis is more obvious on MRI, which will demonstrate increased T1 signal without enhancement, confirming the cystic nature.
Pseudocysts are usually the result of old hemorrhage and, thus, are more likely to be symptomatic than endothelial cysts. They contain a fibrous wall that lacks an epithelial or endothelial lining. On CT, most pseudocysts are similar to other adrenal cysts in that they are unilateral, well-defined, fluid-density masses. However, since they are usually the result of old hemorrhage, pseudocysts are more likely than endothelial cysts to contain septations, blood products, and soft tissue nodules [40]. Pseudocysts are also more likely to contain calcifications (20–56 % incidence) than endothelial cysts (9.5 %); the calcifications are usually located within the cyst wall and can be very thick [40, 52, 53]. Since pseudocysts contain hemorrhage of varying ages, the imaging appearance on MRI is quite variable.
Epithelial cysts have a nonspecific imaging appearance that is similar to other simple adrenal cysts.
Parasitic cysts are usually caused by echinococcus and are called hydatid cysts. These cysts can appear simple early in their development, in which case they are indistinguishable from other simple cysts. However, as they evolve, characteristic “daughter” cysts are often seen in the lumen on cross-sectional imaging, suggesting the diagnosis [40].
The diagnosis of adrenal cysts is usually straightforward but when large, they can be mistaken for hepatic, renal, pancreatic, or splenic cysts. Coronal and sagittal images are often helpful in determining the adrenal origin. Another potential diagnostic dilemma is encountered with NCCT: simple (noncalcified) cysts are indistinguishable from lipid-rich adenomas because both entities are equivalent to fluid in attenuation (−20–20 HU). However, the distinction can easily be made with IV contrast administration because adenomas enhance whereas cysts do not. Adrenal cysts are usually treated conservatively when the diagnosis is clear; however, if a thick or irregular wall is present, they can be difficult to distinguish from a malignant lesion in which case surgical treatment should be considered [40].
Fig. 5.17
Adrenal hematoma. A 71-year-old man who presented to the emergency room with severe acute left-sided abdominal pain, which radiated to the chest. (a) NCCT demonstrates a 4 cm high attenuation left renal mass measuring 65 HU (arrow). Note extensive infiltration of the adjacent perinephric fat suspicious for hemorrhage (arrowhead). (b) A contrast-enhanced CT performed later the same day demonstrates that the mass again measures 65 HU, indicating a lack of enhancement. (c) Two weeks later, an MR was performed. Axial T1FS image demonstrates that the mass (arrow) has a rim of high signal consistent with hemorrhage. (d, e) Post-contrast (d) and subtraction image (e) demonstrate lack of central or nodular enhancement confirming the absence of an underlying solid mass. The thin rim of peripheral enhancement (arrow) probably represents a combination of normal adrenal tissue and a fibrous wall surrounding the hematoma. (f) Follow-up MR 1-year later demonstrates near-complete resolution of the hematoma (arrow)
The most common cause of adrenal hemorrhage is blunt trauma (80 % of cases), which more commonly involves the right than the left adrenal gland (80 % are unilateral) due to the shorter right adrenal vein, which drains directly into the IVC and thus is more susceptible to changes in pressure caused by trauma [54, 55]. Other less common causes include neonatal stress, stress in adults (related to surgery, sepsis, burns, hypotension), bleeding diathesis, anticoagulation, adrenal vein thrombosis, underlying adrenal tumors, or unknown causes (idiopathic) [41, 54, 55]. Clinical symptoms of adrenal hemorrhage include abdominal or back pain and fever, although many cases are clinically inapparent [41, 52]. In severe cases of bilateral hemorrhage, when at least 90 % of the adrenal glands have been destroyed, acute primary adrenal insufficiency (addisonian crisis) can result. The most common cause of addisonian crisis is hemorrhage related to stress or bleeding diathesis [41


Related posts:

Stay updated, free articles. Join our Telegram channel
Full access? Get Clinical Tree
