The eloquent brain can be identified using functional MR (fMR) imaging for the gray matter and diffusion tensor (DT) imaging for the white matter. fMR imaging and DT imaging are especially important for patients with tumors near the important motor and language centers of the brain, where the normal anatomic references may be distorted by the tumor and associated edema. This article explains fMR imaging and DT imaging techniques and illustrates their clinical applications and limitations.
Brain tumor resection is an integral part of the treatment of patients with brain tumors, as most outcomes are believed to improve after gross total resection (a notable exception is central nervous system lymphoma). The goal of surgery is to maximize tumor resection and avoid adjacent eloquent brain structures, because their inadvertent injury can cause profound neurologic deficits. Magnetic resonance (MR) imaging is a noninvasive test used to evaluate and plan therapy for patients with brain tumors. Conventional MR imaging scans provide purely anatomic information (eg, how big the tumor is and what it is doing to the adjacent brain). Rather than simply showing structural changes, advanced MR imaging techniques investigating biophysiologic processes can be used to map the functional parts of the brain responsible for specific activities. The eloquent brain can be identified using functional MR (fMR) imaging for the gray matter and diffusion tensor (DT) imaging for the white matter. fMR imaging and DT imaging are especially important for patients with tumors near the important motor and language centers of the brain, where the normal anatomic references may be distorted by the tumor and associated edema. fMR imaging is a commonly used technique for identifying the eloquent gray matter, whereas DT imaging is a relatively new and still immature technique for showing the white matter. This article explains fMR imaging and DT imaging techniques and illustrates their clinical applications and limitations.
Part I: fMR imaging
Theoretic Basis
Blood oxygenation level-dependent (BOLD) fMR imaging uses deoxyhemoglobin as an endogenous contrast agent to measure the hemodynamic response to neuronal activity through the concept of neurovascular coupling. Neuronal activity causes increased local oxygen consumption, which in turn causes a marked increase in the cerebral blood flow that overcompensates for the resultant increase in cerebral metabolic rate. This overcompensation leads to an increase in the fraction of local venous blood that is oxygenated. The susceptibility difference between the local ratio of diamagnetic oxyhemoglobin to paramagnetic deoxyhemoglobin leads to the more rapid dephasing of transverse magnetization. This process is captured as a slight increase in the BOLD signal by highly sensitive T2 imaging techniques, thereby allowing the indirect noninvasive investigation of functional brain activity.
fMR Imaging Acquisition
T2 gradient-echo (GE) sequences that lack the refocusing pulse of routine spin-echo (SE) sequences are used to magnify the local magnetic field inhomogeneities and increase the sensitivity of fMR imaging to small changes in hemoglobin composition. Analyzing the time course of the BOLD signal within each imaging voxel gives an estimate of the magnitude of the local hemodynamic response function. Because changes in the imaging target occur on the order of seconds, the area of interest is scanned multiple times usually using echo planar imaging (EPI), with each acquisition taking 2 to 4 seconds. The high temporal resolution requires decreased spatial resolution, although fMR imaging data overlays on the routine anatomic images can overcome this limitation.
Because GE EPI sequences are more heavily T2-weighted, they are preferred to SE EPI sequences in fMR imaging. In addition, SE EPI sequences are not sensitive to contributions from venous blood, resulting in a smaller signal that is more difficult to discern from background noise. SE EPI can be advantageous in certain settings: (1) SE BOLD images originate from the capillaries, which are closer to the focus of neuronal activity, whereas GE BOLD images originate too from capillaries but also from venules, which are slightly removed from the neuronal focus; and (2) the lower T2 weighting renders less susceptibility artifact from adjacent metal and air-bone interfaces, such as when imaging near the paranasal sinuses, skull base, or postoperative sites.
fMR Imaging Paradigms
Task designs that elicit neuronal activity, known as paradigms, are used to produce fMR imaging maps of cerebral function. Paradigms can either be event-related (stimulus presentation followed by a period of rest) or block-design (repeated periods of alternating stimulus and rest presentation). Event-related paradigms better mirror the hemodynamic response and eliminate the stimulus predictability seen with block-design paradigms, but their limitations include long acquisition times, low statistical power, and complicated statistical signal analyses. For these reasons, block-design paradigms are the most common type used in clinical practice. After image acquisition, the time course of the task is plotted against the time course of BOLD signal changes within each voxel to assess whether there is significant association between the signal changes and the functional task. Block-design paradigms are able to detect subtle BOLD signal changes across time and able to reduce artifacts from physiologic variations in signal by performing correlations with the timing of tasks.
Relevant anatomy
Language and motor paradigms are most commonly used in clinical practice. The left hemisphere is almost always language dominant in right-handed individuals and usually dominant or codominant in left-handed individuals. Productive speech function resides primarily in Broca’s area in the posterior inferior frontal gyrus. Receptive speech function resides primarily in Wernicke’s area in the posterior superior temporal gyrus. Because of significant variations in anatomic specialization between individuals, these functions can be better described as residing in the frontal and temporoparietal regions, respectively. Lesions in dominant frontal speech areas can cause an agrammatic aphasia characterized by halting, labored speech. Lesions in dominant temporoparietal areas can cause a receptive aphasia characterized by poor speech comprehension and repetition. Multiple other areas are involved in secondary speech functions, including the middle frontal gyrus, middle and inferior temporal gyri, supramarginal gyrus, and angular gyrus.
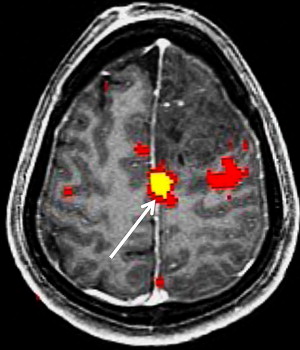
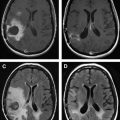
Motor function is organized topographically within the precentral gyrus in a pattern referred to as the homunculus ( Fig. 1 ). From medial to lateral, portions of the precentral gyrus are responsible for the leg, trunk, hand, and face motor activity; the hand localizes to the omega portion. This somatotopic functional organization makes it important to select appropriately directed paradigms that use motor tasks based on lesion proximity to specific regions of the motor homunculus. The supplementary motor area (SMA) in the superior frontal gyrus is also involved in motor planning. Lesions in this region can result in paresis or muteness ( Fig. 2 ).
fMR imaging paradigms
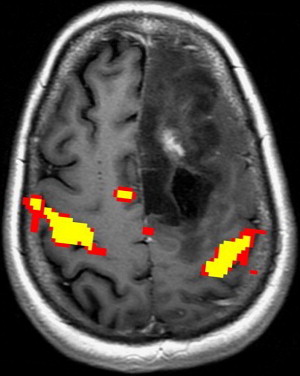
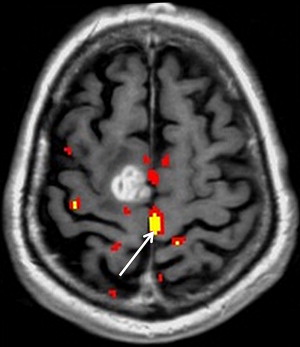
Appropriate paradigm selection requires clinical evaluation of the patient’s deficit(s) and inspection of the anatomic images to determine the proximity of the lesion to eloquent cortex. Several factors must be considered, including the patient’s handedness and clinical ability. Language tasks are designed to primarily assess productive and receptive function. Tasks that assess productive function are termed fluency tasks, requiring the patient to generate words in response to a cue. Examples include phonemic fluency tasks, in which a patient generates words starting with a specific letter, and semantic fluency tasks, in which a patient generates words of a specific category ( Fig. 3 ). Receptive tasks generally assess language comprehension and include tasks that involve reading, listening to words, naming, identifying synonyms, and filling in sentences with the appropriate words. Fluency and receptive tasks can activate frontal and temporoparietal language regions to varying degrees. Temporoparietal regions in particular are difficult to target with specific tasks, partly because of a wider distribution of receptive language function. It has been suggested that activations in these regions may be transient, and nonperiodic sampling during interstimulus intervals can capture greater signal in these areas.
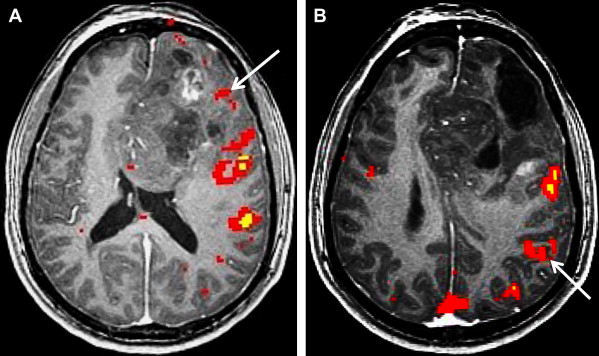
Because of the potential of head motion with motor tasks and the difficulty of completing certain motor tasks in a supine position, most motor tasks suitable for fMR imaging are limited to a few areas of the body. Among tasks used in motor paradigms are finger tapping, tongue motion, and passive hand and foot stimulation. Finger tapping tasks using the sequential tapping of adjacent fingers have the added advantage of activating premotor planning areas. Finger tapping tasks can be substituted with fist opening and closing in patients with distal limb weakness. Because of the large fraction of the somatotopic motor map devoted to the tongue, even minimal tongue motion can generate large fMR imaging signals. For the paretic patient, paradigm testing an alternate location along the motor cortex or passive sensory function paradigms may enable proper identification of the motor cortex ( Fig. 4 ). These passive tasks often activate the motor cortex as well as the sensory cortex through reciprocal neuron connections.
Paradigm preparation and monitoring
Task familiarity before imaging is important to ensure accurate fMR imaging responses. Practice versions of tasks using stimuli that are similar to the real test stimuli can be useful in training the patient, although presentation of actual test stimuli can result in sensitization and should be avoided. Accuracy is also improved by detailed instructions and reassurance during task performance. Patient monitoring is important to ensure accurate and reliable fMR imaging results. Monitoring motor tasks is easy through methods such as video monitoring or using squeeze balls that monitor motor response. Forced choice paradigms, in which the patient must make a choice to complete the task using button boxes, can be an effective method to improve patient performance. Silent language tasks are advantageous because of the lack of head motion, but monitoring patient performance can be difficult. The use of motion correction algorithms may facilitate vocal speech paradigms, which are easier to monitor and may present more accurate representations of speech production and comprehension. Baseline tasks for the rest period should be chosen carefully, with the goal of maximizing the contrast of neural response between rest and activity periods. Depending on the target location, a nonstimulating task such as fixation on a cross or an opposing task can be chosen. For example, a baseline task of passively viewing nonsense objects has been shown to improve detection of signal in Broca’s area with sentence generation tasks.
Other Techniques for Functional Mapping
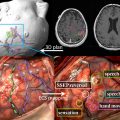
Direct electrical cortical stimulation (ECS) is considered the gold standard for functional mapping. Direct stimulation can evoke positive responses, such as the stimulation of motor cortex activating muscular contraction, or inhibitory responses, such as the stimulation of Broca’s area leading to a disruption of speech. Electrocorticography (ECoG) is an intraoperative technique that uses cortical surface electrodes to detect somatosensory evoked potentials (SSEP) that arise from electrical stimulation of nerves. For example, electrical current delivered to the median nerve can be used to identify the central sulcus, by analyzing the resultant SSEP distribution arising from signals being transmitted to the motor and sensory cortex. Other common techniques for functional mapping are summarized in Table 1 .
| fMR Imaging | DECS | Wada (ISAP) | PET/CT | MEG/MSI | TMS | fTDC | |
|---|---|---|---|---|---|---|---|
| Mechanism | Hemodynamic response (indirect) | Electrical stimulation (direct) | Anesthesic deactivation (indirect) | Hemodynamic response (indirect) | Magnetic flux (direct) | Electrical interference (direct) | Hemodynamic response (indirect) |
| Expressive language | Yes | Yes | Yes | Yes | No | Yes | Yes |
| Receptive language | Yes | Yes | Yes | Yes | Yes | No | Yes |
| Memory | Yes | Yes | Yes | Yes | Yes | No | No |
| Motor | Yes | Yes | No | Yes | Yes | Yes | Yes |
| Invasive | No | Yes | Yes | Minimal b | No | No | No |
| Radiation | No | No | Yes | Yes | No | No | No |
| Spatial resolution | Good | Excellent | Poor a | Poor | Excellent | Excellent | Poor a |
| Temporal resolution | Good | Excellent | Poor | Poor | Excellent | Excellent | Good |
| Bilateral testing | Yes | No | Yes | Yes | Yes | Yes | Yes |
| Availability | Good | Good | Limited | Good | Poor | Poor | Poor |
| Risks | Minimal | Medium | Medium | Minimal | Minimal | Small | Minimal |
a Lateralization to the dominant hemisphere only, not within a hemisphere.
Clinical Applications of fMR Imaging for Tumor Imaging
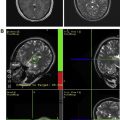
fMR imaging is most commonly performed for preoperative planning. The results can help guide decisions on whether to offer surgery, assessment of the risk and prognosis, planning of the surgical approach, and maximize tumor resection. fMR imaging is important in preoperative mapping because of the potential distortion of normal anatomic relationships adjacent to the tumor. The fMR imaging data are often stereotactically coregistered to anatomic data from computed tomography or MR imaging images and imported into the neurosurgical navigational software, to provide an interactive roadmap during surgery.
fMR imaging mapping of motor function
Because of the relatively invariable somatotopic organization of motor and somatosensory function, functional mapping of these systems is more reliable than language mapping. Localization of the somatosensory and motor cortex surrounding the central sulcus is important in tumors at the frontoparietal junction, because of concern of paralysis from injury of motor cortex or descending tracts. ECoG and ECS can be used to identify the central sulcus during surgery. In contrast, fMR imaging can provide useful information before surgery that could then be used to modify the surgical planning, guide ECS mapping, and predict the risk of motor and/or sensory functional loss. fMR imaging mapping of the central sulcus has proved resistant to potentially limiting artifacts from head motion, patient anxiety, and abnormal vasculature. Coactivation of the somatosensory and motor cortices with motor and sensory paradigms can occasionally make differentiation of the 2 cortices difficult. Using anatomic landmarks, for example the omega portion of the central sulcus delineating hand motor representation, and the fact that the posterior portion of gray matter in the precentral and postcentral gyrus activates with fMR imaging tasks, can help differentiate these cortices. fMR imaging mapping also aids in identifying the foot and leg motor cortex, which are difficult to identify by ECS mapping because of their deep location adjacent to the interhemispheric fissure ( Fig. 5 ).
fMR imaging mapping of language function
The anatomic localization of the language cortex is less predictable than that of the highly organized motor cortex. Variability may occur in the expected patterns of language dominance, particularly in left-handed persons, and in the distribution of language function, particularly for receptive or temporoparietal language functions. Because anatomic predictors cannot solely determine whether a particular language region is affected by tumor, functional imaging is of paramount importance in localizing language function and laterality. fMR imaging is the most common functional imaging modality used in this regard.
Hemispheric language dominance is related to the degree of handedness; only a small fraction of strong right-handed individuals show right language dominance, and nearly one-third of strong left-handed individuals show left language dominance. Cortical reorganization in brain tumor patients may also increase the incidence of atypical dominance. These inconsistencies illustrate the importance of functional mapping in lieu of anatomic predictions. fMR imaging mapping of these eloquent regions may enable the neurosurgeon to offer surgery for tumors believed to be inoperable based on anatomic imaging alone.
Until recently, the Wada test has been the gold standard of determining language dominance in preoperative patients. Its role has been supplanted by fMR imaging, which is more widely available, noninvasise and can be used to assess language dominance and localization of function. Studies comparing the efficacy of fMR imaging and Wada in determining language dominance have shown good concordance, with greater correlations achieved by combining 4 separate language tasks. When dominance is atypical or bilateral, fMR imaging and Wada may lead to suboptimal results. A disadvantage to fMR imaging is activation of portions of the brain nonessential for language function during language tasks, which may blur the distinction between nonessential and essential language areas. Using a threshold to exclude these nonessential areas may improve the diagnostic quality, but may also lead to false-negative and false-positive results in assessing hemispheric dominance.
Localization of language function is inherently difficult because of distribution across multiple gyri and marked variability between patients. Despite the widespread distribution of activity, only a few centers of function seem to be essential for language production and comprehension. Lesions close to the lateral precentral gyrus, which is responsible for tongue and facial motion, Broca’s area or the inferior frontal gyrus, and Wernicke’s area in the superior and middle temporal gyri are of greatest concern. ECS is an important correlative measure to determine language essentiality; some frontal sites that are active on fMR imaging maps do not show the speech disruption expected with intraoperative stimulation. Studies assessing the correlation of intraoperative stimulation and fMR imaging have found mixed results. fMR imaging activity does not signify that an area is crucial for function, limiting the ability of fMR imaging to target essential functional areas. In contrast, the inhibitory effects of direct cortical stimulation are suited to identifying essential areas. The combination of 3 tasks may increase the ability of fMR imaging to detect critical language areas, providing an alternative for patients who cannot undergo intraoperative stimulation. Interpreting ECS results of Wernicke’s or temporoparietal speech areas has proved more difficult, as changes in speech pattern on electrical stimulation can be subtle. In addition, it is difficult to design fMR imaging paradigms that specifically target Wernicke’s area; most language comprehension tasks also activate Broca’s area to some extent. Some tasks that have shown better results include auditory responsive naming, sentence comprehension, and sentence completion tasks.
Silent language tasks that may be advantageous because of lack of head motion have been noted to favor anterior aspects of the frontal language system and limit precentral gyrus activation. These silent tasks do not seem to fully portray the language production system, as fMR imaging maps based on silent tasks do not correlate so well with intraoperative stimulation. Vocal speech paradigms or the inclusion of tongue movement paradigms can be helpful in this regard. Although most fMR imaging paradigms target functionality of the 2 major language functions, productive and receptive, damage to secondary language areas such as the SMA can have debilitating effects, including mutism and verbal working memory deficits. The degree of lateralization of the SMA has been shown to correlate with degree of postoperative aphasia.
Pitfalls of fMR Imaging
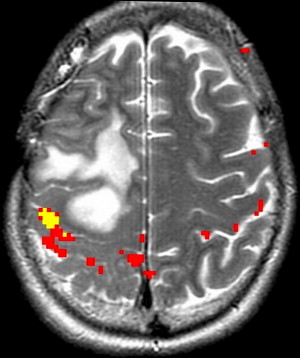
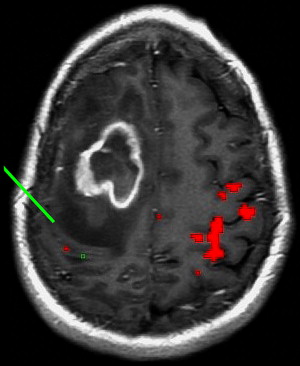
Neurovascular uncoupling describes the dissociation of vascular activity from sites of neuronal activation caused by damaged or abnormal vasculature, which may result in decreased or absent BOLD fMR imaging activity ( Fig. 6 ). The BOLD signal is comprised of 3 components: true neuronal activity, susceptibility artifacts that can create false-positive signals, and neurovascular uncoupling effects that can create false-negative signals on the fMR imaging map. Holodny and colleagues first described neurovascular uncoupling in a patient with glioblastoma involving the left precentral gyrus, with muted fMR imaging activation of the left motor cortex. This decrease in signal can simulate opposite hemisphere dominance or cortical reorganization. The leading hypothesis for this type of phenomenon is the presence of abnormal tumor vasculature, which has a diminished ability to respond to neuronal activity with appropriately increased blood flow. The baseline blood flow may already be maximally or near maximally increased by direct tumor infiltration, cerebrovascular inflammation, or neovascularity, and thereby minimize any potential increases caused by neuronal activity. Abnormal neovasculature can be analyzed using relative cerebral volume measurements; factors such as tumor volume, peritumoral edema, and edema within the eloquent gyrus are not believed to be associated with neurovascular uncoupling. Despite these limitations, the primary and motor sensory areas can be identified in most preoperative patients. When interpreting preoperative fMR imaging maps for language laterality, however, the possibility of muted fMR imaging signal in the expected language dominant hemisphere must be considered.
Brain plasticity or cortical reorganization refers to the transfer of function to a different area of the brain, often to the opposite hemisphere, in the setting of the growth of a brain tumor. In right-handed patients with extensive left hemisphere tumors, fMR imaging can be crucial in identifying whether language function has transferred to the opposite hemisphere. Several cases have been reported in which expressive or productive language function is transferred to the opposite hemisphere in the presence of tumor. Recognition of this potential reorganization, rather than reliance on anatomic landmarks alone, may make surgery a feasible option for some brain tumors that are otherwise considered inoperable.
Because BOLD fMR imaging relies on T2 weighting to produce images, anything that produces large magnetic susceptibility differences can be a significant source of artifact, including metal, recent surgery, and air-bone interfaces. These effects may be reduced by acquiring a field map to correct for inhomogeneities, decreasing the EPI readout times (increasing the bandwidth), decreasing the time to echo, or decreasing the slice thickness. Also, because BOLD fMR imaging signals originate from veins and capillaries, it is important to compare the fMR imaging images with high-resolution MR images to exclude the possibility of a large draining vein creating a false-positive fMR imaging signal. As opposed to the microvasculature, the relationship between large draining veins and site of neuronal activation is unknown. Contrast-enhanced T1 imaging can help in differentiating the macrovasculature from the microvasculature. When planning the fMR imaging paradigms, recognition of large draining veins near the tumor or eloquent brain in interest may lead to the use of SE sequences rather than GE sequences to decrease these T2 effects.
Head motion can be a significant source of artifact in fMR imaging. Artifact arises when voxels with higher T2 signal intensity move into neighboring voxels with lower signal intensity. Tumors associated with marked vascularity, extracellular methemoglobin, and surrounding edema show high T2 signal intensity. Motion artifact can lead to false-positive signals in these areas, with a high T2 gradient blurring across neighboring voxels. Motion artifacts occur more often in patients with paresis, as the motion of more proximal muscles increases head motion. Appropriate paradigm selection may help decrease head motion (eg, by selecting tasks that use sensory stimulation, passive movements, or motor imagery). Although avoiding motion artifact is most effective, postprocessing techniques such as time course analysis can help differentiate motion artifact from real activation. In time course analysis, MR signal changes from motion artifact that abruptly peak are discarded, whereas signal changes from neuronal activation that shows a delay before a peak are included in the analysis.
Part II: DT imaging
Theoretic Basis
Diffusion imaging
Diffusion imaging examines the motion of water molecules, which is normally random or Brownian in the unimpeded, isotropic state. The brain has natural barriers to the motion of water molecules such as intracellular organelles, macromolecules, and cell membranes that result in anisotropic diffusion. Routine diffusion-weighted imaging (DWI) can be used to calculate the apparent diffusion coefficient (ADC), which is a measure of the magnitude of water diffusion. DT imaging takes advantage of the preferential diffusion of water in brain tissue, which is decreased perpendicular to the myelin sheaths and cell membranes of white matter axons. The diffusion tensor is a mathematical model of water diffusion that reflects the anisotropy (directional dependence) and orientation of the local white matter fibers. The most commonly derived DT imaging metrics are mean diffusivity (MD) and fractional anisotropy (FA). MD is the mean of the 3 eigenvalues, or a directionally averaged measure of the magnitude of water diffusion. Analogous to the ADC, MD is related to the integrity of the brain tissue. FA is a measure of diffusion anisotropy that is derived from the standard deviation of the 3 eigenvalues, and ranges from 0 (isotropic with zero net direction) to 1 (maximal anisotropy that occurs along the primary eigenvector).
Image Acquisition and Postprocessing
Standard DWI is performed with single-shot EPI, which is inherently motion sensitive sequences. Unlike standard DWI, the motion-probing gradients are performed in multiple (≥6) directions for DT imaging. The optimal number of noncollinear gradients is uncertain, with different groups routinely acquiring DT imaging in 6 to 55 directions. Although more than 100 directions are possible, the increased imaging time necessary to acquire greater numbers of directions limits their clinical usefulness. The signal-to-noise ratio can be improved by increasing the number of repetitions, or by increasing the number of applied gradients, although both will also increase the required scan time.
The FA map is a graphical representation of the standard deviation of eigenvalues, in which the signal brightness correlates with the degree of anisotropy for that voxel. By also incorporating data about the primary orientation of each voxel, directionally encoded color FA maps can be generated. The standard color convention shows transverse fibers in red (x-axis), anteroposterior fibers in green (y-axis), and craniocaudal fibers in blue (z-axis). With knowledge of the normal brain anatomy, experienced users can identify specific white matter tracts on the color FA maps.
Qualitative DT imaging measurements are usually obtained using region-of-interest (ROI) analysis. The ROI method is dependent on operator experience, and may be difficult to perform and reproduce in areas of brain tumors with tissue compression and edema. Although there is no standard for analysis, proposed alternatives to the ROI method such as histogram and voxel-based analyses may improve the accuracy and reproducibility of the DT imaging measurements.
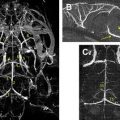
DT imaging tractography programs can be used to calculate the connectivity of different voxels. There are 2 main theories for fiber tracking: deterministic and probabilistic. In the deterministic method, fibers are assigned by continuous tracking (FACT) of user-defined voxels. In the probabilistic method, there is the additional quantification of the probability of connection between 2 points. This latter method tends to disperse trajectories more widely and may depict a greater portion of the white matter tracts. Probabilistic tractography may be more useful in areas of lower anisotropy, such as in small tracts, through crossing fibers, and in gray matter ( Fig. 7 ). Using tractography to first localize the tracts in question, then placing ROIs based on the mapped tracts may decrease some of the site selection biases of ROI measurements.
Using the fMR imaging-activated voxels to draw the seed (and end) ROIs on DT imaging maps may more accurately define functionally related white matter tracts than using DT imaging alone. In particular, fMR imaging-driven tractography may allow more discriminative depiction of corticospinal tract components (eg, hand vs foot fibers) and more accurate tracking through peritumoral abnormalities. The use of combined fMR imaging and DT imaging seems to improve the detection of important functional tracts within 5 mm of the tumor, and lower the rate of regional surgical complication rate compared with the overall surgical literature.
Clinical Applications of DT Imaging for Tumor Imaging
Neurosurgical planning
DT imaging is the only noninvasive, in vivo method to localize essential white matter tracts. This process is especially important for brain tumor surgery, in which the inadvertent injury to an eloquent white matter tract (eg, the corticospinal tract) can result in catastrophic neurologic deficits. Multiple studies have described the potential roles for DT imaging and tractography in preoperative planning, with both techniques able to identify specific white matter tracts ( Figs. 8 and 9 ). Although ECS and electrical recording are the standard of care for brain tumors located near eloquent brain, these are highly invasive intraoperative techniques that do not assist in preoperative planning or prognostication. Compared with cortical stimulation, effective white matter stimulation requires greater (deep) exposure and close proximity to the edge of the resection bed, higher electrical currents, and is less reliable than cortical mapping.
Preoperative tractography can indicate the locations of the important white matter tracts relative to the tumor, and thereby guide the surgical approach and the intraoperative stimulation. Mikuni and colleagues studied patients with tumors near the corticospinal tract and found that preoperative tractography could predict the usefulness of intraoperative stimulation of the motor cortex and subcortical fibers. There was a good correlation between the disruption of motor fibers by the tumor at tractography and the failure of cortical or subcortical stimulation. Given the propensity for stimulation to fail, the investigators suggested that awake brain surgery and evaluation of voluntary muscle movement may be more appropriate than stimulation in such patients. Therefore, tractography may be useful in predicting the value of intraoperative stimulation as well as guiding the stimulation.
Several studies have shown that tractography has a role in assessing the deviation, deformation, infiltration, and/or interruption of white matter tracts adjacent to a brain tumor. Some of these white matter changes may be temporary, and normalize after tumor resection ( Fig. 10 ). In patients with improved positions and appearances of the corticospinal tracts after resection of adjacent brain tumors, Laundre and colleagues found a positive correlation with clinical improvements in motor deficits. Tractography may allow more extensive tumor resections by increasing the confidence of resection adjacent to eloquent white matter tracts, and potentially distinguishing between displaced tracts (which should be spared) from disrupted tracts (which perhaps should be included in the resection).
Related posts:
 State-of-the-Art Pathology: New WHO Classification, Implications, and New Developments
 Molecular Tools: Biology, Prognosis, and Therapeutic Triage
 Advanced Imaging in Brain Tumor Surgery
 Liposomal Contrast Agents in Brain Tumor Imaging
 Novel Medical Therapeutics in Glioblastomas, Including Targeted Molecular Therapies, Current and Future Clinical Trials
 Clinical Trials in Brain Tumor Surgery
Stay updated, free articles. Join our Telegram channel

Full access? Get Clinical Tree


