The utility of magnetic resonance spectroscopy (MRS) in diagnosis and evaluation of treatment response to human brain tumors has been widely documented. The role of MRS in tumor classification, tumors versus nonneoplastic lesions, prediction of survival, treatment planning, monitoring of therapy, and post-therapy evaluation is discussed. This article delineates the need for standardization and further study in order for MRS to become widely used as a routine clinical tool.
Localized proton magnetic resonance spectroscopy (MRS) of the human brain, first reported more than 20 years ago, is a mature methodology that is used clinically in many medical centers worldwide for the evaluation of brain tumors. Although there have been studies of human brain tumors using heteronuclei such as phosphorus ( 31 P) and sodium ( 11 Na), by far the most spectroscopy studies use the proton ( 1 H) nucleus because of its high sensitivity and ease of implementation on commercial MR imaging scanners. This article will focus on proton MRS in human brain tumors.
There are two classes of spatial localization techniques for MRS. Single-voxel (SV) techniques record spectra from one region of the brain at a time (commonly used methods include the “point resolved spectroscopy sequence” [PRESS] and the “stimulated echo acquisition mode” [STEAM] sequences). Multivoxel techniques such as MRS imaging (MRSI)—also called “chemical shift imaging” —simultaneously record spectra from multiple regions and thereby map out the spatial distribution of metabolites within the brain. MRSI is typically performed in 2- or 3-dimensions, but does not usually include full brain coverage. While SV-MRS and MRSI each have their own advantages and disadvantages (eg, in terms of spectral quality, scan time, spatial resolution, spatial coverage, and ease of use or interpretation), a key consideration for brain tumors is their metabolic inhomogeneity. For instance, the spectrum from the necrotic core of a high-grade brain tumor is quite different from a spectrum from the actively growing rim, whereas peritumoral edema is different from tumor invasion into surrounding brain tissue. For these reasons and others, high-resolution MRSI is often favored for evaluating brain tumor metabolism.
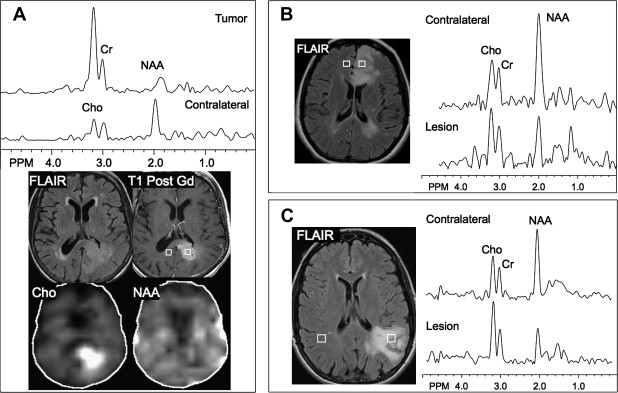
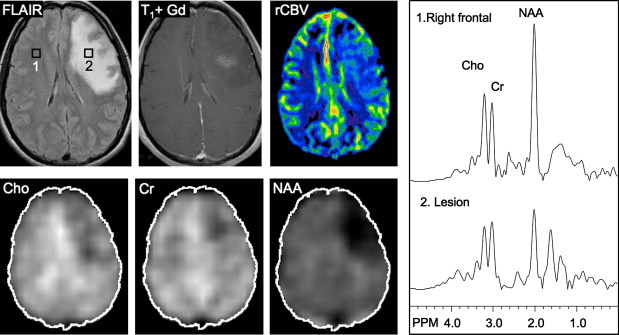
Early in the development of human brain proton MRS, it was realized that brain tumors exhibited markedly different spectra from normal brain tissue. It was found that nearly all brain tumors have decreased N-acetyl aspartate (NAA) signals, and often have increased levels of choline (Cho), leading to increased Cho/NAA ratios. The decrease in NAA is widely interpreted as the loss, dysfunction, or displacement of normal neuronal tissue because NAA is believed to be primarily of neuronal and axonal origin. The Cho signal actually contains contributions from several different Cho-containing compounds, which are involved in membrane synthesis and degradation. It has been suggested that it is increased in brain tumors owing to increased membrane turnover. In vitro studies have indicated that the elevated Cho signal in brain tumors is due to increased levels of phosphocholine. Cho has also been found to correlate well with the cellular density of the tumor and the degree of tumor infiltration into brain tissue. The use of MRSI to map Cho levels has therefore been suggested as a method for defining tumor boundaries in treatment planning (see later discussion).
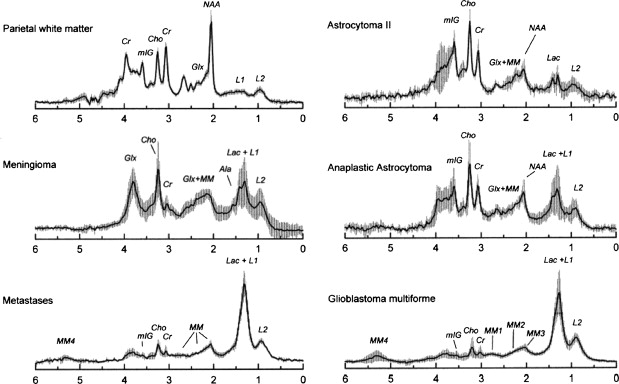
Other relatively common metabolic changes in human brain tumors are elevated signals in the lactate and lipid region of the spectrum, and sometimes increased levels of myo-inositol (mI) in short echo time (TE) spectra. The increase in lactate is most likely the result of anaerobic glycolysis ; although it could be due to insufficient blood flow leading to ischemia or, possibly, to necrosis. The observation of elevated lipid levels is believed to be associated with necrosis and membrane breakdown. Increased levels of mI are believed to reflect increased numbers of glial cells, which have been reported to contain high levels of mI and, in particular, have been reported to be high in grade II gliomas. It has also been reported that patients with gliomatosis cerebri may exhibit elevated inositol levels, even in the absence of increased Cho. Examples of brain tumor spectra are given in Fig. 1 and 2 .
Tumor classification
Early in the development of MRS of brain tumors, a commonly asked question was whether or not MRS could help to noninvasively diagnose tumor type and grade because this would have an influence on management decisions and prognosis. While MR imaging is without doubt the most sensitive modality available for the detection of brain tumors, its specificity is low, and several different tumor types (as well as lesions with other causes) may share a similar MR imaging appearance. Two particularly important imaging diagnoses are the differentiation between high-grade and low-grade tumors, or between neoplastic and nonneoplastic lesions (see later discussion), respectively. High-grade brain tumors are usually treated more aggressively than low-grade tumors, and so preoperative diagnosis of tumor grade is important for this reason.
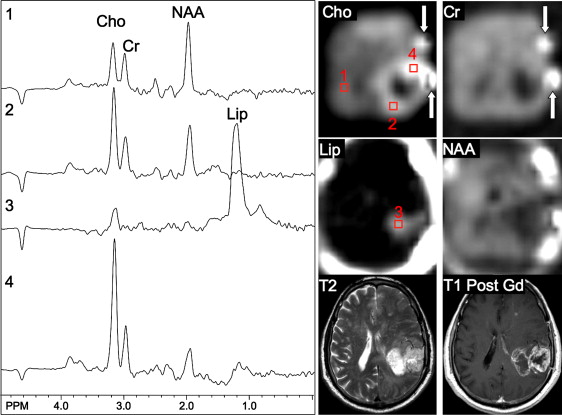
In astrocytomas, several studies, but not all, have suggested an association between tumor grade and Cho levels, with the higher grade tumors having greater Cho concentrations. This would appear consistent with the more aggressive tumors having higher membrane turnover and cellular density. However, some studies have found high-grade tumors (eg, grade IV glioblastoma multiforme [GBM]) to have lower levels of Cho than grade II or grade III astrocytoma. This may be due to the presence of necrosis in high-grade tumors, particularly those with necrotic cores, because necrosis is associated with low levels of all metabolites. Since tumors are commonly heterogenous, with necrotic cores, proliferative rims, and invasion of surrounding brain tissue, the spectrum may vary greatly depending on the region that is sampled by MRS ( Fig. 3 ). Hence, the region-of-interest chosen for analysis has a large influence on the results and MRSI is generally considered preferable because it allows metabolic heterogeneity to be evaluated and the voxel with the maximum Cho signal to be chosen for analysis. One recent MRSI study used MR perfusion imaging (arterial spin labeling) to guide the spectral measurement location. In regions with elevated flow, Cho (as well as glutamate plus glutamine [Glx] and lactate plus lipid) was found to be higher in high-grade compared with low-grade gliomas. No metabolic differences between high-grade and low-grade gliomas were found in normal or hypoperfused tumor regions.
Using sophisticated analysis schemes or pattern-recognition techniques, several groups have been able to use proton MRS or MRSI to accurately diagnose different types of neoplasia. However, because of lesion variability, heterogeneity, overlap between different tumor types, and dependence on data collection and analysis techniques, these results have proven difficult to replicate in general clinical practice. In most cases, therefore, it is very difficult for a clinician to use MRS alone to diagnose a brain lesion with high confidence. Rather, MRS should perhaps be seen as an adjunct technique that may contribute to differential diagnoses that are being considered on the basis of MR imaging, clinical and other information. For instance, as depicted in Fig. 1 and 2 , high Cho levels are typically seen in nonnecrotic high-grade brain tumors (eg, anaplastic astrocytoma, GBM, primary CNS lymphoma, whereas necrotic GBM and metastases are characterized by low levels of all metabolites and increased lipids). Meningiomas are usually readily diagnosed based on conventional imaging features, but the diagnosis may be additionally confirmed by the presence of a signal from alanine (a doublet centered on ∼ 1.47 ppm), which has been reported to be elevated in many meningiomas.
For discriminating solitary metastases from primary brain tumors, it has been suggested that investigation of perienhancing tumor regions may be useful. Whereas gliomas are often invasive lesions that show elevated Cho in surrounding tissue, metastatic lesions tend to be more encapsulated and do not typically show high Cho signals or other abnormalities outside the region of enhancement. Metastatic lesions and glioblastomas nearly always show elevated lipid peaks; thus, if the lesion does not exhibit mobile lipid signals, anaplastic glioma is more likely.
Tumors versus nonneoplastic lesions
If a lesion can be confidently diagnosed as nonneoplastic, an invasive brain biopsy procedure may be avoided and a different treatment course, depending on the cause of the lesion, may be considered. Examples of nonneoplastic lesions that may mimic brain tumors on conventional imaging are infectious (including abscess) or ischemic lesions, or demyelinating lesions (eg, tumefactive demyelination). Differentiation between tumors and nonneoplastic lesions using conventional MR imaging may be challenging. Whereas MR imaging is a sensitive technique for detection of brain lesions, the specificity and capability of conventional MR imaging for distinguishing between benign and malignant lesions is limited. Low-grade gliomas and many nonneoplastic lesions, such as early stage lesions or diffusely infiltrating lesions, may not exhibit a mass effect. Low-grade gliomas may present as small T 2 hyperintense lesions that may be difficult to differentiate from focal cortical dysplasias or other pathologies. The use of a contrast agent may also not increase diagnostic specificity because various nonneoplastic processes are often associated with disruption of the blood-brain barrier and not all tumors enhance.
Since tumors typically exhibit elevated Cho and decreased NAA, the greatest benefit of adding MRS to a clinical examination may be in including (or excluding) diagnoses with markedly different spectroscopic patterns (eg, strokes or focal cortical dysplasias, neither of which are expected to have increased Cho). Conversely, differentiation between tumors and acute demyelinating lesions based on MRS alone may be difficult as both entities typically present with elevated Cho and decreased NAA, as well as often increased lactate. A combination of conventional MR imaging with modern techniques of physiologic imaging—in particular, perfusion MR imaging—can therefore improve the classification.
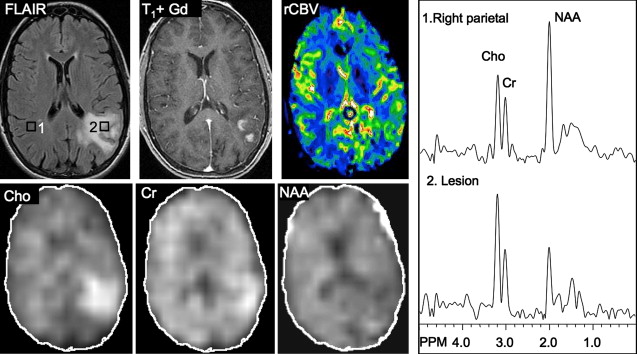
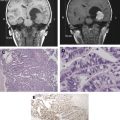
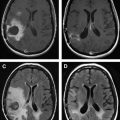
Several studies have evaluated the utility of H MRS to differentiate between tumors and nonneoplastic lesions or have compared spectroscopic characteristics of specific groups of neoplastic and nonneoplastic lesions. Two recent retrospective studies evaluated the value of MRSI and SV-MRS to differentiate between brain tumors and nonneoplastic lesions. In the 1 H MRSI study performed at a TE of 280ms, 84% of 69 brain lesions (36 tumors) were correctly classified using the ratios NAA/Cho, NAA/creatine (Cr), and Cho and NAA signal areas normalized to signal areas in a control region. There were five cases of tumors misclassified as nonneoplastic lesions: (1) anaplastic astrocytoma, World Health Organization (WHO) grade II; (2) infiltrating astrocytoma, WHO grade III; (3) gliomatosis cerebri, WHO grade II; (4) oligodendroglioma, WHO grade II; and (5) ganglioglioma, WHO grade II. Six nonneoplastic lesions were classified as tumors. The diagnoses included demyelination, radiation necrosis, postsurgical gliosis, and stable lesions not confirmed on pathologic examination. In a subgroup of 32 lesions, perfusion MR imaging also showed significant differences between high-grade and low-grade tumors, and between high-grade tumors and nonneoplastic lesions. By combining both MRSI and perfusion MR imaging, a sensitivity of 72.2% and specificity of 91.7% in differentiating tumors from nonneoplastic lesions was achieved with cutoff points of NAA/Cho less than or equal to 0.61 and relative cerebral blood volume (rCBV) greater than or equal to 1.50 corresponding to tumor diagnosis. Examples of benign and malignant lesions from this study are shown in Fig. 4 and 5 . In an SV-MRS study of 84 solid brain masses performed at a short TE (30 ms) and long TE (136 ms), presence of tumor was indicated when mI/NAA ratio (obtained at short TE) was greater than 0.9 and when Cho/NAA ratio (obtained at the long TE) was greater than 1.9. In this study, the group of tumors was represented by gliomas of WHO grade II and III. In a retrospective study of 32 children with primary brain lesions (19 tumors, 13 benign lesions), 78% of originally grouped cases could be correctly classified based on the Cho/Cr ratio.

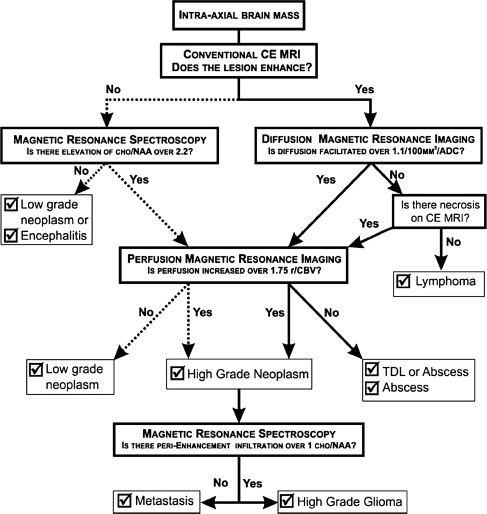
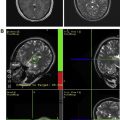
Typical imaging features of the most common intracranial masses in adults—including primary neoplasms (high-grade and low-grade), secondary (metastatic) neoplasms, lymphoma, tumefactive demyelinating lesions, abscesses, and encephalitis— on perfusion MR imaging, diffusion MR imaging, and proton MR spectroscopy (and examples of individual cases) were summarized in a recent review. The role of commonly used advanced imaging techniques in differentiation among intracranial masses in adults was retrospectively evaluated and the accuracy of MR imaging-based strategy to differentiate among histologically confirmed lesions was assessed. A practical MRI-based algorithm, including results from postcontrast MR imaging, diffusion-weighted MR imaging, perfusion MR imaging, and 1 H MRSI was proposed to improve the diagnosis and classification of these lesions ( Fig. 6 ). The diagnostic strategy was evaluated based on 40 patients who had complete data from all included imaging modalities; to differentiate between tumors and nonneoplastic lesions, the accuracy, sensitivity, and specificity of the classification strategy was 90%, 97%, and 67%. These results suggest that integration of advanced imaging techniques with conventional MR imaging may help to improve the reliability of the diagnosis and classification of brain lesions.

Generally, spectra from brain abscesses are quite different from those of high-grade neoplasia—they usually have low Cho signals, as well as decreased NAA and Cr, and often also exhibit increased signals from compounds that are not typically seen in neoplasia (eg, alanine, acetate, acetoacetate, succinate) in variable amounts depending on the source of the primary infectious process. Therefore, the distinction between abscess and neoplasm should be straightforward using MRS, which may add confidence to the diagnosis made by other techniques (eg, diffusion-weighted imaging ).
Tumors versus nonneoplastic lesions
If a lesion can be confidently diagnosed as nonneoplastic, an invasive brain biopsy procedure may be avoided and a different treatment course, depending on the cause of the lesion, may be considered. Examples of nonneoplastic lesions that may mimic brain tumors on conventional imaging are infectious (including abscess) or ischemic lesions, or demyelinating lesions (eg, tumefactive demyelination). Differentiation between tumors and nonneoplastic lesions using conventional MR imaging may be challenging. Whereas MR imaging is a sensitive technique for detection of brain lesions, the specificity and capability of conventional MR imaging for distinguishing between benign and malignant lesions is limited. Low-grade gliomas and many nonneoplastic lesions, such as early stage lesions or diffusely infiltrating lesions, may not exhibit a mass effect. Low-grade gliomas may present as small T 2 hyperintense lesions that may be difficult to differentiate from focal cortical dysplasias or other pathologies. The use of a contrast agent may also not increase diagnostic specificity because various nonneoplastic processes are often associated with disruption of the blood-brain barrier and not all tumors enhance.
Since tumors typically exhibit elevated Cho and decreased NAA, the greatest benefit of adding MRS to a clinical examination may be in including (or excluding) diagnoses with markedly different spectroscopic patterns (eg, strokes or focal cortical dysplasias, neither of which are expected to have increased Cho). Conversely, differentiation between tumors and acute demyelinating lesions based on MRS alone may be difficult as both entities typically present with elevated Cho and decreased NAA, as well as often increased lactate. A combination of conventional MR imaging with modern techniques of physiologic imaging—in particular, perfusion MR imaging—can therefore improve the classification.
Several studies have evaluated the utility of H MRS to differentiate between tumors and nonneoplastic lesions or have compared spectroscopic characteristics of specific groups of neoplastic and nonneoplastic lesions. Two recent retrospective studies evaluated the value of MRSI and SV-MRS to differentiate between brain tumors and nonneoplastic lesions. In the 1 H MRSI study performed at a TE of 280ms, 84% of 69 brain lesions (36 tumors) were correctly classified using the ratios NAA/Cho, NAA/creatine (Cr), and Cho and NAA signal areas normalized to signal areas in a control region. There were five cases of tumors misclassified as nonneoplastic lesions: (1) anaplastic astrocytoma, World Health Organization (WHO) grade II; (2) infiltrating astrocytoma, WHO grade III; (3) gliomatosis cerebri, WHO grade II; (4) oligodendroglioma, WHO grade II; and (5) ganglioglioma, WHO grade II. Six nonneoplastic lesions were classified as tumors. The diagnoses included demyelination, radiation necrosis, postsurgical gliosis, and stable lesions not confirmed on pathologic examination. In a subgroup of 32 lesions, perfusion MR imaging also showed significant differences between high-grade and low-grade tumors, and between high-grade tumors and nonneoplastic lesions. By combining both MRSI and perfusion MR imaging, a sensitivity of 72.2% and specificity of 91.7% in differentiating tumors from nonneoplastic lesions was achieved with cutoff points of NAA/Cho less than or equal to 0.61 and relative cerebral blood volume (rCBV) greater than or equal to 1.50 corresponding to tumor diagnosis. Examples of benign and malignant lesions from this study are shown in Fig. 4 and 5 . In an SV-MRS study of 84 solid brain masses performed at a short TE (30 ms) and long TE (136 ms), presence of tumor was indicated when mI/NAA ratio (obtained at short TE) was greater than 0.9 and when Cho/NAA ratio (obtained at the long TE) was greater than 1.9. In this study, the group of tumors was represented by gliomas of WHO grade II and III. In a retrospective study of 32 children with primary brain lesions (19 tumors, 13 benign lesions), 78% of originally grouped cases could be correctly classified based on the Cho/Cr ratio.

Typical imaging features of the most common intracranial masses in adults—including primary neoplasms (high-grade and low-grade), secondary (metastatic) neoplasms, lymphoma, tumefactive demyelinating lesions, abscesses, and encephalitis— on perfusion MR imaging, diffusion MR imaging, and proton MR spectroscopy (and examples of individual cases) were summarized in a recent review. The role of commonly used advanced imaging techniques in differentiation among intracranial masses in adults was retrospectively evaluated and the accuracy of MR imaging-based strategy to differentiate among histologically confirmed lesions was assessed. A practical MRI-based algorithm, including results from postcontrast MR imaging, diffusion-weighted MR imaging, perfusion MR imaging, and 1 H MRSI was proposed to improve the diagnosis and classification of these lesions ( Fig. 6 ). The diagnostic strategy was evaluated based on 40 patients who had complete data from all included imaging modalities; to differentiate between tumors and nonneoplastic lesions, the accuracy, sensitivity, and specificity of the classification strategy was 90%, 97%, and 67%. These results suggest that integration of advanced imaging techniques with conventional MR imaging may help to improve the reliability of the diagnosis and classification of brain lesions.
Generally, spectra from brain abscesses are quite different from those of high-grade neoplasia—they usually have low Cho signals, as well as decreased NAA and Cr, and often also exhibit increased signals from compounds that are not typically seen in neoplasia (eg, alanine, acetate, acetoacetate, succinate) in variable amounts depending on the source of the primary infectious process. Therefore, the distinction between abscess and neoplasm should be straightforward using MRS, which may add confidence to the diagnosis made by other techniques (eg, diffusion-weighted imaging ).
Prediction of survival
Long-term prognosis for patients with high-grade gliomas is poor despite aggressive treatment strategies. Nevertheless, survival time can be quite variable, and is important information for patients and their families. The ability of MRS to predict survival has been evaluated in both adult and pediatric brain tumor populations. A series of papers have evaluated the role of 1 H MRSI in prediction of survival of GBM patients. In a recent study, conventional MR imaging, and 1 H MRSI, diffusion, and perfusion MR imaging were used in a group of grade IV glioma patients (examined before surgery and treatment). Kaplan-Meier survival curves were generated and Cox proportional hazards model was applied to evaluate the utility of selected parameters on patients’ survival. Survival was relatively poor in patients with lesions exhibiting large areas of contrast enhancement, abnormal metabolism, or restricted diffusion. Specifically, of the parameters involving tissue volumes, high relative volumes (in the T 2 hyperintense lesion) of (1) combined contrast enhancement and necrosis areas, (2) the region with abnormal (elevated) Cho/NAA index, and (3) the region with apparent diffusion coefficient (ADC) less than 1.5 times of the ADC in normal-appearing white matter were negatively associated with survival. Survival time was also negatively associated with high lactate and lipid levels, and the ADC within the enhancing volume. None of the evaluated perfusion parameters was predictive of survival. In another study, 1 H MRSI was applied with MRSI, as well as conventional, diffusion, and perfusion MR imaging in 68 GBM patients with a median age of 58 years, examined after surgery, but before administration of adjuvant radiation treatment and chemotherapy. In this case, all evaluated MR imaging measures, including volume of increased CBV on perfusion MR imaging, were related to survival. As in the previous study, high Cho/NAA ratios and the combined lactate and lipid signal were associated with a higher risk of poor outcome.
In other studies, an inverse relationship between Cho/Cr ratio and survival time was detected in seven patients with gliomatosis cerebri, examined before treatment. A prospective longitudinal study examined 14 patients with high-grade gliomas before radiation treatment, at week 4 of radiation treatment, and 2 months posttreatment. Several spectroscopic indices were associated with unfavorable survival (including lactate [Lac]/NAA at week 4 and the change in normalized Cho/Cr between baseline and the first follow-up). The most significant was a more than 40% decrease in normalized Cho between the first and second follow-up visits in the contrast-enhancing region. However, no spectra were presented in this paper, making it difficult to judge the quality of the primary data that these conclusions were based on. In a retrospective 1 H MRSI study (performed at long TE; data collected before treatment) of 51 histopathologically verified cases of supratentorial gliomas, four MRSI indices (maximum value of Cho/Cr, maximum value of Lac/Cr, total number of voxels with NAA/Cr values less than two-thirds of the mean value from the normal appearing contralateral region, and the number of voxels with Lac/Cr ratios ≥1) measured in the area of abnormal MR imaging signal were significant predictors of survival. Multivariate analysis of spectra of 21 patients with brain metastases differentiated between patients surviving 5 months and patients with a shorter survival.
However, not all studies have found associations between metabolic indices and prognosis; for instance, in 16 patients with a B-cell lymphoma, presence of Lac and lipids in the spectra collected before treatment was not associated with overall survival. In another prospective 1 H MRS study, 50 patients with newly diagnosed low-grade gliomas (WHO grade II) evaluated before surgery showed no relationship between Cho and Cr levels in the tumor and survival.
Several studies have also examined the prognostic value of spectroscopy in pediatric brain tumors. In a 1 H MRSI study of 76 children with brain tumors, a low value (<1.8) of an index including Cho and lactate and lipid levels, normalized to contralateral Cr, was found to be a strong predictor of survival. In another study of children with recurrent gliomas, a high Cho/NAA ratio was associated with decreased survival.
Related posts:
 State-of-the-Art Pathology: New WHO Classification, Implications, and New Developments
 Molecular Tools: Biology, Prognosis, and Therapeutic Triage
 Advanced Imaging in Brain Tumor Surgery
 Liposomal Contrast Agents in Brain Tumor Imaging
 Novel Medical Therapeutics in Glioblastomas, Including Targeted Molecular Therapies, Current and Future Clinical Trials
 Clinical Trials in Brain Tumor Surgery
Stay updated, free articles. Join our Telegram channel

Full access? Get Clinical Tree


