▪
Introduction
Cardiomyopathies and myocarditis are disorders frequently encountered in clinical practice, and imaging plays a major role in the diagnosis, management, and follow-up of these diseases. This chapter will describe imaging of the cardiomyopathies that have characteristic imaging features and that are most commonly imaged in clinical practice.
▪
Imaging: What, Why, and How
Definition of a Cardiomyopathy
Cardiomyopathies are diseases of the heart muscle that may eventually lead to cardiac dysfunction or arrhythmias. They encompass a heterogeneous group of several myocardial disorders that manifest with various structural and functional phenotypes. Despite the common clinical use of the terms ischemic and hypertensive cardiomyopathies, cardiomyopathy does not include impaired cardiac function caused by cardiovascular disorders, such as atherosclerotic coronary artery disease (CAD), cardiac valve disease, systemic hypertension, or congenital heart disease, as defined by the 2006 American Heart Association (AHA) and 2008 European Society of Cardiology statements. The AHA classification divides the cardiomyopathies into primary and secondary cardiomyopathies, based on the predominant organ of involvement. Primary cardiomyopathies are confined to heart muscle and may be genetic, acquired, or mixed genetic and acquired ( Table 31.1 ). Secondary cardiomyopathies represent pathologic involvement of the myocardium in the context of a generalized systemic disorder ( Table 31.2 ).
| TYPE | EXAMPLES |
|---|---|
| Genetic | HCM, ARVC/D, LVNC |
| Acquired | Myocarditis, stress, and PPCM |
| Mixed | DCM, restrictive cardiomyopathy |
| TYPE | EXAMPLES |
|---|---|
| Infiltrative | Amyloidosis; Gaucher, Hurler, and Hunter disease |
| Storage | Hemochromatosis, glycogen storage, Anderson-Fabry and Niemann-Pick diseases |
| Toxicity | Drugs, heavy metals, chemical agents |
| Endomyocardial | Tropical endomyocardial fibrosis, hypereosinophilic syndrome |
| Granulomatous | Sarcoidosis |
| Endocrine | Diabetes mellitus, hyperthyroidism, hypothyroidism, hyperparathyroidism, pheochromocytoma, acromegaly |
| Cardiofacial | Noonan syndrome, lentiginosis |
| Neuromuscular, neurologic | Friedreich ataxia, Duchenne-Becker muscular dystrophy, Emery-Dreifuss muscular dystrophy, myotonic dystrophy, neurofibromatosis, tuberous sclerosis |
| Nutritional deficiencies | Thiamine, vitamin C (scurvy), carnitine |
| Autoimmune, collagen | Systemic lupus erythematosus, dermatomyositis, rheumatoid arthritis, scleroderma, polyarteritis nodosa |
| Consequence of cancer therapy | Anthracyclines, cyclophosphamides, radiation |
Reasons for Imaging Cardiomyopathy
An important role of imaging patients with cardiomyopathy is to differentiate the ischemic from nonischemic pattern of disease because heart failure is usually caused by myocardial ischemia and infarction. Ischemic disease is important to diagnose with coronary angiography, coronary CT angiography (CTA), or cardiac magnetic resonance imaging (CMR) because left ventricular (LV) function can improve following coronary revascularization in the presence of substantial viable myocardium. On CMR, abnormal late gadolinium enhancement (LGE) involving the subendocardium with a variable degree of transmurality and distributed in the vascular myocardial territory of a coronary artery is compatible with ischemic disease. CMR is a validated tool to differentiate viable from scarred myocardium with decreased potential of recuperation (nonviable) based on abnormal LGE involving less (viable) or more (nonviable) than 50% of the wall thickness.
Imaging is essential to assess the phenotypic expression of nonischemic cardiomyopathy and degree of cardiac dysfunction. CMR can identify infarcted or scarred myocardium by the presence of abnormal LGE, which has prognostic value and may influence clinical management—for example, deciding on the implantation of an automatic implantable cardioverter-defibrillator. Finally, the lack of ionizing radiation makes echocardiography and CMR important tools for screening relatives of patients with hypertrophic cardiomyopathy (HCM) or arrhythmogenic right ventricular cardiomyopathy or dysplasia (ARVC/D) and for the serial assessment of treatment response and complications of various cardiomyopathies.
Procedural Considerations
Problem Solving With Echocardiography
Transthoracic echocardiography is usually the first-line imaging modality to identify various cardiomyopathy phenotypes, assess for wall motion abnormalities, and measure chamber volume, ventricular ejection fraction, and wall thickness. Doppler echocardiography is helpful to evaluate cardiac valves and diastolic dysfunction. However, echocardiography is limited by substantial interstudy and interobserver variability. It may be inconclusive because of suboptimal acoustic window (e.g., obese patients) or because some areas (e.g., cardiac apex and the right ventricular [RV] free wall) are poorly visualized by transthoracic echocardiography. Transesophageal echocardiography improves visualization, but it is an invasive procedure requiring intubation of the esophagus, with a small risk of esophageal perforation, bleeding, and aspiration.
Problem Solving With Coronary CT Angiography
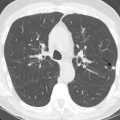
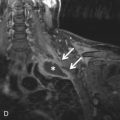
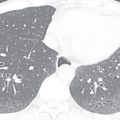
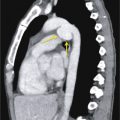
In newly diagnosed cardiomyopathy, it is important to ensure that the cardiac dysfunction is not caused by CAD-related ischemia or infarction. Although catheter angiography is the gold standard test, coronary CTA is a validated noninvasive alternative in patients with a low pretest probability of CAD (e.g., young patients with no risk factors for CAD). Functional data can be acquired to assess for wall motion abnormalities and measure the chamber volume, ventricular ejection fraction, and myocardial wall thickness. Delayed imaging after injection of iodinated contrast may also be performed to detect myocardial fibrosis, a technique similar to the LGE sequence in CMR. Although the contrast resolution, accuracy, and reproducibility of CMR to assess cardiac function and myocardial fibrosis are superior, coronary CTA is a helpful alternative in patients with contraindications to CMR (e.g., pacemaker). Incidental CT findings in the lung or mediastinum may suggest the cause of a cardiomyopathy. For example, abnormal LGE in the myocardium in the presence of mediastinal and hilar lymphadenopathy with lung nodules is suspicious for sarcoidosis. Signs of congestive heart failure may be seen on CT, including interlobular septal thickening, ground-glass opacity, pleural effusion, and borderline enlarged bilateral hilar lymph nodes.
Problem Solving With Cardiac Magnetic Resonance Imaging
CMR has become the most valuable modality to image cardiomyopathies and will be the focus of this chapter. It is complementary to other imaging modalities to assess for cardiac and pericardial morphology and cardiac and valve function, as well as myocardial perfusion. It also provides uniquely distinct data on the characterization of myocardial tissue. The imaging technique and protocols need to be tailored to the suspected pathology; therefore proper clinical information should be obtained prior to scanning time, and acquisition of the CMR images should be closely monitored.
Assessing Myocardial Morphology
Black blood imaging, using a fast spin-echo sequence with blood suppression performed through a double-inversion recovery pulse technique, is used to acquire static images with high in-plane spatial resolution of the morphology of the heart, pericardium, and great vessels. This sequence produces images in which the myocardium has intermediate signal intensity (SI) contrasting with the adjacent dark blood and bright epicardial fat.
Bright blood imaging, using a balanced steady-state free precession (SSFP) sequence acquired in multiple planes (vertical and horizontal long axis, three chamber, and short axis), provides cine images of high temporal resolution in which the blood pool is bright relative to the adjacent intermediate SI of the myocardium.
Assessing Myocardial Function
Bright blood imaging, using an ECG-segmented balanced SSFP sequence, yields dynamic functional imaging of the heart and can be acquired in any plane. The presence of regional wall motion abnormality can be depicted on SSFP sequence, with or without myocardial tagging technique. A stack of 20 to 30 consecutive, breath-hold, short-axis SSFP images, each acquired during a different cardiac cycle, from the base to the apex, can be interrogated with dedicated viewing software. It is the most accurate and reproducible method for the quantitative assessment of biventricular end-diastolic volumes, end-systolic volumes, ejection fractions, and myocardial mass. Quantitative assessment of the LV volume, ejection fraction, and mass of comparable accuracy can be achieved using a series of long-axis views radially acquired around the anatomic axis of the left ventricle. When CMR is performed to evaluate for ARVC/D, additional SSFP sequences are usually acquired in the right ventricular outflow tract (RVOT), as well as in the long-axis view of the right ventricle and axial plane for a better depiction of the motion of the RVOT and RV free walls.
Characterizing Myocardial Tissue
Myocardial Edema.
T2-weighted imaging, using a dual-echo, double-inversion recovery, fast spin-echo sequence in the short-axis plane, is used to detect fluid accumulation in the myocardium caused by focal myocardial edema and/or necrosis. It is depicted by abnormally high T2-weighted SI compared to the adjacent intermediate SI of the normal myocardium. However, diffuse myocardial edema with a homogeneous increase in the T2-weighted SI is more difficult to detect than focal edema. To improve detection of diffuse myocardial edema, the T2 ratio can be calculated to normalize the SI of the myocardium to that of the skeletal muscle. Myocardial T2 mapping, generated by acquiring multiple T2-weighted images repeated with different T2 preparation times, provides both visual and quantitative analyses of the myocardial edema and is a promising tool to diagnose diffuse myocarditis.
Myocardial Iron Deposition.
Iron is a paramagnetic element that alters the local magnetic field and results in a significant decrease in T2*-weighted SI of the affected myocardium. Levels of cardiac iron deposition can be quantified on T2*-weighted images, which is helpful to monitor patients with primary hemochromatosis or secondary hemosiderosis.
Myocardial Fat.
T1-weighted spin-echo imaging is helpful to depict fatty myocardial replacement associated with cardiomyopathies. Focal fatty replacement of the myocardium exhibits high SI on T1-weighted images and can be confirmed with fat saturation showing a loss of SI. Although ARVC/D is characterized by fibrofatty replacement of the myocytes on histology, the presence of fat in the RV wall on imaging is not a diagnostic criterion of ARVC/D due to lack of specificity for this common finding. It usually represents a physiologic change related to age. The presence of subendocardial fatty metaplasia of the LV myocardium in the territory of a coronary artery is indicative of prior myocardial infarction. The presence of myocardial fat has also been described in cardiomyopathy associated with tuberous sclerosis complex or muscular dystrophy and in dilated cardiomyopathy (DCM).
Myocardial Fibrosis.
LGE imaging, performed with an inversion recovery, gradient echo T1-weighted sequence, is an extremely powerful tool to characterize cardiomyopathies based on the pattern of myocardial fibrosis. Images are acquired 10 to 20 minutes after the injection of gadolinium, with the trigger delay set for systole or diastole. Images are usually acquired in the short-axis view, but additional orthogonal views are often useful to confirm the presence of an abnormality and better visualize the apex. The inversion time is set to null the normal (RV or LV) myocardium that should appear dark, whereas the pathologic myocardium appears bright due to necrosis (acute disease) or fibrosis (chronic disease) expanding the extracellular space and accumulating gadolinium. The pattern of abnormal LGE can be diffuse, patchy, nodular, or linear in appearance, and its distribution is divided into subendocardial, midmyocardial, and subepicardial regions. The subendocardium is the innermost portion of the myocardium and is the most sensitive to ischemia and infarction. The subepicardium refers to the outermost portion of the myocardium. The midmyocardium (or mesocardium) is the myocardium lying between the subendocardium and subepicardium. The localization of abnormal LGE in the LV myocardium is described using the 17-segments model of the AHA with six basal segments, six midventricular segments, four apical segments, and the apex. The pattern of abnormal LGE not only enables differentiation between ischemic and nonischemic cardiomyopathy but also provides a differential diagnosis to establish the cause of the nonischemic cardiomyopathy ( Table 31.3 ).


The LGE imaging technique is designed to optimize discrimination between the enhancement of focal myocardial fibrosis (abnormal LGE) and enhancement of normal myocardium nulled by the selected inversion recovery time. As a result, it fails to demonstrate diffuse myocardial fibrosis because its signal is diffusely suppressed by the selected inversion recovery time. Different CMR techniques have been developed to detect diffuse myocardial fibrosis, such as the T1-weighted early global enhancement ratio, which compares the early uptake of gadolinium in the myocardium to the uptake in skeletal muscle. The T1-weighted early global enhancement ratio is increased in diffuse myocardial fibrosis, as well as in myocarditis. This can be measured via multiple T1-weighted acquisitions before and after contrast, in correlation with the hematocrit level, via a technique known as extracellular volume ratio calculation, which is a marker of diffuse abnormalities, most often fibrosis. Another technique, called T1 mapping, can visualize and quantify changes in T1 signal due to diffuse myocardial fibrosis, often occurring before any other imaging findings. T1 mapping is performed using fast gradient echo sequences with multiple increasing inversion times (50–1000 ms), without and/or after injection of gadolinium. Precontrast T1 mapping measures intrinsic myocardial contrast. T1 is higher when the extracellular compartment is increased due to fibrosis, edema, or amyloidosis. T1 is lower in lipid (seen in Anderson-Fabry disease) and iron accumulation. Postcontrast T1 mapping quantifies the expansion of the extracellular volume (interstitium) due to fibrosis, amyloidosis, or edema.
Assessing Myocardial Perfusion
A T1-weighted perfusion sequence performed at rest after the injection of gadolinium can demonstrate a defect of myocardial perfusion in the region of myocardial scarring, and this can be helpful to differentiate scarring from myocardial edema, which has normal to increased perfusion when both myocardial scarring and edema show an abnormal LGE.
Assessing for Blood Flow Acceleration
Intracardiac or transvalvular blood flow acceleration resulting from stenosis or regurgitation may be visualized on SSFP or gradient-recalled echo sequences (e.g., an acceleration jet in the left ventricular outflow tract [LVOT] in obstructive HCM). However, phase contrast imaging is more sensitive and provides an accurate quantification of flow velocities and volumes. It is used to assess for valve stenosis or regurgitation, to measure the degree of obstruction in obstructive HCM, and to assess diastolic dysfunction in restrictive cardiomyopathy.
▪
Primary Cardiomyopathies
Genetic Cardiomyopathies
Imaging Hypertrophic Cardiomyopathy
HCM is characterized by inappropriate LV hypertrophy with nondilated ventricular chambers and unexplained by any other cardiac or systemic disease, such as aortic stenosis or systemic hypertension. HCM is caused by mutation in one of the genes encoding sarcomeric proteins and is characterized on histology by disorganization of the myofibrils with myocardial hypertrophy and fibrosis. HCM is the most common primary genetic cardiomyopathy, with an estimated prevalence of 0.2% in the general population; 60% of cases are genetically transmitted, and familial clustering of HCM is frequent. The clinical presentation and natural history of HCM are highly variable. Some individuals remain asymptomatic and undiagnosed, whereas others may present with symptoms of intraventricular obstruction (usually occurring at the level of the LVOT), myocardial ischemia, diastolic dysfunction, heart failure, or ventricular arrhythmia. HCM is the most common cause of sudden cardiac death (SCD) caused by ventricular arrhythmias in young individuals and apparently healthy athletes, with a mortality rate of about 0.5% to 1.0% per year.
An increased end-diastolic wall thickness of the LV myocardium of 15 mm or greater in adults (or the equivalent threshold relative to body surface area in children) is the hallmark of HCM. Patients with hypertension or who practice regular and intensive physical training (so-called athlete’s heart) may have ventricular hypertrophy due to remodelling, but the LV wall thickening is usually symmetric (concentric) and borderline increased (12–15 mm; normal LV wall thickness <12 mm), and an athlete’s heart often presents with concomitant mild LV dilation proportional to the LV wall thickening.
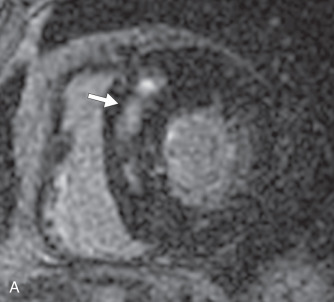
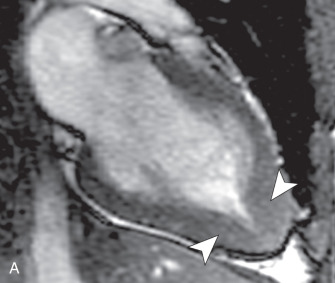
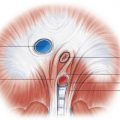
There are several morphologic variants of HCM according to the distribution of the wall thickening. Asymmetric septal hypertrophy is the most common variant, predominating in the anterior and anteroseptal walls of the basal LV. A spiral pattern of LV wall thickening is common, starting in the anterobasal wall and moving in a counterclockwise spiral toward the LV apex to involve the inferoseptal wall ( Fig. 31.1 ). The apical variant of HCM is a nonobstructive form, with thickening of the LV apex and/or loss of the normal tapering of the LV wall thickness from the base toward the apex. There is obliteration of the apical cavity, sometimes with a spadelike appearance of the LV cavity ( Fig. 31.2A ). Apical HCM has a high prevalence in Japan, and the diagnosis is suspected in the presence of T-wave inversion in the anterolateral leads on the electrocardiogram (ECG). Another variant of HCM is the midventricular form (see Fig. 31.2B ). It often induces an intracavitary gradient between the LV apex and base, causing a noncontractile apical aneurysm (2% of HCM patients) at risk for apical thrombus formation. Symmetric (concentric) HCM is a less common variant (5%). RV involvement is seen in 18% of HCM patients. In a minority of patients with HCM (5%–10%), there is progressive adverse ventricular remodelling, leading to end-stage dilated HCM.


On echocardiography, the diagnosis of HCM relies on the demonstration of LV wall thickness >15 mm and/or an increased ratio (>1.5:1) of septal to opposed posterior LV wall thickness. Doppler echocardiography can evaluate for diastolic dysfunction that is often present in HCM due to increased chamber stiffness and impaired ventricular relaxation. Nevertheless, about 6% to 12% of HCM cases are undetected by echocardiography, likely because some areas (e.g., LV anterolateral wall, cardiac apex, RV free wall) are not well visualized by echocardiography. The measurement of precise wall thicknesses by ultrasound has been shown to be discrepant with gold-standard MRI in roughly half of patients, most often due to overestimation, with clinically significant thresholds involved in 16% of cases.
The primary role of CMR is clarification of the diagnosis and phenotype of HCM. Cine images typically show normal or increased systolic function, with normal to decreased ventricular volumes, and can show near-complete obliteration of the LV cavity at the midventricular and/or apical levels during systole. The LV end-diastolic wall thickness is measured perpendicular to the myocardial wall on short-axis SSFP images, combined with long-axis SSFP images for the measurement of the wall thickness of the apical segments. Tangential orientation of the imaging plane to the LV wall should be avoided because it may lead to overestimation of the wall thickness.
A three-chamber SSFP sequence and phase contrast imaging performed across the LVOT are used to depict and quantify the systolic flow acceleration across the LVOT, adjacent to the upper septal hypertrophy in the asymmetric septal variant of HCM. A three-chamber view is the best to assess for systolic anterior motion of the anterior mitral valve leaflet that may further exacerbate the LVOT obstruction and cause a posteriorly directed jet of mitral regurgitation, with left atrial enlargement (see Fig. 31.2C ) A phase contrast sequence is used to measure peak velocities across the LVOT that can be translated into a pressure gradient using the modified Bernoulli equation (mm Hg = 4 × [peak velocity, in m/s 2 ]). A gradient >55 mm Hg is considered obstructive and may be present at rest or provoked by exercise, Valsalva maneuver, or administration of amyl nitrite. The imaging plane of the phase contrast sequence should be positioned perpendicular to the LVOT where the signal void is best visible to ensure measurement of the peak velocity encountered in the LVOT. Phase contrast imaging is also used to quantify mitral regurgitation or measure the pressure gradient between the base and apex in the midventricular form of HCM.
LGE sequences should be obtained to assess for myocardial fibrosis in the areas of ventricular hypertrophy. The typical pattern of abnormal LGE in HCM is patchy, located in the midmyocardium of the hypertrophied segments or adjacent to the RV insertion points at the midventricular level. The presence and extent of abnormal LGE is an independent predictor of an adverse outcome, such as ventricular arrhythmias, SCD, and heart failure.
CMR is helpful to evaluate treatment response in HCM. The effects of medical treatment on the degree of LVOT obstruction can be monitored with phase contrast imaging. The success of surgical septal myomectomy, septal alcohol ablation, or septal coiling can be assessed with cine images, phase contrast imaging, and LGE imaging to locate and evaluate the extent of the site of septal reduction, detect if this area is too small or located outside the target area, and monitor the pressure gradients across the LVOT. Reduction of LVOT obstruction in symptomatic patients is associated with improved systolic function and a significant reduction in the myocardial mass.
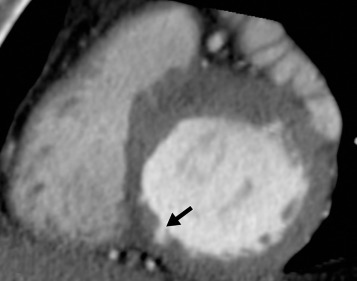
On coronary CTA, deep myocardial bridging of the left anterior descending coronary artery occurs more frequently in HCM than in other cardiac disorders, with or without LV hypertrophy. Deep muscular clefts (or crypts) in the basal inferoseptal wall of the LV can be present in normal subjects, but is now recognized as a morphologic expression of HCM that is sometimes present in HCM mutation carriers who have not yet developed the disease ( Fig. 31.3 ).
Imaging Arrhythmogenic Right Ventricular Cardiomyopathy
ARVC/D is a rare inherited autosomal dominant disorder characterized by genetic mutations in the cardiac desmosomes, which provides structural links between myocytes. It results in progressive loss of myocytes in the right ventricle and, less commonly, in the left ventricle, with inflammation, repair, and fibrofatty replacement of myocardial tissue. It predominantly affects the inferior, apical, and infundibular part of the thin RV wall (so-called triangle of dysplasia) and the inferolateral wall of the LV, leading to focal areas of RV wall thinning, aneurysm formation, dyskinesis, and eventually evolving to global RV dilation and dysfunction. The estimated prevalence of ARVC/D in the general population ranges from 1 in 1000 to 5000, with an increased prevalence in Italy. Its clinical manifestations are variable and include ventricular arrhythmias with a substantial risk of SCD, particularly in young people and athletes. This disorder is progressive, and early detection is important in patients with ventricular arrhythmias or positive family history of ARVC/D to prevent SCD by implantation of an automatic implantable cardioverter-defibrillator.
RV endomyocardial biopsy is an invasive procedure with low diagnostic yield in ARVC/D because of the patchy and predominantly epicardial distribution of the fibrofatty replacement. Diagnostic criteria for ARVC/D were established by the Arrhythmogenic Right Ventricular Dysplasia Task Force in 1994 and include major and minor criteria for structural, histologic, electrocardiographic, arrhythmic, and genetic features. Revised criteria were proposed in 2010 to increase the diagnostic sensitivity and to include specific imaging criteria for two-dimensional echocardiography, CMR, and angiography ( Box 31.1 ). Either two major criteria, one major plus two minor criteria, or four minor criteria have to be present to diagnose ARVC/D. Because imaging findings can only account for one major or one minor criterion, the diagnosis of ARVC/D does not rely solely on imaging and requires additional criteria based on family history, electrocardiographic changes, and/or endomyocardial biopsy. Diagnosis of ARVC/D is challenging, and imaging findings may be normal in the early stage, although patients are still at risk for SCD.
Related posts:
Stay updated, free articles. Join our Telegram channel

Full access? Get Clinical Tree


