NECT
CTA
CTV
4D-CTA
VPCT
Stroke
x
x
(x)
x
Hemorrhagic stroke
x
x
(x)
(x)
(x)
AVM
x
x
Fistula
x
x
Aneurysms
x
Venous thrombosis
x
x
Moyamoya
x
x
(x)
(x)
Vasculitis
x
x
RCVS
x
x
Brain death
x
xa
xa
Because acquired MDCT data are nowadays nearly isotropic, various image post-processing techniques can be applied. CTA data can be viewed in arbitrary directions without loss of image quality, maximum intensity projections (MIP) can be interactively calculated, and 3D visualizations of the vascular tree can be constructed. For detection of intracranial aneurysms, CTA has largely replaced DSA as the first-line imaging modality [1]. MRA techniques are also used for screening on vessel pathology; however, CTA with its higher spatial resolution and better availability is often used for detailed imaging and treatment planning. New applications like dynamic CTA and dual-energy CT (DECT) are emerging and are more and more used in daily practice.
This chapter aims to give an update on state-of-the-art CT imaging of intracranial vessels.
The anatomy of the intracranial vessels and some anatomical variations are described first. This is followed by technical aspects of CT imaging of the intracranial vessels. Finally, indications and protocols for imaging the intracranial vasculature are described.
Anatomy of the Intracranial Vessels
Brain tissue has a high oxygen demand and has hardly any capabilities of anaerobic metabolism, which makes it totally dependent on oxygen and nutrients supplied via the circulating blood [2]. Total disruption of blood flow to the brain causes unconsciousness within 5–10 s. The brain is supplied by both the carotid arteries and the vertebral arteries. The carotid arteries arise from the aortic arch and the brachiocephalic trunk and the vertebral arteries originate from the subclavian arteries. The carotid and vertebrobasilar system are connected to each other via the circle of Willis.
Carotid Arteries
The internal carotid artery (ICA) enters the mastoid bone through the carotid canal. The vessel ascends in vertical direction, followed by a horizontal course (vertical and horizontal petrous (C2) segment) and then runs anterior to the tympanic cavity. The ICA is separated from the tympanic cavity by a 0.5 mm thick bony plate. It traverses the foramen lacerum of the sphenoid bone to enter the middle cranial fossa (C3 segment). Then the ICA traverses the cavernous sinus (C4 segment), after which it perforates the dura near the clinoid process (Fig. 1).
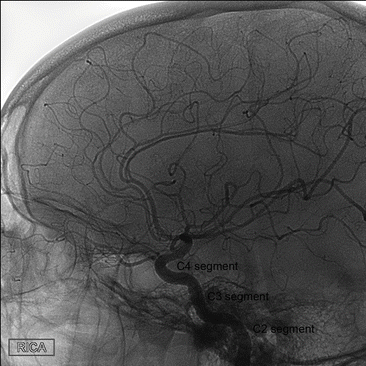

Fig. 1
Anatomy of the internal carotid artery. Lateral projection of angiographic image during selective contrast injection in the right internal carotid artery. The C2–C4 segments are pointed out
Some variations of the ICA should be recognized because they can influence surgical or interventional procedures [3]. An aberrant course of the ICA through the middle ear [4] should be recognized to prevent complications in middle ear surgery. Another aberrant course of the ICA is the lateral pharyngeal ICA (Fig. 2) in which the internal carotid arteries are elongated and course partially in the midline just posterior to the pharyngeal wall.
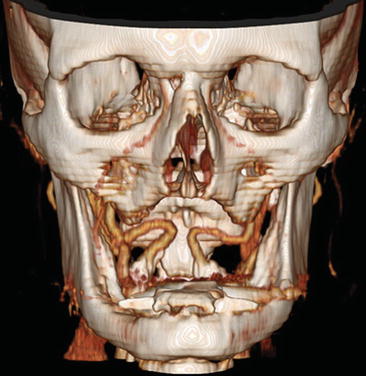

Fig. 2
Seventy-eight y/o old male, presenting with TIAs in the left hemisphere. CTA shows bilateral high-grade carotid stenosis with calcification and medialization of the internal carotid arteries: kissing carotids
Circle of Willis and Its Variations
The circle of Willis provides a potential source of collateral blood flow between the carotid and the vertebrobasilar circulation in case of occlusive vascular disease. The anatomy of the circle of Willis is illustrated in Fig. 3. The ICA bifurcates into the middle cerebral artery (MCA) and the first segment of the anterior cerebral artery (ACA), also called the A1 segment. The bilateral A1 segments are connected to each other by the anterior communicating artery (Acom), after which they give rise to the A2 segments which course anteriorly. Some millimeters caudal from the top of the ICA the posterior communicating artery (Pcom) originates from the ICA and courses posteriorly to join the P1 segment of the posterior cerebral artery (PCA), which originates from the basilar artery. The circle of Willis is highly variable [5, 6] and is complete in only 20–25 % of people [7]. When incomplete, there is a potential risk of insufficient collateral blood flow in case of large vessel occlusion.
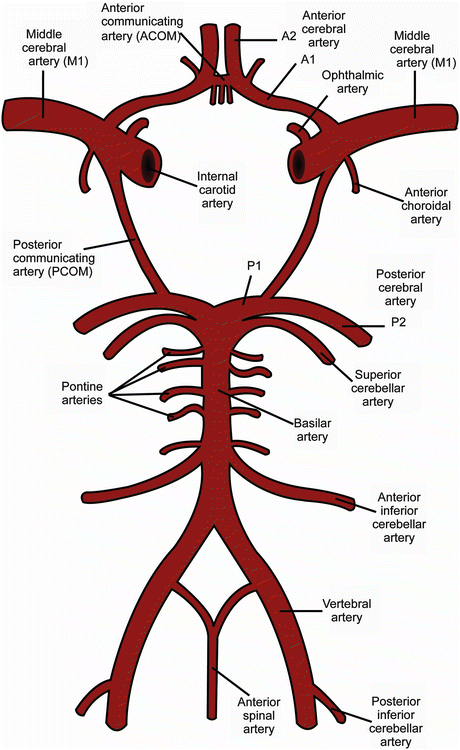

Fig. 3
Anatomy of the circle of Willis
Figure 4 illustrates a well-known variant, a hypoplastic left A1 segment with filling of the left A2 via the Acom.
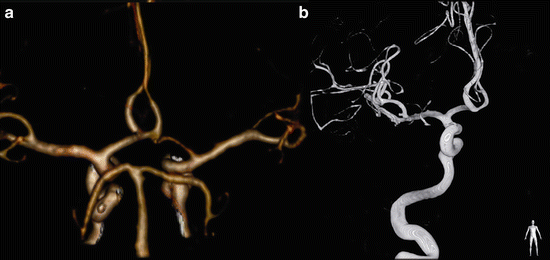

Fig. 4
Fifty-six y/o female presented with subarachnoid hemorrhage. No aneurysms were found at CTA and DSA. CTA (a) demonstrates a hypoplastic left A1 segment, the Acom is demonstrated, suggesting that the left A2 is (partially) supplied via the Acom. DSA (b) demonstrates filling of the left A2 segment after contrast administration of the right carotid artery
Most variations in the circle of Willis occur at the location of the Pcom; a complete posterior part of the circle is only present in 31 % of people [6]. Absence or hypoplasia of the Pcom is often seen. Another variant is the fetal PCA or fetal configuration of the PCA, in which the Pcom has the same caliber as the PCA and is combined with a hypoplastic P1 segment (Fig. 5) [8]. In these patients collateral blood flow to the PCA territory from the vertebrobasilar system in case of carotid occlusion is diminished or absent. This variant is even more important when combined with an ipsilateral absent A1 segment.
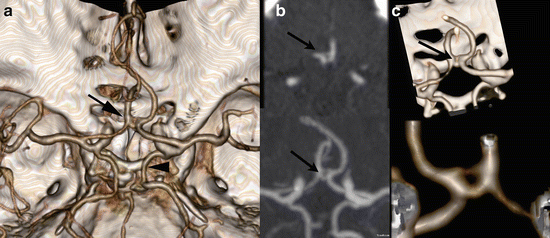

Fig. 5
An 80 y/o male presented with ischemic stroke in the left hemisphere. No occlusions were found at CTA. Two normal variants were present. The fenestration of the Acom (arrows) is demonstrated at CTA of the circle of Willis (a), at the CTA source images (b), MIP reconstructions (c), and detailed volume rendering without (d) and with bone removal (e). The arrowhead points out bilateral fetal configuration of posterior cerebral artery (a)
Another frequently encountered variation is the presence of an infundibulum of the Pcom. An infundibulum is a widening of the ICA located exactly at the origin of the Pcom. It is symmetric and should be smaller than 2 mm, and the Pcom originates from its apex. This variant should be distinguished from an aneurysm.
Normally two anterior cerebral arteries are present, one for each hemisphere. In case of an azygos anterior cerebral artery the ACA territories of both hemispheres are supplied by a single midline A2 segment (Fig. 6), which is rare and has a prevalence of 0.2–4.0 %. It is associated with aneurysms.
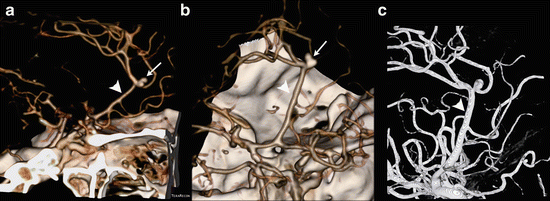

Fig. 6
A 50 y/o male presented with a subarachnoid hemorrhage, due to a pericallosal aneurysm (arrow). As coincidental normal variant an azygos configuration of the anterior cerebral artery was present. The pericallosal aneurysm was treated by surgical clipping. Lateral (a) and superior oblique (b) view of volume-rendered CTA demonstrates the azygos configuration (arrowheads). The arrow points to the bilobar pericallosal aneurysm. These findings were confirmed at DSA (c)
In case of a trifurcated ACA, the Acom gives rise to three anterior cerebral arteries, one of which probably is a persisting median callosal artery (Fig. 7). A bihemispheric ACA represents hypoplasia of one A2 segment, which only supplies the callosomarginal arteries. The contralateral A2 segment then provides the major arterial supply of the ACA territories bilaterally. A more rare persisting primitive olfactory artery [8] is illustrated in Fig. 8. Most ACA anomalies have a higher prevalence of aneurysms [9, 10].
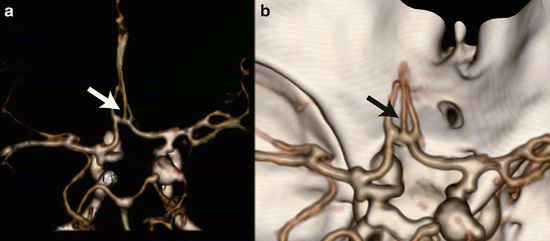
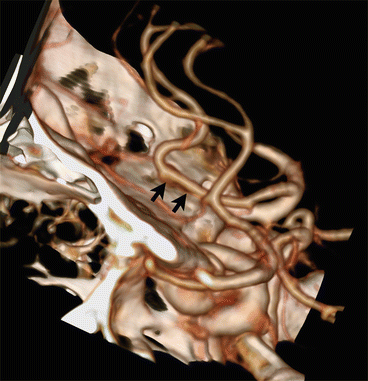

Fig. 7
A 32 y/o female presented with a subarachnoid hemorrhage, based on a posterior communicating aneurysm. A persistent median artery as coincidental finding is shown at VR CTA (arrows)

Fig. 8
Sixty-seven y/o male presented with head trauma and (traumatic) subarachnoid hemorrhage. No aneurysm or vascular malformation was found. A rare variant, an olfactory extension of anterior cerebral artery, was noted (arrows) and shown at the lateral oblique VR CTA of circle of Willis
The anterior part of the circle of Willis can also be incomplete. The Acom can be hypoplastic or absent. A hypoplastic A1 segment has a prevalence of 14 %, whereas the absence of an A1 segment has a prevalence of 2 % [6]. In a fenestration the arterial lumen divides into separate lumens that converge. In case of the basilar artery this represents a persisting non-fusion of two longitudinal neural arteries [9]. Fenestrations increase the incidence of aneurysms, probably because turbulent flow is created in the proximal and distal end of the fenestration [10]. However, in practice aneurysms are seldom found at the fenestration [11]. Intracranial arterial fenestration is more common in the vertebrobasilar arteries than in the arteries of the anterior circulation (Fig. 5) [11].
Venous Anatomy
The venous drainage of the brain courses via the deep and the superficial venous system. The internal cerebral veins drain in the vein of Galen, which merges with the inferior sagittal sinus to form the straight sinus, which drains in the superficial venous system. The superficial venous sinuses are formed by the superior sagittal sinus, transverse sinuses, and sigmoid sinuses which drain bilaterally in the internal jugular vein. Fenestrations can also occur in the venous sinuses.
Persistent Carotid-Basilar Artery Anastomoses
In the embryologic development of the intracranial circulation primitive carotid-basilar artery connections are present which usually regress completely [13]. Rarely, such connections remain patent through adult life and should be recognized before surgery or interventions. The trigeminal artery is the most common persisting carotid-basilar anastomosis [14]. This most cranially situated persistent carotid-basilar anastomosis has a prevalence of 0.1–0.6 % [15]. Two patterns are most commonly encountered. In the first pattern the persistent trigeminal artery connects with the upper basilar artery and supplies the posterior cerebral artery and superior cerebellar artery territories. Alternatively, one or two fetal type posterior cerebral arteries are present and the trigeminal artery supplies the posterior fossa (Fig. 9). In a variant persisting trigeminal artery a cerebellar artery originates from the ICA. A persistent trigeminal artery should be recognized before performing a Wada test to avoid infusion of barbiturates into the posterior fossa [16].
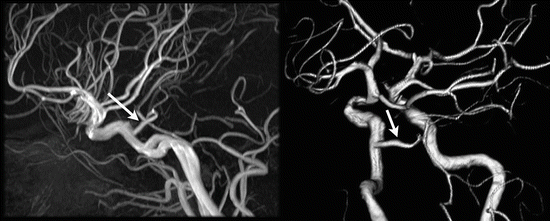

Fig. 9
Thirty-five y/o old woman, MR angiographic exam performed for surveillance of ophthalmic aneurysm after coiling. Arrow points to persisting trigeminal artery. In this patient, the persistent trigeminal artery only supplies the posterior fossa because of a bilateral fetal configuration of the posterior cerebral artery
Another, more rare, persisting anastomosis is a primitive hypoglossal artery with a prevalence of 0.02–0.1 % [17]. A primitive hypoglossal artery represents a connection between the proximal cervical ICA and the basilar artery that traverses the hypoglossal canal. A persisting proatlantal intersegmental artery originates at a similar location but traverses the foramen magnum. This connection can also arise from the external carotid artery [8].
Vertebrobasilar Arteries
The most common variation of the vertebrobasilar system is the vertebral artery continuation as posterior inferior cerebellar artery (PICA), illustrated in Fig. 10 [19]. The reported prevalence is about 4.4 % [18]. Recognizing this variation is important before performing cerebral angiography. Duplications and fenestrations of the vertebrobasilar system can occur. In a duplication the two vessels have a different course (Fig. 11); in case of a fenestration the two lumina correspond to the same path [19].
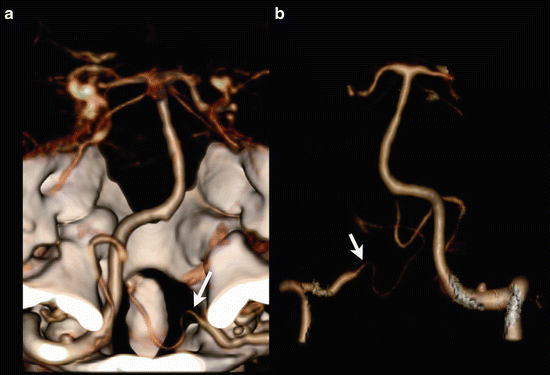
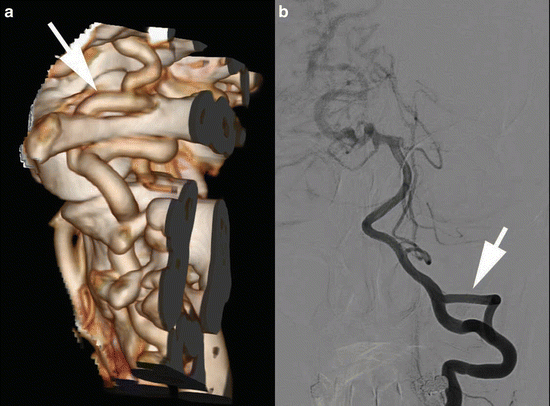

Fig. 10
Seventy-four y/o female, CTA performed for evaluation of subarachnoid hemorrhage. Right vertebral artery ends in posterior inferior cerebellar artery. VR-CTA posterior view (a) and VR-CTA after bone-removal anterior view (b) demonstrate a pica ending of the left vertebral artery (arrows)

Fig. 11
Fifty-six y/o female presented with a large arteriovenous malformation (AVM) of the brain. A CTA was followed by DSA for evaluation of the AVM. VR-CTA (a) depicts the duplication of the left vertebral artery (white arrows) at the craniocervical region, which is easier depicted at DSA (b) because of bone subtraction
Technical Considerations
This paragraph gives an introduction on basic CT scanning parameters, contrast media (CM) characteristics, and settings, which are important for high-quality CT angiography (CTA) of the intracranial vessels.
Scanning Parameters
For detailed imaging of intracranial vessels a high spatial resolution is mandatory. Therefore, the thinnest possible collimation is recommended. Imaging should be fast to minimize motion artifacts and to potentially reduce the length of the contrast bolus. Therefore fastest gantry rotation in combination with a slightly overlapping pitch should be chosen. Image quality in terms of signal-to-noise ratio is best if an overlapping helix of data is acquired. The degree of overlap of acquired image data can be set by the pitch, which is the table speed divided by the collimation. A tube voltage of 120 kV is commonly used, but kV settings of 100 kV have been proven to improve contrast-to-noise ratio (CNR). Images should be reconstructed with thin slices (e.g., 1 mm or less) with an overlap of 30 % (e.g., slice increment of 0.7). This allows the use of isotropic data for optimal post-processing (e.g., multiplanar reformation (MPR) in arbitrary directions).
Contrast Media
To achieve optimal enhancement in CTA, the amount of iodine injected per second (iodine delivery rate (IDR) or iodine flux in gI/s) is the most important factor [20, 21].
Different concentrations of iodine can be used; typically the concentration ranges between 300 mg iodine/ml and 400 mg iodine/ml. For optimal vessel enhancement, an iodine delivery rate (IDR) of 1.6–2.0 g/s is recommended (e.g., 80–100 ml of iopromide 300 mg/ml at 6 ml/s). Contrast agent injection should be followed by a saline chaser with the same flow rate for better bolus shaping and for flushing the dead space from the site of injection to the region of interest.
Contrast media (CM) have a high viscosity dependent on temperature and osmolality. Increasing the CM temperature to body temperature prior to injection significantly decreases its viscosity [22]. Thus pre-warming CM prior to injection to body temperature is recommended at all times.
Timing
The preferred method for timing of the acquisition with respect to CM injection is bolus triggering. A region of interest (ROI) is placed in the internal carotid artery (ICA) just below the skull base. After CM injection this slice is continuously imaged and the Hounsfield units (HU) of the ROI are automatically measured. The scanner automatically starts scanning when the Hounsfield units exceed a certain threshold (mostly 120 HU). This method results in the best timing and optimal arterial enhancement. Adequate training of technicians is important, as manual scan start might be required if patient movement has occurred or the ROI was difficult to place due to anatomical variations.
Alternatively, a test bolus can be used. A small amount of CM (e.g., 20 ml) is injected at the same rate as the original bolus, and then a slice through the carotid arteries is scanned continuously. The time between injection and contrast arrival in the carotid arteries is measured. This delay is then used for the actual scan. The advantage of this method is its robustness; it is tailored to the individual patient and his or her cardiac output. However, additional CM is used, which does not contribute to the imaging.
CT Venography of the Brain
CT imaging is also suitable to image the venous structures of the brain. Venous sinus thrombosis can be detected with CT as well as with MRI with equal sensitivity [23, 24]. For the detection of venous sinus thrombosis CT imaging is performed 40 s after the start of contrast injection. For venous imaging the injection speed can be lower than for arterial imaging, e.g., injection speed 3 ml/s, IDR 0.9 g/s followed by a saline chaser of 40 ml with 3 ml/s. The whole vertex should be included in the scanning volume to depict the whole superior sagittal sinus. Bone subtraction can be used to calculate maximum intensity projections (MIPs) of venous structures [25]; however source images should also be viewed to prevent misdiagnosis caused by bone subtraction artifacts due to the close relation of the dural sinuses with surrounding bone.
Dual-Energy CT of the Intracranial Vessels
Dual-energy CT (DECT) is nowadays available on selected scanners. Scanning with two different energies simultaneously makes it possible to decompose materials with high and low atomic number by their attenuation differences for different X-ray energies [26]. In atoms with a low atomic number, Compton scatter is the main interaction with diagnostic X-ray photons. For atoms with a high atomic number, the photoelectric effect plays the main role. If an X-ray photon has slightly more energy than the k-shell electron-binding energy of an atom, photoelectric absorption can take place, which leads to a sudden increase in X-ray attenuation at this energy (k-edge) [27]. The k-shell electron is then ejected and its vacancy is filled up by adjacent electrons and characteristic X-rays are emitted [28]. The k-edges of iodine (33.2 keV) and calcium (4 keV) are sufficiently different from the k-edges of the constituents of soft tissue (0.01–0.53 keV) to be detected by dual-energy imaging. One of the energies is chosen at a low value, mostly 80 kV. The other energy is chosen higher, e.g., 140 kV. The spectrum of energies emitted by the X-ray source always forms a Gaussian bell curve, so also photons around 33 keV are present in an 80 kVp (kilo Volt peak) bundle. These are strongly attenuated because they approximate the k-edge of iodine. Based on the DECT-data iodine, calcium and hemorrhage can be discriminated. The characterization of iodine and calcium can be used for bone removal [27]. The characterization of iodine and hemorrhage can be used to calculate iodine only and virtual non-contrast images and can be used to differentiate CM from hemorrhage, e.g., after interventional procedures and for the analysis of intracranial hemorrhage [29–33]. Alternatively, DECT data can be used to calculate mono-energetic reconstructions, which can be applied for reduction of beam-hardening artifacts, for instance around dental restorations [34] and metallic implants [35]. The first potential applications of such reconstructions for angiographic applications have been reported for pulmonary CTA [36] and CTA of abdomen and extremities [37]. CNR for angiographic images can be increased for low kV reconstructions, potentially allowing for the use of less contrast agent [38, 39], which can also be applied in cranial CTA [29].
Bone Removal
Bone subtraction can be performed to simplify vessel analysis. Bone subtraction can be performed in various ways. First, two scans can be performed (non-contrast enhanced–contrast enhanced) which are subtracted from each other [40, 41]. Secondly, various vendors developed software for threshold-based bone subtraction. A third alternative is DECT based bone subtraction [42–44].
Caution should be taken, as the degree of stenosis can be overestimated due to blooming artifacts or because of the suboptimal distinction of calcification and iodine due to poor enhancement of the artery [44]. Furthermore, segmentation errors may occur, especially at the skull base. Thus bone removal techniques can only be an add on—viewing of the source images, including post-processing, is always recommended.
Dynamic Evaluation of the Vessels
Dynamic evaluation of the vessels is possible with time-resolved CTA, a relatively new application, also called time-invariant CTA, dynamic CTA, or 4D-CTA [45, 46, 47]. It has the potential benefit to demonstrate collateral vessels and drainage flow, next to the depiction of the cranial vessels [47, 48].
With the newest MDCT scanners, allowing for a large coverage in the z-direction or a back-and-forth sliding table (shuttle mode), dynamic CTA with high temporal resolution has become possible [49, 50]. The first applications of dynamic CTA (4D-CTA) for imaging of arteriovenous malformations have been described recently [46, 51–53]. Dynamic evaluation of the vessels is also described in the evaluation of ischemic stroke patients [50, 54, 55] and in venous occlusions [48].
Post-processing Techniques
Scanning with thin collimation and reconstructing thin overlapping slices allow for possibilities of reconstruction in arbitrary angles without sacrificing spatial resolution. Scan thin, review thick is the basic rule [56]. Several post-processing techniques are available.
Multiplanar Reformat
High near-isotropic resolution of CT allows interactive slice reconstruction in arbitrary angles. In multiplanar reformat (MPR) the mean attenuation from the pixels is used. The slab can be reconstructed in arbitrary thickness. To ensure good quality of MPR images in the z-direction, an overlap of 30 % of the slice width is recommended [56]. Care should be taken for partial volume of vessels with adjacent bone. An occlusive thrombus is not obscured by MPR reconstructions, in contrary to volume and surface rendering.
Maximum Intensity Projection
The maximum HU value of a selected stack of slices is displayed in a maximum intensity projection (MIP). The thickness of the MIP and its direction can be changed interactively. This is especially suited for evaluating the patency of vessels which do not course exactly in a thin slice. MIP projections facilitate the diagnosis of vessel occlusions [57]. However, MIP projections have limitations. Structures with high density like bones or calcifications in the selected stack of slices hamper the analysis of nearby vascular structures. Secondly, MIP projections are actually 2D representations of 3D data, making 3D relations between different structures difficult to evaluate [58].
Volume Rendering and Surface Rendering
Nowadays many different choices regarding 3D rendering of vascular structures are available. In the past, surface rendering was the mostly used technique. With the increased availability of computational power, currently volume-rendering techniques (VRT) are most often used. In VRT, each voxel is represented by the percentages of the different tissues it contains. Each tissue type is given a color and transparency. Three-dimensional representations are then computed by ray casting, simulating rays of light traversing the dataset [58]. 3D representations of CT data vary per company. The window and level settings of such renderings can often be changed interactively.
Caution should be taken, as 3D rendering techniques allow image manipulation which might also conceal pathologies—thus source images should be interpreted at all times.
Indications
Indications for CT of the circle of Willis and intracranial arteries are expanding over the years, thanks to the increase in quality and availability of CTA. Even though DSA is still considered the gold standard, CTA and MRA are the first-choice noninvasive imaging modalities, thanks to good availability—especially CTA—and high quality of diagnostic imaging.
The detection of anatomical variations of the circle of Willis is highly accurate with CTA compared with DSA, with an overall agreement of 92.4 %. However, the detection of hypoplastic segments with CTA is more difficult and CTA has a low sensitivity [59]. CTA has a high sensitivity and specificity compared to DSA for the detection of the fetal origin of the posterior cerebral artery, a relatively frequent and relevant anatomical variation [60].
In this section concerning the indications of CTA we discuss stroke and intracranial atherosclerosis imaging, imaging of aneurysms, vasculitis, vascular malformations like AV-fistulae and arteriovenous malformations, and less frequent diseases like reversible cerebral vasoconstriction syndrome and Moyamoya. CTA in brain death procedure is discussed.
Ischemic Stroke
Stroke, “a cerebrovascular accident (CVA),” is an acute neurological deficit.
Most strokes (80 %) are due to an ischemic event. Twenty percent of strokes are hemorrhagic.
The etiology of stroke varies with the stroke subtype [61] as well as its outcome and recurrence risks.
Etiological mechanisms are atherosclerotic strokes, small vessel disease, cardioembolic disease, or undetermined/other [62].
Atherosclerotic (ASVD) strokes are the most common type of acute arterial ischemia.
40–50 % of stroke is due to atherosclerosis. Most occlusions in larger vessels are due to emboli. Common locations for symptomatic atherosclerosis are
Origin of ICA (bifurcation)—Caucasians
Intracavernous portion of the ICA
First/M1 segment of the MCA—African and Asian heritage, diabetes [63]
Origin and distal portion of VA
Midportion of BA
The locations of atherosclerotic lesions are ethnically different. In Europe extracranial atherosclerosis is the most common cause of ischemic stroke, whereas in Americans of African origin, Asians, and Hispanics intracranial atherosclerosis is more important [64, 65]. Recent publications suggest a larger role for intracranial atherosclerosis in symptomatic patients [66, 67].
Small vessel disease accounts for 15–30 % of ischemic stroke. Lacunar infarcts (<15 mm) are due to small artery occlusions of penetrating arteries. These can be embolic, atheromatous, or thrombotic. Lacunar infarcts are found in the basal ganglia, thalami, internal capsule, pons, and deep white matter. Most lacunar infarcts are silent/asymptomatic, although strategically placed infarctions can cause neurological deficit.
Cardioembolic disease accounts for 15–25 % of stroke. The most important cardiac abnormalities which can lead to stroke are atrial fibrillation, myocardial infarction, valvular heart disease, and a patent oval foramen.
In about 25 % the cause of stroke is due to other causes or remains unknown.
The literature is based mainly on extracranial atherosclerotic disease, located at the carotid bifurcation; less literature focuses on intracranial atherosclerotic disease. In proximal/extracranial atherosclerosis the vulnerable plaque with hemorrhage, ulceration, and calcification of plaques is frequently found, whereas in intracranial luminal stenosis of the middle cerebral artery the percentage of lipid area and the presence of intraplaque neovascularity probably plays a key role leading to ischemic stroke [68]. In a Chinese population the presence of intracranial calcifications was an independent risk factor of ischemic stroke [69].
The mechanisms of stroke in intracranial atherosclerosis can be divided into local thrombotic occlusion, artery-to-artery embolism, branch occlusive disease of the orifice of deep perforating arteries, hemodynamic (hypoperfusion), or a combination of these [70]. This can explain the different patterns of infarcts.
In situ thrombotic occlusion leads to the largest infarctions. Intracranial atherosclerosis usually is a slowly developing process, so collateral circulation can develop in chronic atherosclerotic disease. The size of the infarction is dependent on the presence of collateral circulation, the speed of the occlusion, and hemodynamics. Whole territory infarcts are therefore less frequent.
In artery-to-artery embolism emboli from the more proximal occlusion can be entrained with the bloodstream to distal branches and result in an occlusion with large strokes. Examples are thrombi from carotid bifurcation plaques and cardiac emboli (Fig. 12). The latter account for larger strokes due to larger emboli and less collateral circulation. Intracranial MCA stenosis can give artery-to-artery emboli to distal M2 segments.
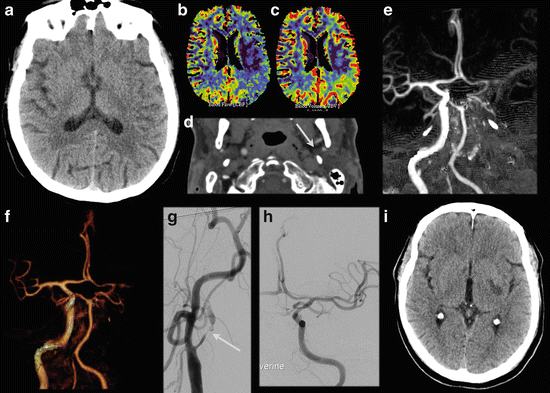

Fig. 12
A 62 y/o male patient presented with a right-sided hemiparesis. NECT shows a slight hypodensity and faint loss of gray-white matter differentiation at the posterior border of the left lentiform nucleus (a) and i.v. rTPA was given with initially good clinical recovery. However, the hemiparesis recurred and at that time a VPCT (b: CBF, c: CBV) and CTA were performed. The VPCT shows CBF/CBV perfusion mismatch with increased MTT (not shown). Coronal MIP (e) and VR (f) of the CTA show occlusion of the left internal carotid artery (d, source image) from the bifurcation with an occlusion of the left MCA. The patient went on for DSA and intra-arterial recanalization of the left carotid bifurcation stenosis (g) and subsequent thrombectomy of the left MCA thrombus. A good recanalization was obtained (h). Follow-up CT 1 day later shows a lacunar infarction in the left lentiform nucleus (i), but no other signs of ischemia in the left MCA territory. Initially there was some residual motor deficit, but at discharge there was no neurological deficit
Occlusions of the origin of a perforating artery can be due to an intracranial atherosclerotic plaque. The pathophysiology of these occlusions differs from the small vessel disease, but can lead to the same small infarctions (Fig. 12).
Imaging in acute stroke can be divided into differentiating hemorrhagic stroke and ischemic stroke, imaging of vessel occlusion (Figs. 12, 13, 15, and 17), and determining the core and penumbra of the infarction (Figs. 14 and 16).
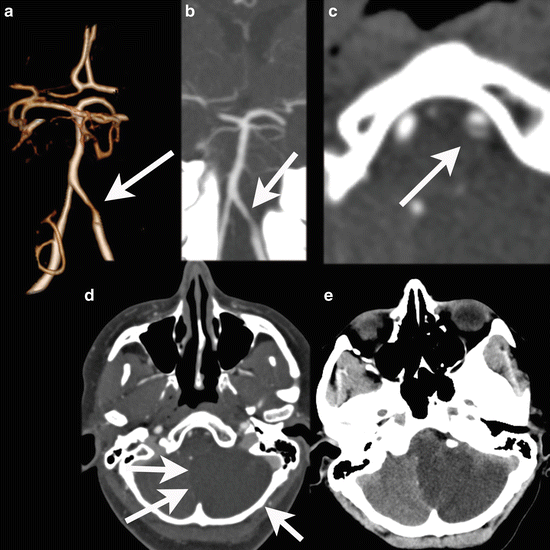
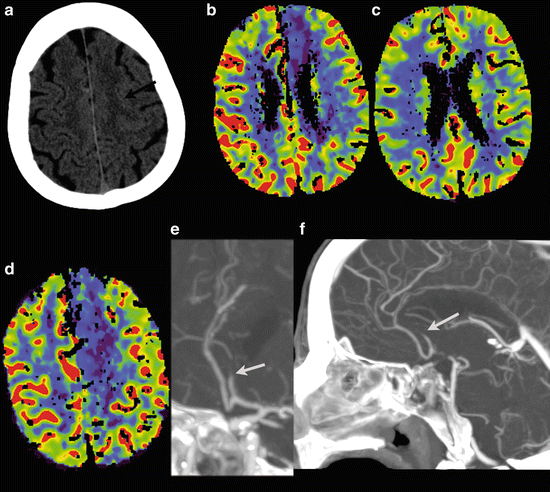
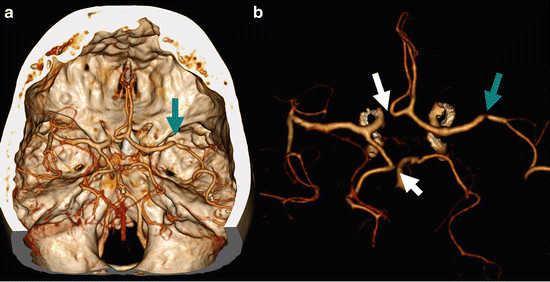
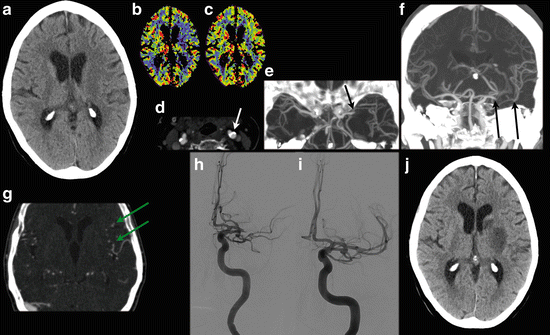
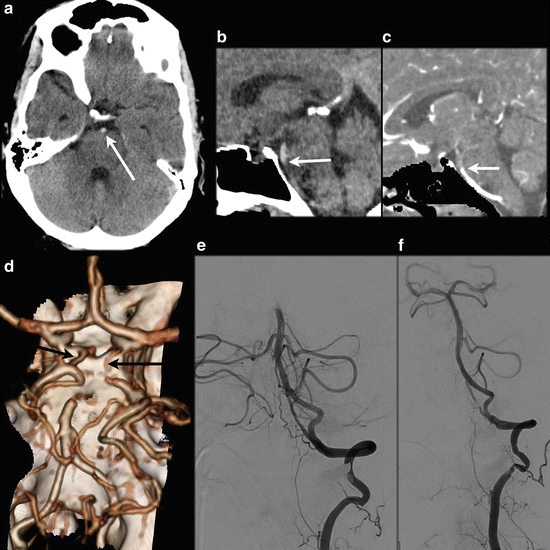

Fig. 13
Vertebral artery dissection with PICA infarction. A 49 y/o female presented with dizziness, neck pain, nystagmus, and ataxia of the left arm. Initial NECT was normal. CTA demonstrates a tapering of the distal segment of the left vertebral artery, with a double-lumen sign on the CTA source images. A large infarction of the PICA territory in the left cerebellar hemisphere with mass effect was noted 2 days after the onset of symptoms. DE-CTA was performed at day 2. Bone-removed VR shows tapering of the distal segment of the left vertebral artery (a), also visible on the MIP reconstructions (b). Detailed images of the vertebral artery (c) Images at at 80 kVp demonstrates clearly the true and false lumen of the dissected left vertebral artery. At 120 kVp images this is also seen to a lesser extent, the mass effect of the cerebellar infarction is already noted at the CTA (d), but better seen at NECT at follow-up at day 3 (e)

Fig. 14
Seventy-two y/o female. Presented with speech disturbances and left-sided motor deficit. NECT shows subtle effacement of the sulci of the left hemisphere (a, black arrow). VPCT shows CBF/CBV mismatch (b and c), with reduced flow in the territory of the left anterior cerebral artery (d). CTA shows occlusion of the left A2 segment, white arrow (e: oblique MIP, f: lateral MIP), without abnormalities of the other intra- and extracranial vessels. She received i.v. rTPA. Clinical follow-up demonstrated recovery of the paresis with MRC grade 4 of right arm and leg

Fig. 15
A 84 y/o female presented with right-sided hemiparesis and aphasia due to a left MCA territory stroke. CTA demonstrated a left MCA stenosis (blue arrow). As normal variant, hypoplasia of the right A1 segment is present, as well as hypoplasia of the P1 segment (white arrows). Volume rendering (VR) (a) and VR after bone removal (b) from DECTA are shown

Fig. 16
A 72 y/o female presented with sudden right-sided paresis of the arm and leg. A facial asymmetry was noted and dysarthria was present. NECT scan shows diminished differentiation of the gray and white matter at the upper part of the left lentiform nucleus (a). CT perfusion images show a CBF/CBV mismatch (b and c), with a suspected core at the left lentiform nucleus and penumbra at the left frontal cortex. CTA demonstrates calcifications at the carotid bifurcation (d) and a left middle cerebral artery occlusion (e, transverse MIP reconstruction; f coronal MIP reconstruction). The length of the thrombus can be appreciated on the coronal MIP (f, between the black arrows) and collateral filling is present (g, green arrow). The patient went on for intra-arterial thrombectomy. (h) DSA before successful recanalization of the left MCA (i). Follow-up NECT at 1 day shows infarction in the left lentiform nucleus (j). At discharge only mild aphasia and no motor or sensory symptoms were present

Fig. 17
A 46 y/o male presented with left-sided hemiparesis and dysarthria after ablation procedure for atrial flutter. NECT shows normal density and normal gray-white matter differentiation. A dense artery sign is present in the distal basilar artery (a, white arrow), suggestive of basilar artery occlusion. Subsequent CTA conforms an occlusion of the distal basilar artery (b: sagittal NECT, c: CTA sagittal MPR), matched images. 3D VR (d) shows the occluded distal basilar artery; there is collateral blood flow to the P2 segments via de bilateral Pcoms (black arrows). DSA confirms the occlusion (e) and intra-arterial thrombectomy was performed with successful recanalization (f). After 3 months only mild balance disturbances were present
In the acute setting a non-contrast-enhanced CT (NECT) of the brain can reveal hemorrhage. The ASPECTS score [71, 72] can be used to try to determine the extent of the infarction in the initial phase. Early signs of ischemic stroke are effacement of sulci, hypodensity of the brain parenchyma, loss of gray-white matter differentiation, and in the insular region called the “insular ribbon sign” and a hyperdense vessel sign [73] (Fig. 18).
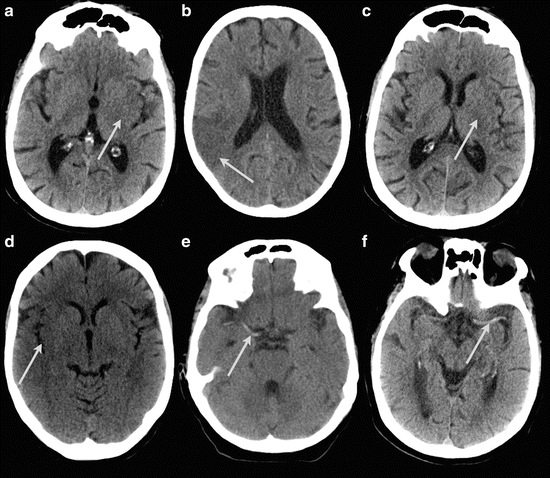

Fig. 18
Signs of infarctions on NECT. (a) A partial insular ribbon sign and diminished differentiation of the left lentiform nucleus. (b) Hypodensity of the parenchyma, loss of gray-white matter differentiation, and effacement of sulci of the right parietal lobe. (c) Disappearance of left lentiform nucleus. (d) Right insular ribbon sign. (e and f) Dense artery sign of the MCA right (e) and left (f)
Defining irreversibly damaged parts of the brain can be done by MRI with diffusion-weighted imaging (DWI) or with CT perfusion (Fig. 14). Vascular imaging can be performed with CTA [74], MRA [75], or DSA; the latter is the gold standard, but is preferably used in selected cases [74]. CTA can also be calculated from the VPCT dataset, thereby lowering the radiation dose [50, 76]. In case of an inconclusive CTA or MRA an adjunct MRA or CTA can lower the need for DSA [77].
The accuracy of CTA for evaluation of intracranial atherosclerotic disease is good, especially in stenosis larger than 50 % [74, 78], and is increasing with newer and more sophisticated scanners [79]. CTA can show the site and severity of the stenosis, the length of the thrombus, and the presence of collateral circulation [80] (Fig. 15). Time-resolved CTA or 4D-CTA (Fig. 19) can give additional information about the leptomeningeal collateral filling [45, 47] or the clot burden [54] (Fig. 16).


Fig. 19
Fifty-four y/o female, presenting with right-sided motor and sensory deficit and aphasia for which she received i.v. rTPA. NECT, VPCT, and CTA were without abnormalities. Shown are the VR images from the 4D-CTA with bone suppression (blue) derived from the dynamic phases of the VPCT. Normal arterial and venous phases are demonstrated by this 4D-CTA
Stay updated, free articles. Join our Telegram channel

Full access? Get Clinical Tree


