Primary or nontraumatic spontaneous intracerebral hemorrhage (ICH) comprises approximately 15% to 20% of all stroke. ICH has a mortality of approximately 40% within the first month, and 75% mortality and morbidity rate within the first year. Despite reduction in overall stroke incidence, hemorrhagic stroke incidence has remained steady since 1980. Neuroimaging is critical in detection of ICH, determining the underlying cause, identification of patients at risk of hematoma expansion, and directing the treatment strategy. This article discusses the neuroimaging methods of ICH, imaging markers for clinical outcome prediction, and future research directions with attention to the latest evidence-based guidelines.
Key points
- •
Intracerebral hemorrhage (ICH) is a devastating condition with a combined morbidity and mortality of up to 75%.
- •
The aim of ICH neuroimaging is not only to confirm the diagnosis but also to establish the cause of bleeding and potentially predict the likelihood of hematoma expansion.
- •
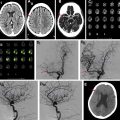
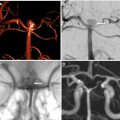
Although noncontrast computed tomography (CT) scans comprise the first line of diagnosis, further investigation with CT angiography, magnetic resonance (MR)/MR angiography, digital subtraction angiography, or advanced imaging are required to identify the potential underlying cause.
- •
The imaging algorithm should be tailored based on the suspected underlying disease.
Introduction
Epidemiology
Intracerebral hemorrhage (ICH) is defined as extravasation of blood in the cerebral parenchyma, and it comprises up to 15% of all strokes. ICH is a devastating condition with a reported mortality approaching 40% within the first month with combined morbidity and mortality of up to 75% within 1 year of initial brain injury. Despite reduction in overall stroke incidence, hemorrhagic stroke incidence has remained steady since 1980. However, a slight declining trend of ICH in-hospital mortality has been reported from 2006 (23.9%) to 2014 (20.4%).
Spontaneous Intracerebral Hemorrhage
ICH can be traumatic (t-ICH) or spontaneous (s-ICH); s-ICH is a significant cause of morbidity and mortality worldwide. The annual incidence of s-ICH is about 10 to 30 per 100,000 population. Global burden of primary s-ICH has been increasing because of increased prevalence of hypertension (HTN), particularly in African Americans, caused by the higher rate of HTN in this population.
Role of Imaging
When patients present with abrupt focal neurologic symptoms, diagnosis of stroke is presumed until proved otherwise; however, it is difficult to determine whether a patient has an ischemic or hemorrhagic stroke by the neurologic examination alone; hence, neuroimaging is critical in ruling out hemorrhagic stroke. In essence, neuroimaging studies are aimed at early detection of ICH, determining the underlying cause, identification of patients at risk of hematoma expansion, and directing the treatment strategy. The imaging markers of ICH outcomes can be divided into fixed (hematoma volume and location) and modifiable (hematoma expansion and perihematomal edema). No therapy has proved to be effective in treatment of ICH ; however, the modifiable factors (specifically hematoma expansion) have been the focus of surgical interventions. Imaging markers play a crucial role in detection and tracking the evolution of these modifiable determinants. In addition, the first few hours after ICH are critical because rapid neurologic deterioration is common with hematoma expansion; hence, imaging is also crucial in guiding early management.
Intracerebral Hemorrhage Classification
s-ICH can be further divided into primary (80%) and secondary (20%). Hypertensive ICH and cerebral amyloid angiopathy (CAA)–related ICH are the major primary causes of s-ICH. Secondary s-ICH usually has vascular causes such as arteriovenous malformations (AVMs), arteriovenous fistulas (AVFs), cerebral aneurysms, and cavernous malformations. Anticoagulant drug use is also a common and steadily increasing cause of s-ICH in the United States. The prognosis of s-ICH largely depends on the underlying cause. A useful classification system called SMASH-U ( Fig. 1 ) has been developed based on cause. SMASH-U stands for structural vascular lesions (S), medication (M), amyloid angiopathy (A), systemic disease (S)–like thrombocytopenia and cirrhosis, HTN (H), or undetermined (U).

Goals
This review article provides a comprehensive update on imaging modalities used for diagnosis and prognosis of s-ICH. Class and level of evidence established by the 2015 American Stoke Association (ASA) and American Heart Association (AHA) guidelines for the management of s-ICH for use with individual neuroimaging modalities are also discussed for each imaging modality. This AHA/ASA guideline is endorsed by the American Association of Neurological Surgeons, the Congress of Neurological Surgeons, and the Neurocritical Care Society. t-ICH as well as subdural and epidural hemorrhage are not discussed. The terms ICH and s-ICH are used interchangeably.
Pathophysiology
Primary Brain Injury
The initial hemorrhage into the brain parenchyma causes disruption in cerebral cellular architecture. The added volume of hemorrhage also causes mass effect, which increases intracranial pressure (ICP). The increased ICP compresses the nearby vessels, causing cerebral ischemia. In addition, the ruptured vessels also lose their blood flow themselves because of extravasation, further worsening the ischemic damage.
Secondary Brain Injury
Hematoma expansion (HE) usually occurs within the first 6 hours of ICH and is one of the strongest predictor of poor outcome in patients with ICH. HE is defined as hemorrhage volume increase of greater than or equal to 12.5 cm 3 or size increase by greater than or equal to 1.4 times. About 20% of patients with ICH have HE within the first day of the hemorrhagic event. , The so-called avalanche model of HE suggests that the initial hemorrhage creates a shearing force on nearby cerebral vessels, causing vessel injury and further hemorrhage. As the initial clot dissolves, the breakdown products (mainly hemoglobin and iron) cause further damage by worsening the inflammation that was initially caused by the hematoma itself, resulting in what is termed secondary brain injury. Thrombin involved in the hemostatic mechanism also causes inflammation. Infusion of thrombin into cerebral parenchyma has been shown to cause increased inflammation and proliferation of mesenchymal cells. This cascade of events causes scarring and edema in the cerebral parenchyma.
Perihematomal edema (PHE) is another neuroimaging marker of the secondary brain injury. The combination of mass effect from the primary injury, end products of the coagulation cascade, and the thrombin initiates a secondary insult on the cerebral parenchyma surrounding the initial hemorrhage site, resulting in PHE. PHE is an important marker of secondary brain injury; however, it has been shown to be an independent predicator of neurologic outcome only when the hemorrhage volume is less than 30 mL. , , Recent methods of CT-based PHE measurement using edge detection have been shown to have good correlation with MR imaging measurements of PHE with high inter-rater and intrarater reliability.
Causes of Spontaneous Intracerebral Hemorrhage
HTN, and CAA are the 2 main causes of s-ICH. Chronic HTN results in high pressure in the thin-walled vessels branching off the main cerebral vessels resulting in fibrinoid necrosis and eventual rupture. In CAA, the beta-amyloid accumulation causes dysregulation in the smooth muscles of the cerebral vessels and ultimately disrupts vascular autoregulation. Indeed, the underlying mechanism for both hypertensive and CAA-related ICH is attributed to the loss of autoregulation of cerebral vessels.
Neuroimaging techniques
Noncontrast Computed Tomography Scan
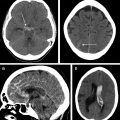
Rapid imaging with either CT or magnetic resonance (MR) to differentiate between ischemic and hemorrhagic stroke is a class I/level A recommendation per the AHA/ASA guidelines for imaging of s-ICH. Noncontrast CT (NCCT) is usually the study of choice in emergency departments for initial work-up of stroke because of its faster scanning time, easy availability, and its high sensitivity to detect ICH. In addition, it can also measure volume, mass effect, and cerebral edema in patients with ICH. NCCT can also determine whether a hemorrhage is acute, subacute, or chronic based on the specific Hounsfield unit (HU) attenuation of the hematoma.
NCCT is generally considered a gold standard in measuring the hematoma volume. Calculation of the hematoma volume can be easily performed with the ABC/2 method. Some studies have reported that ABC/2 volume estimation can be imprecise, especially when the ICH is irregular in its shape. However, it remains a valuable tool given that these measurements can be readily made on a variety of image viewer software.
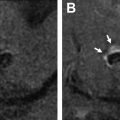
There have been increasing attempts to identify descriptive markers of ICH on NCCT that can predict HE, including blend sign ( Fig. 2 ), hypodensities ( Fig. 3 ), swirl sign ( Fig. 4 ), black hole sign ( Fig. 5 ), islands sign ( Fig. 6 ), satellite sign ( Fig. 7 ), and fluid level ( Fig. 8 ). The pooled evidence suggests that these signs might be a reliable predictor of HE, although with varying predictive accuracy. The Hematoma Expansion Prediction (HEP) score, BRAIN scale, and BAT score are some of the scoring systems that have been proposed for prediction of HE by combining various clinical and imaging markers. The HEP score is graded from 0 to 18; and is based on 6 parameters: time from onset to baseline CT scan, presence of subarachnoid hemorrhage (SAH) on baseline CT, Glasgow Coma Scale (GCS) score on admission, history of dementia, antiplatelet use, and smoking history. Similarly, the BRAIN score ranges from 0 to 24, with its components being baseline ICH volume, recurrent ICH, anticoagulation with warfarin at onset, intraventricular extension, and number of hours to baseline CT from symptom onset. The BAT score is a 5-point prediction score that combines blend and hypodensity signs with a time from onset to CT scan. The BAT score relies on baseline NCCT and can be obtained quickly with just 3 parameters, making it much more practical than the HEP and BRAIN scoring systems for HE prediction.


Related posts:
 Management of Unruptured Intracranial Aneurysms
 Subarachnoid Hemorrhage of Unknown Cause
 High-Resolution Magnetic Resonance Vessel Wall Imaging for the Evaluation of Intracranial Vascular Pathology
 Computed Tomography–Based Imaging Algorithms for Patient Selection in Acute Ischemic Stroke
 Imaging for Treated Aneurysms (Including Clipping, Coiling, Stents, Flow Diverters)
 Acute Ischemic Stroke
Stay updated, free articles. Join our Telegram channel

Full access? Get Clinical Tree


