■
Anatomy and Normal Appearance on Imaging
The pericardium is a fibrous sac that surrounds the heart and is composed of two distinct layers: the visceral pericardium and parietal pericardium. The visceral pericardium is the inner serous layer that consists of a very thin (<1 mm) layer of mesothelial cells. The visceral pericardium lines the epicardial surface of the heart and is separated from the cardiac surface by a layer of epicardial fat, which can vary dramatically in thickness. The parietal pericardium is itself composed of two layers: an outer fibrous layer and an inner serous layer. Similar to the visceral pericardium, the inner serous layer of the parietal pericardium is composed of a thin layer of mesothelial cells. The serosal pericardium is a closed sac composed of the serous layer of the parietal pericardium externally and the serous layer of the visceral pericardium internally and is itself within the fibrous pericardium. These two serous layers are continuous with each other at or near sites of attachments of the great vessels to the heart. The potential space where visceral and parietal serous layers are not attached is the pericardial cavity. The mesothelial cells of both serous layers secrete a small amount of fluid into the pericardial space to lubricate the cavity; therefore the space normally contains 15 to 35 mL of pericardial fluid. The fibrous layer of the parietal pericardium is attached to the mesothelial layer of the parietal pericardium and is composed of various layers of collagen and elastic fibers. Peripheral to those layers lies the pericardial connective tissue layer that contains large bundles of collagen, which form parts of the pericardial ligaments that anchor the pericardium to the manubrium, xiphoid process, and central tendon of the diaphragm loosely. Superiorly, the fibrous layer continues over the aortic arch, where it blends with the deep cervical fascia.
In normal individuals, the pericardium cannot be visualized by chest radiography. In certain disease processes, which will be discussed later, abnormalities of the pericardium can be visualized by radiography, although the evaluation is limited compared to cross-sectional imaging.
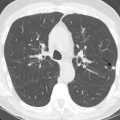
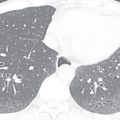
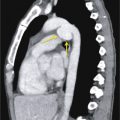
On CT, the pericardial sac is a thin curvilinear band of soft tissue that surrounds the heart and can be seen extending from the great vessels superiorly to the diaphragmatic surface inferiorly. It is best visualized anterior to the anterior wall of the right ventricle, where it is outlined by epicardial and mediastinal fat ( Figs. 38.1 and 38.2 ). Although there may be certain areas where it is poorly visualized, such as overlying the lateral surface of the left ventricle, it is present, except in rare circumstances. It is often not possible to delineate the individual serous layers of the pericardium on cross-sectional imaging unless separated by fluid or thickened. The pericardium is often thin, measuring only 1 to 2 mm in thickness, although a thickness less than 4 mm is considered normal. Because fluid is often found in the pericardial sac, it is important not to confuse an effusion with pericardial thickening, although the delineation between the two may be difficult. Fluid in numerous pericardial sinuses and recesses, as discussed below, is common and should not be mistaken for pathology.


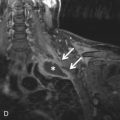
On MRI, the parietal pericardium will appear as a low-signal dark line surrounding the heart on T1- and T2-weighted dark blood imaging ( Fig. 38.3 ). The pericardium is outlined by the high signal of surrounding epicardial and mediastinal fat. On steady-state free precession (SSFP) imaging, which is a mainstay in cine cardiac MRI, the pericardium still appears low in signal, although the intensity may not be as dark as that seen on T1- or T2-weighted imaging. However, it will still be outlined by adjacent fat on this sequence. The thickness of the pericardium may be overestimated on MRI due to a chemical shift artifact. Additional sequences can be used to visualize the pericardium, especially when certain diseases are suspected. Spatial modulation of magnetization (tagging), free-breathing nongated cine, T1-weighted postcontrast sequences, and delayed enhancement sequences can all be used to assess for various pathologic processes and will be discussed below.


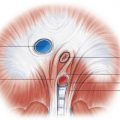
The portion of the visceral pericardium that covers the vessels is arranged in the form of two short tubes. One encloses the proximal portions of the ascending aorta and pulmonary trunk and is termed the arterial mesocardium . The other encloses the superior vena cava (SVC) and inferior vena cava (IVC) and the four pulmonary veins and is termed the venous mesocardium . The attachment of the venous mesocardium to the serous layer of the parietal pericardium occurs posterior to the left atrium and between the pulmonary veins in the shape of an inverted U , forming the oblique sinus ( Fig. 38.4 ). The oblique sinus is contiguous with the subcarinal region and forms a posterior pericardial recess.

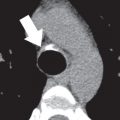
Another serosal tunnel, the transverse sinus, is formed by a tunnel between the arterial mesocardium and venous mesocardia. Thus the transverse sinus lies superior to the left atrium and posterior to the aorta and main pulmonary artery ( Fig. 38.5 ). As it does, it communicates with several recesses, including the superior aortic, inferior aortic, right pulmonic, and left pulmonic recesses. The left and right pulmonary recesses form the lateral extents of the transverse sinus. Each of these sinuses lies inferior to their respective pulmonary arteries (see Fig. 38.5 ). The superior aortic recess is a component of the transverse sinus that extends upward along the ascending aorta and is often visible on CT. The anterior portion of the superior aortic recess lies anterior to the ascending aorta and pulmonary artery and often has a triangular shape, but may be quite variable in appearance and extent ( Fig. 38.6 ; see Fig. 38.5 ). The posterior portion of the superior aortic recess can be seen on CT as a crescent-shaped fluid collection posterior to the ascending aorta, usually at the level of the left pulmonary artery. This recess can be high riding and may extend superiorly into the right paratracheal region. Although this is a normal variant, the high-riding superior aortic recess can be confused for a mediastinal cyst mass, leading to unnecessary intervention ( Fig. 38.7 ). The inferior aortic recess is located between the right lateral aspect of the ascending aorta and the right atrium, with its inferiormost extent at the level of the aortic annulus.


In addition to these, there are three additional recesses of the pericardial cavity proper. These include the postcaval recess, left pulmonary vein recess ( Fig. 38.8 ), and right pulmonary vein recess ( Fig. 38.9 ). The postcaval recess is posterior and right lateral to the SVC. The left and right pulmonary venous recesses are located between the superior and inferior pulmonary veins on each side. As the pulmonary veins extend through the fibrous pericardium to drain into the left atrium, serosal sleeves of pericardium invest the veins. On occasion, the sleeve around the right inferior pulmonary vein can be filled with fluid and can mimic adenopathy or a tumor ( Fig. 38.10 ). Fluid in the sleeve will often be seen on both sides of the vein and does not narrow the vein. The characteristic location and fluid attenuation can help differentiate this from pathology.


Blood to the pericardium is supplied by branches from the thoracic aorta and pericardiophrenic arteries. Venous drainage is through the venae pericardial, which drain to the azygous vein, SVC, or brachycephalic veins. Innervation predominantly occurs through branches of the phrenic nerve, although vagal innervation from the esophageal plexus supplies some of the posterior pericardium. The lymphatic drainage of the pericardium is primarily directed toward the tracheobronchial nodes and, less frequently, toward the prepericardial lymphatic vessels and nodes (lymphatic drainage of the pericardium to the mediastinal lymph nodes).
■
Congenital Anomalies of the Pericardium
Pericardial Cyst
Pericardial cysts are benign congenital lesions lined by mesothelial cells. If a connection to the pericardium is present, they are termed pericardial diverticula. Pericardial cysts are uncommon lesions, occurring in 1 in 100,000 patients. Most occur at the cardiophrenic angles, on the right greater than the left. A minority occur in other parts of the mediastinum, usually related to the pericardium. Most patients are asymptomatic, but up to one-third may present with chest pain, dyspnea, or cough, particularly if the cyst compresses adjacent structures.
Imaging features of pericardial cysts are often characteristic. On chest radiography, the cyst typically manifests as a rounded density that contacts the hemidiaphragm and anterior chest wall ( Fig. 38.11 ). On CT, pericardial cysts typically appear as thin-walled round or ovoid lesions, with internal fluid attenuation. Proteinaceous material or hemorrhage can lead to increased attenuation on CT. If the diagnosis of a cyst cannot be definitively made on CT, MRI can help with the diagnosis. On T2-weighted images, pericardial cysts show homogeneous high signal intensity. On T1-weighted imaging, cysts will usually appear low signal, although an intermediate to high signal within the cyst can occur, depending on the degree of proteinaceous material. However, on both MRI and CT, internal septations should be absent. Additionally, although the wall of the cyst may enhance, no internal enhancement should be seen on CT or MRI. Internal enhancement, heterogeneous signal (MRI) or attenuation (CT), thickened wall, or numerous septations should raise the possibility of a cystic tumor.


Pericardial diverticula often cannot be distinguished from pericardial cysts but can be suspected if there is a direct connection of a cystlike structure to fluid in the pericardial space. Additionally, because of a retained connection with the pericardium, the fluid within a pericardial diverticulum can change over time. Most pericardial cysts and diverticula do not undergo treatment but symptomatic cysts may require aspiration or surgery.
Pericardial Defect
Congenital absence of the pericardial is an uncommon abnormality that is estimated to occur in 1 in 7000 to 13,000 people. The defects can be partial or complete and are much more common on the left. One theory regarding cause postulates that the embryonic left common cardiac vein regresses earlier than normal, leading to a defect. Most pericardial defects are asymptomatic, and the finding is incidental. However, in very rare cases, portions of the left atrium can herniate through a partial defect and become incarcerated. This can lead to infarction of portions of the left atrium, most notably the left atrial appendage, with subsequent syncope and sudden death. Although these defects usually occur in isolation, 30% to 50% of patients will have an associated congenital anomaly. Cardiac anomalies include atrial septal defect, patent ductus arteriosus, and bicuspid aortic valve, or pulmonary abnormalities may be present. It can also be seen in patients with connective tissue disorders and characteristics suggestive of Marfan syndrome.
Absence of the pericardium can be a difficult diagnosis to make on radiography. Leftward rotation of the heart is present in left-sided defects. However, the best clue on x-ray is the sharp delineation of the main pulmonary artery and transverse aorta due to interposition of lung between these two structures ( Fig. 38.12 ).


The appearance of a congenital absence of the pericardium on CT depends on whether the abnormality is partial or complete. In both partial and complete left-sided defects, there is leftward rotation of the heart into the left chest, with interposition of the lung between the aorta and pulmonary artery. If the defect is partial, the heart bulges leftward in the region of the left atrial appendage (see Fig. 38.12 ). The actual defect in partial absence of the pericardium may be difficult to visualize because the pericardium is usually absent over the lateral aspect of the left ventricle and, even under normal circumstances, the pericardium is often difficult to localize in this area. If the left-sided defect is complete, the entire heart is typically displaced to the left, and lung is interposed between the inferior margin of the heart and diaphragm. On functional cine imaging, excessive motion of the cardiac apex has been observed in individuals with complete absence of the pericardium.
■
Acquired Pericardial Diseases
Pericardial Effusion
Pericardial effusions are commonly seen on imaging and represent an abnormal accumulation of fluid in the pericardial space. This collection may be characterized as transudative, exudative, hemorrhagic, or pyogenic ( Fig. 38.13 ). Transudative effusion is a common finding in patients with congestive heart failure or other diseases or disorders that lead to increased right heart filling pressures. There are numerous causes of exudative effusions; these include acute infection, inflammation, malignancy, autoimmune disorders, and pericardial trauma. Exudative effusions are common in cases of pericarditis (see below). Blood products can also fill the pericardial space in cases of trauma or aortic dissection. In the pyopericardium, frank pus fills the pericardial space and carries a high mortality rate. Although most effusions are small in size and asymptomatic, symptomatology varies, depending on the cause of effusion and rapidity of accumulation.


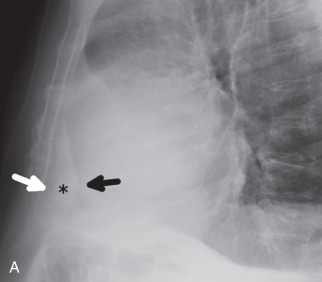
The detection of a pericardial effusion on chest radiography can be difficult, especially if the effusion is small or moderate in size. Large effusions can often be suggested if the heart has an enlarged water bottle morphology on posteroanterior imaging or if there is a rapid increase in the size of the cardiac silhouette over a short period of time ( Fig. 38.14 ). On the lateral radiograph, a fat pad sign (also referred to as the Oreo cookie sign ), comprised of pericardial fluid outlined by lower attenuation mediastinal and epicardial fat, can help make the diagnosis ( Fig. 38.15 ).


If a clinically significant pericardial effusion is suspected, echocardiography is often used as the initial technique but may be limited by poor acoustic windows or the location and characteristics of the pericardial collection. Both CT and MRI are valuable to quantify the pericardial effusion and may, in some cases, provide a degree of tissue characterization. On CT, an increase in density above that of simple fluid may indicate an exudative or hemorrhagic process, although there is overlap (see Fig. 38.13E and F ). As discussed below in greater detail, patients with active pericardial inflammation will often demonstrate pericardial enhancement after the administration of IV contrast (see Fig. 38.13C and F ). The presence of pericardial nodularity should raise concern for a malignant pericardial effusion (see Fig. 38.13D ). In patients with a history of trauma, surgery, or aortic dissection, high-density fluid suggests hemopericardium (see Fig. 38.13 ).
MRI is also valuable to demonstrate the characteristics of pericardial effusion. Most effusions are high in signal on T2-weighted and SSFP sequences, even if the effusion is complex in nature. On T1-weighted sequences, simple transudative effusions typically display low signal intensity, whereas exudative or hemorrhagic effusions are more likely to demonstrate intermediate to high signal intensity. However, pericardial fluid characterization can be difficult, especially in cases of larger effusions, because the nonlinear motion of pericardial fluid during cardiac motion can lead to a falsely elevated high signal on T1-weighted images, even in the presence of a simple transudate ( Fig. 38.16 ).

Related posts:
Stay updated, free articles. Join our Telegram channel

Full access? Get Clinical Tree


