 , the pulse-echo voltage response of the scatterer,
  , as a function of the time, t, is measured and stored. To form up a 2-D image one can set up a 2-D
  grid of image points, such as the point
  shown in Fig. 12.2 and calculate the travel time from the centroid
  of each element to those image points and back,
  , where
  is the one-way travel time between these points. At each image point the stored voltage signals are then each advanced by these two-way travel times and summed. The amplitude of the summed signal at time
  is then taken as the value of the image of the scatterer,
  , at that point, so that
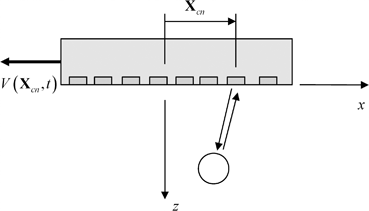
Fig. 12.1
Collection of the pulse-echo responses of a flaw with a linear array
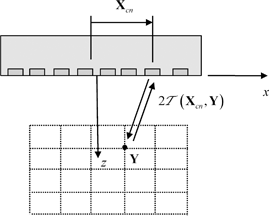
Fig. 12.2
The SAFT image formation process, where the two-way travel time from each element to an image point is calculated

(12.1)
This method can be understood in terms of our discussion of the time delay laws in Chaps. 5 and 8. On sound generation, application of the one-way time advances  would focus the waves from each element at point
  . Application of these same time advances on reception would likewise focus the received signals to appear as if they came from point
  . If a flaw scattering source exists at
  we would expect to see a large value for the summed signals at
  and if a source was not present at this point, we would expect to see a correspondingly small value. Thus, it is reasonable to take the summed value of Eq. (12.1) as a value that describes the image of the flaw(s) present. Note that in this process we have not invoked the physics of the measurement process except for the travel times involved. Thus, the SAFT image is an ad-hoc approach and it is somewhat misleading to call the image formed an image of the flaw since the formed image also depends on the element system functions of the phased array measurement system, the wave propagation behavior to the flaw and back, and the interactions with the flaw, and the SAFT method does not characterize or compensate for any of those parameters. Even so, SAFT has proven to be a powerful imaging method that has been widely used for many years [2–4].
 would focus the waves from each element at point
  . Application of these same time advances on reception would likewise focus the received signals to appear as if they came from point
  . If a flaw scattering source exists at
  we would expect to see a large value for the summed signals at
  and if a source was not present at this point, we would expect to see a correspondingly small value. Thus, it is reasonable to take the summed value of Eq. (12.1) as a value that describes the image of the flaw(s) present. Note that in this process we have not invoked the physics of the measurement process except for the travel times involved. Thus, the SAFT image is an ad-hoc approach and it is somewhat misleading to call the image formed an image of the flaw since the formed image also depends on the element system functions of the phased array measurement system, the wave propagation behavior to the flaw and back, and the interactions with the flaw, and the SAFT method does not characterize or compensate for any of those parameters. Even so, SAFT has proven to be a powerful imaging method that has been widely used for many years [2–4].
A frequency domain version of SAFT can also be developed since if we express the measured voltage signals in terms of their Fourier transforms, Eq. (12.1) becomes
![$$ \begin{array}{c} {\cal I}_{SAFT} ({\bf{Y}}) = \left. {\sum\limits_{n = 1}^N {\frac{1}{{2\pi }}\int\limits_{ - \infty }^{ + \infty } {V({\bf{X}}_{cn} ,\omega )\exp [ - i\omega (t + 2{\cal T}({\bf{X}}_{cn} ,{\bf{Y}}))]d\omega } } } \right|_{t = 0}\\[8pt] = 2{\mathop{\rm Re}\nolimits} \left\{ {\sum\limits_{n = 1}^N {\frac{1}{{2\pi }}\int\limits_0^{ + \infty } {V({\bf{X}}_{cn} ,\omega )\exp [ { - 2i\omega {\cal T}({\bf{X}}_{cn} ,{\bf{Y}}_p )} ]d\omega } } } \right\}, \\[8pt]\end{array} $$](/wp-content/uploads/2016/05/A314073_1_En_12_Chapter_Equ2.gif)
(12.2)
where  indicates “real part of”. If we discretize the frequency integration, we have
 indicates “real part of”. If we discretize the frequency integration, we have
![$$ {\cal I}_{SAFT} ({\bf{Y}}) = 2{\mathop{\rm Re}\nolimits} \left\{ {\frac{{\Delta \omega }}{{2\pi }}\sum\limits_{m = 1}^M {\sum\limits_{n = 1}^N {V( {{\bf{X}}_{cn} ,\omega _m } )\exp [ { - 2i\omega _m {\cal T}({\bf{X}}_{cn} ,{\bf{Y}})} ]} } } \right\}. $$](/wp-content/uploads/2016/05/A314073_1_En_12_Chapter_Equ3.gif)
(12.3)
SAFT imaging can also be used with a 2-D array to generate a 3-D image of a flaw. The image formation process is identical to the 2-D case we just discussed. In this case, an image,  , at an image point,
  , in three dimensions (see Fig. 12.3) for an array with
  elements in the x-direction and
  elements in the y-direction is given by
 , at an image point,
  , in three dimensions (see Fig. 12.3) for an array with
  elements in the x-direction and
  elements in the y-direction is given by
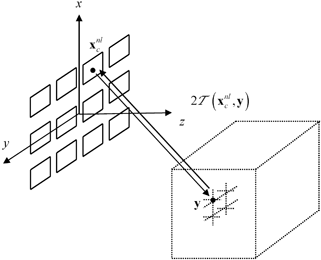
Fig. 12.3
The SAFT image formation process for generating a 3-D image with a 2-D array

(12.4)
or, in the frequency domain,
![$$ {\cal I}_{SAFT} ({\bf{y}}) = 2{\mathop{\rm Re}\nolimits} \left\{ {\frac{{\Delta \omega }}{{2\pi }}\sum\limits_{m = 1}^M {\sum\limits_{n = 1}^{L_1 } {\sum\limits_{l = 1}^{L_2 } {V({\bf{x}}_c^{nl} ,\omega _m )\exp [ { - 2i\omega _m {\cal T}( {{\bf{x}}_c^{nl} ,{\bf{y}}} )} ]} } } } \right\}. $$](/wp-content/uploads/2016/05/A314073_1_En_12_Chapter_Equ5.gif)
(12.5)
12.2 TFM Imaging
The SAFT method uses only the pulse-echo responses of the array so that it does not take advantage of the much larger number of responses for various pairs of elements that can be recorded with an array. The total focusing method (TFM) does utilize all combinations of sending and receiving elements, also called full matrix capture , to form an image [5].
Consider the formation of a TFM image with a linear array (Fig. 12.4) with N elements. In this case we record all the voltage time domain signals  ,
,  ,
,  for a sending element whose centroid is located at
  and a receiving element whose centroid is at
  as shown in Fig. 12.4. In the image formation process we again set up a grid of image points
  as shown in Fig. 12.5, advance all these sending/receiving element pair responses by the travel times
  and then calculate their sum at time
  to form an image,
  , giving
 ,
,  ,
,  for a sending element whose centroid is located at
  and a receiving element whose centroid is at
  as shown in Fig. 12.4. In the image formation process we again set up a grid of image points
  as shown in Fig. 12.5, advance all these sending/receiving element pair responses by the travel times
  and then calculate their sum at time
  to form an image,
  , giving
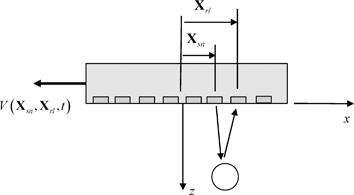
Fig. 12.4
Collection of the responses of all sending/receiving element pairs in an array (full matrix capture)
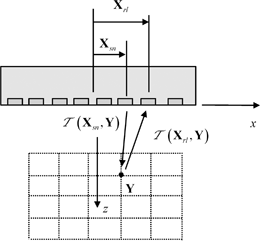
Fig. 12.5
The total focusing method (TFM) image formation process, where the travel times for various pairs of sending/receiving elements to an image point are calculated

(12.6)
Transforming the measured time domain signals to the frequency domain and evaluating at M positive frequencies, as in the SAFT method, we find the alternate frequency domain TFM form:
![$$ {\cal I}_{TFM} ({\bf{Y}}) = 2{\mathop{\rm Re}\nolimits} \left\{ {\frac{{\Delta \omega }}{{2\pi }}\sum\limits_{m = 1}^M {\sum\limits_{n = 1}^N {\sum\limits_{l = 1}^N {V({\bf{X}}_{sn} ,{\bf{X}}_{rl} ,\omega _m )\exp [ { - i\omega _m {\cal T}({\bf{X}}_{sn} ,{\bf{Y}}) - i\omega _m {\cal T}({\bf{X}}_{rl} ,{\bf{Y}})} ]} } } } \right\}. $$](/wp-content/uploads/2016/05/A314073_1_En_12_Chapter_Equ7.gif)
(12.7)
If 3-D TFM imaging is done with a 2-D array having  elements in the x-direction and
  elements in the y-direction then the image formation process is shown in Fig. 12.6 and the image,
  , is
, is
 elements in the x-direction and
  elements in the y-direction then the image formation process is shown in Fig. 12.6 and the image,
  , is
, is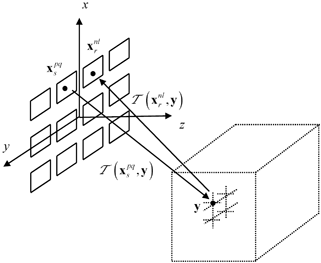
Fig. 12.6
The total focusing method (TFM) imaging process for generating a 3-D image with a 2-D array

(12.8)
and in the frequency domain
![$$ {\cal I}_{TFM} ({\bf{y}}) = 2{\mathop{\rm Re}\nolimits} \left\{ {\frac{{\Delta \omega }}{{2\pi }}\sum\limits_{m = 1}^M {\sum\limits_{n = 1}^{L_1 } {\sum\limits_{l = 1}^{L_2 } {\sum\limits_{p = 1}^{L_1 } {\sum\limits_{q = 1}^{L_2 } {V({\bf{x}}_s^{pq} ,{\bf{x}}_r^{nl} ,\omega _m )\exp [ - i\omega _m {\cal T}({\bf{x}}_s^{pq} ,{\bf{y}}) - i\omega _m {\cal T}({\bf{x}}_r^{nl} ,{\bf{y}})]} } } } } } \right\}. $$](/wp-content/uploads/2016/05/A314073_1_En_12_Chapter_Equ9.gif)
(12.9)
But note that the large number of calculations involved makes these 2-D and 3-D TFM formulations computationally much more expensive than their SAFT counterparts.
12.3 The Image Formation Process
While the images described in the previous sections of this Chapter can provide us with some visual measurements of a flaw response, all of those images are produced in ad-hoc fashion from the measured data and normally there is no significance placed on the values present in the image. In this section we want to describe in general terms some of the characteristics of the waves scattered from flaws and received by arrays so the underlying physics associated with image formation process can be better understood and used as the basis for more quantitative imaging.
When ultrasonic waves from an array (or in fact any type of transducer) interact with flaws, scattered waves of many different types may be present. By “type” we do not mean here just wave mode types such P-waves or S-waves but also different types of interactions of the incident wave with the flaw, as shown in Fig. 12.7. These interactions include waves directly reflected from the flaw surface, waves that travel around the flaw (so-called creeping waves) , waves that may involve one or more internal interactions within the flaw itself (for inclusions), and others. However, the waves directly reflected (and possibly mode-converted) from the flaw surface have a special importance. Figure 12.8 shows a situation where a wave is generated by one element of an array and then is directly reflected by a flaw surface to another array element.
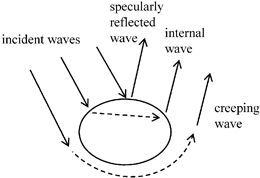
Fig. 12.7
Waves of different types scattered from a flaw, including waves directly reflected from the flaw surface, waves that travel around the flaw surface, and waves that refract into the flaw and then re-emerge
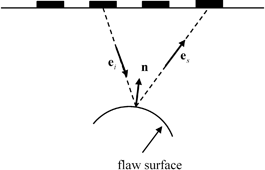
Fig. 12.8
Waves that travel from one element of an array to another via a direct reflection from the flaw surface
The unit vector  describes the incident wave direction and a unit vector
  describes the scattering direction back to another element. The unit normal to the flaw where
  intersects the flaw surface is
  . At high frequencies, there are points on the flaw surface where these directly reflected waves have significant amplitudes and these particular amplitudes are often larger than the amplitudes of any of the other wave types present. These are called specular reflection points and they occur when the vector
  is parallel to the unit normal,
  , where
  is the wave speed of the incident wave and
  is the wave speed of the scattered wave [Schmerr]. The incident and scattered waves at these specular points satisfy Snell’s law since if
 describes the incident wave direction and a unit vector
  describes the scattering direction back to another element. The unit normal to the flaw where
  intersects the flaw surface is
  . At high frequencies, there are points on the flaw surface where these directly reflected waves have significant amplitudes and these particular amplitudes are often larger than the amplitudes of any of the other wave types present. These are called specular reflection points and they occur when the vector
  is parallel to the unit normal,
  , where
  is the wave speed of the incident wave and
  is the wave speed of the scattered wave [Schmerr]. The incident and scattered waves at these specular points satisfy Snell’s law since if
(12.10)
then for any unit vector,  , that is tangent to the surface and lies in the plane of incidence (the plane containing both
  and
and  ), we must have
 , that is tangent to the surface and lies in the plane of incidence (the plane containing both
  and
and  ), we must have
(12.11)
which is just a statement of Snell’s law.
These specular point responses play particularly important roles since, as mentioned in the previous chapter, when all the elements of the array are being used as transmitters and receivers the largest signals received by the array often come from a collection of these specular points on the flaw surface. Likewise, when an image is formed from the ultrasonic array data it is often predominantly an image of this collection of specular points. Of course, there may be specular points on the surface where the scattered direction for one or more elements that are transmitting lies outside the boundary of the array as shown in Fig. 12.9. In this case we expect the amplitude of the response seen in the image will be reduced and in the extreme case where no specular points exists for any combination of transmitting or receiving elements of the array, the contributions of these points to an image will be absent. This does not mean that in this case there will be no image generated at all because of the presence of responses from wave types other than these directly reflected waves. Figure 12.10 shows an example of this situation where a flat crack is oriented so that all the possible specular points on the crack will involve directly reflected waves that are not received by the array. However, cracks also generate waves that arise from the crack edges. Although these waves are typically smaller in amplitude than the directly reflected waves they can travel in many directions so that they can be received by the elements of the array (see Fig. 12.11) even when the specular point responses are absent. When processed, these edge waves can form up an image of the crack edge.
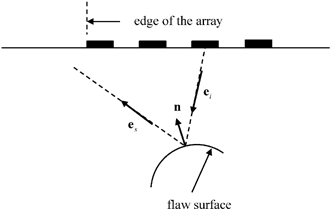
Fig. 12.9
The case where the scattered response from a specular point on the flaw surface returns to a point beyond the edge of the array and thus is not received
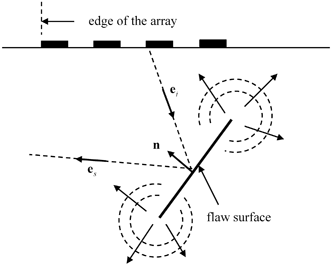
Fig. 12.10
A crack being interrogated by an array where the specular point responses are absent. However, waves also are generated by diffraction from the crack edges, as shown, which can be used to form an image of the crack edge
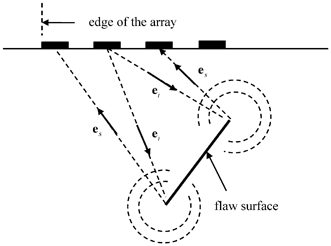
Fig. 12.11
The same configuration of Fig. 12.10 showing the generation and reception of the edge waves from the crack
Both specularly reflected waves and edge waves play an important role in the development of the imaging measurement model (IMM) we will discuss in the next section and the more general models considered in Chap. 13. These imaging measurement models are based on the Kirchhoff approximation which can predict both specularly reflected and edge wave contributions to an image. We have discussed the Kirchhoff approximation in Chap. 11, where we showed that with this approximation we could extract explicitly the far field scattering amplitude specular response of a small flaw and develop measurement models for the specular responses of more general flaws. In Chap. 11 we saw that the Kirchhoff approximation is based on a single scattering approximation. By this we mean that the Kirchhoff approximation assumes that only waves that are directly reflected (scattered) from the flaw surface are considered. It is this single scattering nature of the Kirchhoff approximation that permits one to directly image explicit flaw properties from the measured flaw response and we will see that this single scattering approximation includes both the specular point responses and the responses of corners or edges of the flaws present. If other wave types are present they can also contribute to the images generated with an IMM , but in the form of image reconstruction artifacts or “noise”. Other wave types, such as the creeping waves of Fig. 12.7, for example, are not directly scattered from the flaw surface or edge so that they will appear in a flaw image as originating from some other location which may not coincide with any part of the real flaw geometry.
Considering the specular reflections and edge waves as the main contributors to the formation of ultrasonic images is only one view of how images are produced. In the geophysics community, for example, another viewpoint is to treat the image formation process as one where the scattering potential of the flaw is the fundamental quantity that is imaged instead [6]. In this view, one often uses the Born approximation instead of the Kirchhoff approximation to model how flaw responses and images are formed. Although the Born approximation is a low frequency, weak-scattering approximation that assumes that the flaw and the surrounding host material have nearly the same material properties, like the Kirchhoff approximation the Born approximation is a single scattering approximation where only direct interactions of the incident waves with the flaw surface are considered.Thus, it is not surprising that one can relate the scattering potential to the specular reflectivity of the flaw surface present in the Kirchhoff approximation [6] and thus connect the two viewpoints. However, the Born approximation viewpoint is somewhat misleading as it implies that for volumetric flaws in a band-limited and aperture-limited real measurement one is viewing a proper (but “fuzzy”) image of the entire flaw (or, to be more precise, a proper but “fuzzy” image of both the front and back surface of the flaw). We will see in Sect. 12.5, that this is not true except in the weak scattering limit. Like the Kirchhoff approximation, the Born approximation leads to a linear relationship between the specular reflectivity (or scattering potential) and the measured flaw response. To account for other types of flaw responses properly, (such as multiple internal reflections within a flaw, for example) one must resort to more complex (and likely non-linear) image formation methods. In this book we will only consider linear image formation methods as these linear methods form the basis of some of the most successful ultrasonic imaging algorithms in general use and are directly and simply related to the physics of the wave propagation and scattering present in an ultrasonic measurement system.
12.4 Far Field Imaging Measurement Models (2-D)
In Chap. 13 we will use the general measurement models developed in Chap. 11 to describe explicitly the formation of images of the surface reflectivity of flaws and of other surfaces present (such as the back surface of a part, for example) in an ultrasonic measurement. However, we can gain significant insight into these imaging methods by first considering the special cases considered in Chap. 11 where the flaw is small enough so that the incident wave fields do not vary significantly over the flaw surface. In this section we will examine this small flaw case for 2-D waves in a fluid (see Fig. 12.12) since this is a simple case but one that illustrates most of the central points in image formation in more complex problems. This approach to imaging follows the same approach we used in earlier Chapters where we first discussed sound beams, delay laws, etc. for 2-D fluid problems before considering the more complex 3-D cases.
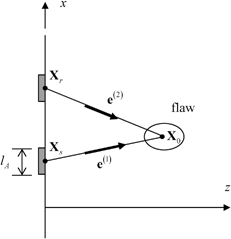
Fig. 12.12
A 1-D array radiating and receiving waves from a 2-D flaw in a fluid
We will assume that an element whose centroid is located on the x-axis at  (Fig. 12.12) receives a scattered wave signal from a small flaw which is excited by an element whose centroid is also located on the x-axis at
  . From Eqs. (11.102) and (11.104) the voltage received from the specular responses of the flaw surface for this pair of elements can be written as
 (Fig. 12.12) receives a scattered wave signal from a small flaw which is excited by an element whose centroid is also located on the x-axis at
  . From Eqs. (11.102) and (11.104) the voltage received from the specular responses of the flaw surface for this pair of elements can be written as
![$$ V( {{\bf{X}}_s ,{\bf{X}}_r ,\omega } ) = s_I (\omega )\hat P^{(1)} ( {{\bf{X}}_s ,{\bf{X}}_0 ,\omega } )\hat P^{(2)} ( {{\bf{X}}_r ,{\bf{X}}_0 ,\omega } ) \cdot \frac{{2\rho c}}{{l_A \rho _2 c_2 }}\int\limits_{C_{lit} } {R_{23} ({\bf{e}}_r\cdot {\bf{n}})\exp [ {ik_2 ( {{\bf{e}}^{(1)}+ {\bf{e}}^{(2)} } ) \cdot ( {{\bf{X}} - {\bf{X}}_0 } )} ]} ds({\bf{X}}). $$](/wp-content/uploads/2016/05/A314073_1_En_12_Chapter_Equ12.gif)
(12.12)
We will first specialize this equation to where we receive only pulse-echo responses in a single medium. Then  ,
,  ,
,  , and
, and  ,
,  , and we find
 ,
,  ,
,  , and
, and  ,
,  , and we find
![$$ V({\bf{X}}_c ,\omega ) = s_I (\omega )[ {\hat P({\bf{X}}_c ,{\bf{X}}_0 ,\omega )} ]^2 \frac{2}{{l_A }}\int\limits_{C_{lit} } {R_{23} \exp [ {2ik_2 {\bf{e}} \cdot {\bf{X'}}} ]} ds({\bf{X'}}), $$](/wp-content/uploads/2016/05/A314073_1_En_12_Chapter_Equ13.gif)
(12.13)
where  is a 2-D position vector,
  measured from a fixed point,
  , (usually taken as the “center” of the flaw). Here the pressure term,
  , is just the normalized pressure of the incident wave generated at point
  by an element whose centroid is located at point
  , i.e. (see Eq. (11.88))
 is a 2-D position vector,
  measured from a fixed point,
  , (usually taken as the “center” of the flaw). Here the pressure term,
  , is just the normalized pressure of the incident wave generated at point
  by an element whose centroid is located at point
  , i.e. (see Eq. (11.88))
![$$ \hat P( {{\bf{X}}_c ,{\bf{X}}_0 ,\omega } ) = \frac{{P( {{\bf{X}}_c ,{\bf{X}}_0 ,\omega } )}}{{\rho _1 c_1 v_T^{(1)} }}\exp [ {i\omega {\cal T}({\bf{X}}_c ,{\bf{X}}_0 )} ]. $$](/wp-content/uploads/2016/05/A314073_1_En_12_Chapter_Equ14.gif)
(12.14)
Now, let the centroid of the element be allowed to vary continuously over all locations, , along the line z = 0, and let C be that part of the flaw surface from which all the specular responses can be received from elements along this line. Then we have
 , along the line z = 0, and let C be that part of the flaw surface from which all the specular responses can be received from elements along this line. Then we have
![$$ V({\bf{X}}_c ,\omega ) = s_I (\omega )[ {\hat P( {{\bf{X}}_c ,{\bf{X}}_0 ,\omega } )} ]^2 \frac{2}{{l_A }}\int\limits_C {R_{23} \exp [i{\bf{k}} \cdot {\bf{X'}}]} ds({\bf{X'}}), $$](/wp-content/uploads/2016/05/A314073_1_En_12_Chapter_Equ15.gif)
(12.15)
where  . To put Eq. (12.15) in a more explicit form, we can define a singular function of the lit surface,
  , which has the property that [7]
 . To put Eq. (12.15) in a more explicit form, we can define a singular function of the lit surface,
  , which has the property that [7]
(12.16)
Using this singular function, Eq. (12.15) can be expressed as a 2-D Fourier transform of the function  , which we will define as the reflectivity of the flaw surface in this pulse-echo response case. Denoting the Fourier transform of this function by
  , we find
 , which we will define as the reflectivity of the flaw surface in this pulse-echo response case. Denoting the Fourier transform of this function by
  , we find
![$$ V({\bf{X}}_c ,\omega ) = s_I (\omega )[ {\hat P( {{\bf{X}}_c ,{\bf{X}}_0 ,\omega } )} ]^2 \frac{2}{{l_A }}\bar {\cal R}({\bf{k}}), $$](/wp-content/uploads/2016/05/A314073_1_En_12_Chapter_Equ17.gif)
(12.17)
where
![$$ \bar {\cal R}({\bf{k}}) = \int {R_{23} \gamma _C ({\bf{X'}})} \exp [ {i{\bf{k}} \cdot {\bf{X'}}} ]dA({\bf{X'}}). $$](/wp-content/uploads/2016/05/A314073_1_En_12_Chapter_Equ18.gif)
(12.18)
Since Eq. (12.18) shows that the measured voltage data is just proportional to the 2-D Fourier transform of the reflectivity, we can in principle obtain an image of that reflectivity,  , by simply performing an inverse Fourier transform of that data in the form
 , by simply performing an inverse Fourier transform of that data in the form
![$$ {\cal I}_{\cal R} ({\bf{X'}}) \equiv R_{23} \gamma _C ({\bf{X'}}) = \frac{{l_A }}{{8\pi ^2 }}\int {\frac{{V({\bf{X}}_c ,\omega )}}{{s_I (\omega )[ {\hat P( {{\bf{X}}_c ,{\bf{X}}_0 ,\omega } )} ]^2 }}\exp [ - i{\bf{k}} \cdot {\bf{X'}}]} d^2 {\bf{k}}, $$](/wp-content/uploads/2016/05/A314073_1_En_12_Chapter_Equ19.gif)
(12.19)
where it is assumed that  can take on any continuous values in the range
  and the frequency,
  , likewise can range over all values
  so that
  can take on any value in the entire k-plane. In this formal result we see that we have deconvolved the measured voltage with the system function and the incident wave fields. Deconvolution by straight division, however, is unstable in the presence of noise. In ultrasonics, a common approach to remedy this problem is to use a Wiener filter [Schmerr-Song], i.e. we make the replacement
 can take on any continuous values in the range
  and the frequency,
  , likewise can range over all values
  so that
  can take on any value in the entire k-plane. In this formal result we see that we have deconvolved the measured voltage with the system function and the incident wave fields. Deconvolution by straight division, however, is unstable in the presence of noise. In ultrasonics, a common approach to remedy this problem is to use a Wiener filter [Schmerr-Song], i.e. we make the replacement
![$$ \frac{{V({\bf{X}}_c ,\omega )}}{{s_I (\omega )[ {\hat P({\bf{X}}_c ,{\bf{X}}_0 ,\omega )} ]^2 }} \to V_W ({\bf{X}}_c ,{\bf{X}}_0 ,\omega ), $$](/wp-content/uploads/2016/05/A314073_1_En_12_Chapter_Equ20.gif)
(12.20)
where
![$$ V_W ({\bf{X}}_c ,{\bf{X}}_0 ,\omega ) = \frac{{V({\bf{X}}_c ,\omega )\left\{ {s_I (\omega )[ {\hat P( {{\bf{X}}_c ,{\bf{X}}_0 ,\omega } )} ]^2 } \right\}^* }}{{\left| {s_I (\omega )[ {\hat P( {{\bf{X}}_c ,{\bf{X}}_0 ,\omega } )} ]^2 } \right|^2+ \varepsilon ^2 \max \left\{ {\left| {s_I (\omega )[ {\hat P( {{\bf{X}}_c ,{\bf{X}}_0 ,\omega } )} ]^2 } \right|^2 } \right\}}} $$](/wp-content/uploads/2016/05/A314073_1_En_12_Chapter_Equ21.gif)
(12.21)
and where  denotes the complex conjugate and
  is a noise constant. The effect of this replacement is to avoid division by small terms that can amplify the noise and instead drive the filtered response to zero whenever either the system function,
  , or the pressure wave field term,
  , goes to zero. In terms of this replacement, Eq. (12.19) becomes
 denotes the complex conjugate and
  is a noise constant. The effect of this replacement is to avoid division by small terms that can amplify the noise and instead drive the filtered response to zero whenever either the system function,
  , or the pressure wave field term,
  , goes to zero. In terms of this replacement, Eq. (12.19) becomes
![$$ {\cal I}_{\cal R} ({\bf{X'}}) = \frac{{l_A }}{{8\pi ^2 }}\int {V_W ({\bf{X}}_c ,{\bf{X}}_0 ,\omega )\exp [ { - i{\bf{k}} \cdot {\bf{X'}}} ]d^2 {\bf{k}}} . $$](/wp-content/uploads/2016/05/A314073_1_En_12_Chapter_Equ22.gif)
(12.22)
In this case, the Wiener filter will also modify the image generated so strictly speaking we should indicate this by a change in left side expression of Eq. (12.22) but to emphasize that we are still trying to image the reflectivity as defined in Eq. (12.19) we will leave this expression unchanged here. Equation (12.22) is still in terms of a 2-D integration over the 2-D wave number plane,  , but we can transform it to an integration over the frequency,
  , and the angle,
  , (measured clockwise from a line passing through
  parallel to the z-axis—see Fig. 12.13) by a change of variables to yield
 , but we can transform it to an integration over the frequency,
  , and the angle,
  , (measured clockwise from a line passing through
  parallel to the z-axis—see Fig. 12.13) by a change of variables to yield
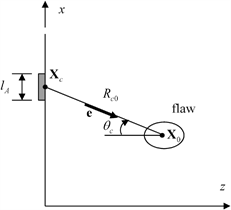
Fig. 12.13
Geometry parameters for the pulse-echo response of a typical array element
![$$ {\cal I}_{\cal R} ({\bf{X'}}) = \frac{{l_A }}{{8\pi ^2 }}\int {V_W ({\bf{X}}_c ,{\bf{X}}_0 ,\omega )\exp [ - i{\bf{k}} \cdot {\bf{X'}}]} \left| {\frac{{(\partial k_x ,\partial k_z )}}{{(\partial \omega ,\partial \theta _c )}}} \right|d\omega d\theta _c , $$](/wp-content/uploads/2016/05/A314073_1_En_12_Chapter_Equ23.gif)
(12.23)
where the Jacobian of the transformation is given by
![$$ \begin{array}{l} \left| {\frac{{\partial (k_x ,k_z )}}{{\partial (\omega ,\theta _c )}}} \right| = \left| {\det \left[ {\begin{array}{*{20}c} {\partial k_x /\partial \omega } & {\partial k_z /\partial \omega }\\[8pt][8pt] {\partial k_x /\partial \theta _c } & {\partial k_z /\partial \theta _c }\\[8pt][8pt]\end{array}} \right]\;} \right| \\[8pt] = \left| {\det \left[ {\begin{array}{*{20}c} { - 2\sin \theta _c /c} & {2\cos \theta _c /c}\\[8pt][8pt] { - 2\omega \cos \theta _c /c} & { - 2\omega \sin \theta _c /c}\\[8pt][8pt]\end{array}} \right]\;} \right| = 4\left| \omega\right|/c^2 . \\[8pt]\end{array} $$](/wp-content/uploads/2016/05/A314073_1_En_12_Chapter_Equ24.gif)
(12.24)
Also, we can write the angle,  , in terms of the
  -coordinate along the line z = 0, since
 , in terms of the
  -coordinate along the line z = 0, since
(12.25)
![$$ {\cal I}_{\cal R} ({\bf{X'}}) = \frac{{l_A }}{{2\pi ^2 c^2 }}\int {\frac{{\cos \theta _c }}{{R_{co} }}V_W ({\bf{X}}_c ,{\bf{X}}_0 ,\omega )\exp [ - i{\bf{k}} \cdot {\bf{X'}}]} \,\left| \omega\right|d\omega dx_c . $$](/wp-content/uploads/2016/05/A314073_1_En_12_Chapter_Equ26.gif)
(12.26)
Equation (12.26) is an imaging model for a setup where the deconvolved voltage received by an element (whose centroid location is allowed to take on continuous values along a line) is used to form an image of the specular surface response of the flaw as defined in Eq. (12.19). In an array, of course, the element centroid locations only exist at N discrete locations,  ,
,  and if we consider only M positive discrete frequencies,
  ,
,  , we can write Eq. (12.26) as a finite sum and form a band-limited and aperture-limited image of the flaw reflectivity,
  at the points
  as:
as:
 ,
,  and if we consider only M positive discrete frequencies,
  ,
,  , we can write Eq. (12.26) as a finite sum and form a band-limited and aperture-limited image of the flaw reflectivity,
  at the points
  as:
as:![$$ {\cal I}_{\cal R}^{BA} ({\bf{X'}}) = \frac{{2l_A \Delta f\Delta x_c }}{{c^2 }}2{\mathop{\rm Re}\nolimits} \left\{ {\sum\limits_{m = 1}^M {\sum\limits_{n = 1}^N {\frac{{(\cos \theta _c )_n }}{{(R_{co} )_n }}} } f_m V_W ( {{\bf{X}}_{cn} ,{\bf{X}}_0 ,\omega _m } )\exp [ { - i{\bf{k}}_{nm}\cdot {\bf{X'}}} ]} \right\}, $$](/wp-content/uploads/2016/05/A314073_1_En_12_Chapter_Equ27.gif)
(12.27)
where  is the sampling spacing in the frequency domain and
  is the pitch of the array.
 is the sampling spacing in the frequency domain and
  is the pitch of the array.
Equation (12.27) is the discrete imaging measurement model counterpart of Eq. (12.26). Note that here we are treating “inversion” and “imaging” as essentially synonymous since we are using the inversion of a reduced measurement model to form an image of an explicit physical reflectivity response of the flaw. In practice, flaw images are often generated without placing a meaning on the amplitude values in the image or without taking into account the band limited system properties or wave processes that produced the image. B-scan, C-scan, S-scan, SAFT, and TFM images are all examples of such image formation methods. In fact, the SAFT imaging approach discussed in Sect. 12.1 is closely related to this imaging measurement model, as we will now show.
Since SAFT ignores system function properties and wave propagation processes, we can show how to reduce our imaging measurement model to SAFT by first setting the  term in our Wiener filter (Eq. 12.21) equal to zero and use Eq. (12.14) to write Eq. (12.27) as
 term in our Wiener filter (Eq. 12.21) equal to zero and use Eq. (12.14) to write Eq. (12.27) as
![$$ {\cal I}_{\cal R}^{BA} ( {{\bf{X'}}} ) = \frac{{2l_A \Delta f\Delta x_c }}{{c^2 }}2{\mathop{\rm Re}\nolimits} \left\{ {\sum\limits_{m = 1}^M {\sum\limits_{n = 1}^N {\frac{{(\cos \theta _c )_n }}{{(R_{co} )_n }}f_m \frac{{V({\bf{X}}_{cn} ,\omega _m )}}{{s_I (\omega _m )[ {P({\bf{X}}_{cn} ,{\bf{X}}_0 ,\omega _m )/\rho cv_T^{(1)} } ]^2 }} \cdot \exp [ { - 2i\omega _m {\cal T}({\bf{X}}_{cn} ,{\bf{X}}_0 ) - 2ik_{2m} {\bf{e}}_n\cdot {\bf{X'}}} ]} } } \right\}. $$](/wp-content/uploads/2016/05/A314073_1_En_12_Chapter_Equ28.gif)
(12.28)
But, recall because of our small flaw assumption we expanded the total time travel function to first order so  and if we simply ignore all system and wave terms not associated with the directly measured voltage response except the parameter
  we can recover the SAFT algorithm as discussed in Sect. 12.1:
 and if we simply ignore all system and wave terms not associated with the directly measured voltage response except the parameter
  we can recover the SAFT algorithm as discussed in Sect. 12.1:
![$$ {\cal I}_{SAFT} ({\bf{X}}) = 2{\mathop{\rm Re}\nolimits} \left\{ {\frac{{\Delta \omega }}{{2\pi }}\sum\limits_{m = 1}^M {\sum\limits_{n = 1}^N {V({\bf{X}}_{cn} ,\omega _m )\exp [ { - 2i\omega _m {\cal T}({\bf{X}}_{cn} ,{\bf{X}})} ]} } } \right\}. $$](/wp-content/uploads/2016/05/A314073_1_En_12_Chapter_Equ29.gif)
(12.29)
In both our imaging measurement model and the SAFT imaging approach, we are only using the pulse-echo responses of the array elements to form an image. This subset of all the possible sending and receiving pairs of elements we see is sufficient to reconstruct the reflectivity of the flaw with our imaging measurement model and a related image quantity in the SAFT approach. If we use a full matrix capture of all combinations of sending and receiving elements to form an image we expect to obtain a “better” image in some sense since we are summing over many more element pairs but how is such an image related to the reflectivity of the flaw? To answer this question, consider first the case where we have a single sending element and receive with all elements of the array. Going back to Eq. (12.12) we have for the voltage response from the specular reflections of the flaw in a single medium:
![$$ V({\bf{X}}_s ,{\bf{X}}_r ,\omega ) = s_I (\omega )\hat P^{(1)} ({\bf{X}}_s ,{\bf{X}}_0 ,\omega )\hat P^{(2)} ({\bf{X}}_r ,{\bf{X}}_0 ,\omega ) \cdot \frac{2}{{l_A }}\int\limits_{C_{lit} } {R_{23} ({\bf{e}}_r\cdot {\bf{n}})\exp [ {ik_2 ( {{\bf{e}}^{(1)}+ {\bf{e}}^{(2)} } ) \cdot {\bf{X'}}} ]} ds({\bf{X'}}). $$](/wp-content/uploads/2016/05/A314073_1_En_12_Chapter_Equ30.gif)
