Author, year
Radiological tumor response
Biomarkers tumor response
N, type of microspheres
Size1
Size + Necrosis2
TTP
ORR (CR + PR)
DCR (CR + PR + SD)
ORR (CR + PR)
DCR (CR + PR + SD)
Na
(%) pt
AFP reduction
Lau et al. 1998
71, resin
27 %
46
89
>50 %
22
Normalization
Dancey et al. 2000
22, glass
20 %
75 %
10.2 m
Carr et al. 2004
65, glass
38 %
Salem et al. 2005
43, glass
47 %
79 %
Sangro et al. 2006
24, resin
24 %Ψ
100 %Ψ
Kulik et al. 2006
35, glass
50 %
Riaz et al. 2009
35, glass
45 %
92 %
57 %
89 %
5.9 m
55
70
>50 %
77
>20 %
41
>90 %
17
Normalization
Gaba et al. 2009
20, glass
55 %
100 %
90 %
100 %
6
50
>50 %
70 %Ψ
100 %Ψ
50
Normalization
Lewandosky et al. 2009
43, glass
61 %
98
86 %
100 %
Iñarrairaegui et al. 2010b
50, resin
12 %Ψ
94 %Ψ
29
31
>50 %
Salem et al. 2010
291, glass
42 %
57 %
7.9 m
Carr et al. 2010
99, glass
33 %
76 %
Kooby et al. 2010
42, resin
11 %Ψ
52 % Ψ
21
24
>30 %
Hilgard et al. 2010
76, glass
15 %
94 %
40 %
93 %
10 m
16 %Ψ
90 % Ψ
41 %Ψm
89 % Ψm
Iñarrairaegui et al. 2010a
25, resin
67 % Ψ
Salem et al. 2011
123, glass
49 %
72 %
13.3 m
Lance et al. 2011
38, resin and glass
26
46
>30 %
Mazzaferro et al. 2013
52, glass
40 %
75 %
40 %
79 %
11 m
68
>50 %
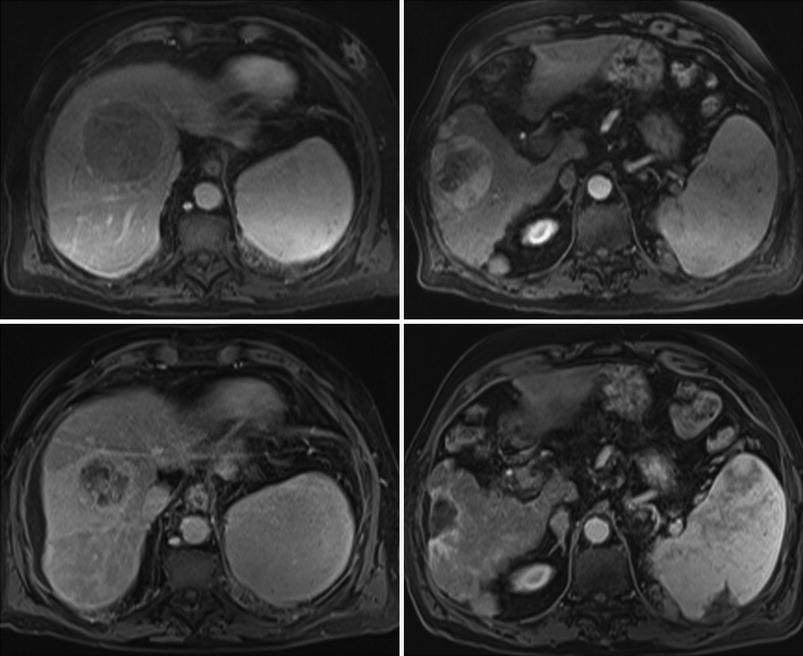
Fig. 1
A cirrhotic patient with two HCC nodules of 6.8 cm in segment VIII (arterial phase MRI, top left) and 9.8 cm in segment VI (arterial phase MRI, top right). After 90Y-RE from right hepatic artery, prolonged response was achieved and 18 months after treatment, lesion in segment VIII was reduced in size and showed a heterogeneous contrast enhancement (arterial phase MRI, bottom left) while lesion in segment VI was reduced in size, showed no arterial enhancement and caused a retraction of the liver surface (arterial phase MRI, bottom right)
Among patients with small tumors treated selectively, radiological findings have been found to correlate with pathologic necrosis in a retrospective series of 35 patients treated prior to transplantation. Complete pathologic necrosis was seen in 100 and 93 % of the lesions that showed complete response by EASL criteria or a thin rim of peripheral contrast enhancement, respectively (Riaz et al. 2009). Evaluation of tumor response may be more complicated in patients with multinodular or diffuse tumors or portal vein thrombosis. Interestingly, a simplified method has been reported that awaits validation in additional series of patients. Among 245 patients treated by locoregional therapies including TACE and 90Y-RE, the response in the so-called “primary index lesion” (the dominant-treated lesion, irrespective of multifocality) by WHO, RECIST, or EASL criteria correlated with improved time to progression and survival (Riaz et al. 2010a).
2.1.1 Dose–Response Relationship
The actual dose of radiation absorbed by tumor tissue cannot be calculated after 90Y-RE. It depends on the activity administered, which can be measured, but also on different parameters that cannot be determined, from the exact positioning of the catheter to the evolving arterial hemodynamics over the injection period or the vessel density inside the different tumors of the same patient. All these factors provide differences in the biodistribution of microspheres and in the absorbed doses of radiation in different areas of the treated tissue. In practice, dosimetry is based on a simulation with macroaggregated albumin labeled with technetium 99 (99mTc-MAA). It is performed in order to calculate lung shunting from a planar scintigraphy, and may be used to estimate the average dose that will be delivered to the non-tumoral liver and to the tumor from planar or SPECT images, calculating the tumor/non-tumor ratio. Although the ability of 99mTc-MAA images to predict Y90 activity distribution and dosimetry is far from ideal, the majority of series that explore retrospectively the dosimetry based on 99mTc-MAA images have shown a dose–response relationship. Lau et al. (1994) first reported that an objective response by combined WHO and alpha-fetoprotein criteria occurred in higher proportion (7/8) of patients in which every tumor absorbed more than 120 Gy when compared to those (1/8) in which at least one tumor received an estimated absorbed dose of less than 120 Gy. Survival was also better in the former group (median survival: 55.9 vs. 26.2 weeks). More recently, in a study of 36 patients treated with 90Y-RE, a higher estimated dose delivered to the tumor was associated with the appearance of radiological response according to EASL criteria and with overall survival, and a threshold for tumor absorbed dose of 205 Gy enabled response prediction with a high accuracy (Garin et al. 2012). Finally, in a dosimetric analysis of 65 tumor lesions, EASL response correlated with the dose absorbed by target lesions (Spearman’s r = 0.60, 95 % CI: 0.41–0.74, p < 0.001). Lesions lacking objective response received a median dose of 275 Gy, while responding tumors were found to absorb a median of 490 Gy. An efficacy threshold of 500 Gy significantly predicted the observed objective response and limited to 20 % the rate of nonresponders (AUC = 0.78) (Mazzaferro et al. 2013). Nevertheless, it should be emphasized that a consistent cut-off value that ensures a tumor response has not been reported, and that no prospective study has confirmed these observations. All these data support the current search for innovative treatment planning based on tumor/non-tumor dosimetry methods applied to 99mTc-MAA SPECT as pretreatment prediction of efficacy.
2.2 Tumor Response by Biomarkers
It has been recently proposed that changes in levels of alpha-fetoprotein after locoregional therapy can be considered a good method for assessing tumor response and survival, as well as an early objective screening tool for progression by imaging (Sherman 2010). Alpha-fetoprotein response has also been explored after 90Y-RE, as it is described in Table 1. With different cut-off values for elevated alpha-fetoprotein (40 and 400 ng/ml), alpha-fetoprotein response defined as more than 50 % decrease from baseline was observed in 30–89 % of patients (Lau et al. 1998; Gaba et al. 2009; Riaz et al. 2009; Iñarrairaegui et al. 2010b; Mazzaferro et al. 2013). Time to alpha-fetoprotein response was 2.7 months (CI 95 % 2.3–4 months) and alpha-fetoprotein response correlated with overall survival (p < 0.001) (Riaz et al. 2009).
3 Effect of Radioembolization in the Liver
The predominantly arterial vascularization of liver tumors provides the basis for the aim of delivering tumoricidal doses of radiation to liver tumors while sparing the non-tumoral tissue. However, in 90Y-RE the non-tumoral liver tissue also absorbs a certain dose of radiation. The effects that this radiation produces in the liver are largely unknown but may translate into a variety of changes in liver function tests, morphological changes such as liver atrophy, and clinical syndromes including radioembolization-induced liver disease (REILD) that is covered in another chapter of this book.
3.1 Liver Toxicity
The potential to induce significant liver toxicity is the main drawback of 90Y-RE in cirrhotic patients, because of their reduced functional reserve and regenerative ability. Cirrhosis may influence the development of liver toxicity because the usual distribution of microspheres can be profoundly altered by changes in the microvascular pattern and the presence of anatomical arterio-portal and arterio-venous shunts. These alterations may modify the radiation dose absorbed by the non-tumoral liver and affect treatment tolerance. The functional reserve of a cirrhotic liver is reduced, and this contributes to an increased risk of liver failure after any liver insults as radiation (Furuse et al. 2005). From a theoretical point of view, besides a direct liver cell injury radiation could compromise liver blood flow by a radiation-mediated blood vessel damage. This may results in a higher risk of clinically relevant liver toxicity after 90Y-RE in comparison with non-cirrhotic livers. A dose–response relation has been reported also for liver toxicity. HCC patients with liver toxicity were exposed to significantly higher absorbed doses in the non-tumoral liver (median: 49.9 vs. 27.4 Gy p < 0.02) (Sangro et al. 2006). Again, the lack of an adequate dosimetry and the heterogeneous distribution of the microspheres throughout the liver parenchyma may explain the lack of a consistent cut-off point. However, toxicity is extremely rare when patients receive an average of 40 Gy to the non-tumoral liver in a 2-compartment model (Gil-Alzugaray et al. 2012). An expert agreement is that the dose absorbed by the non-tumoral liver tissue should be kept below 50 Gy for all patients and maybe below 40 Gy for patients with an impaired non-tumoral liver (Lau et al. 2012).
REILD can be the most severe liver complication after 90Y-RE. It was initially described in non-cirrhotic patients as jaundice and ascites appearing 1–2 months after RE in the absence of tumor progression or bile duct occlusion (Sangro et al. 2008). More recently, we have analyzed its incidence and predisposing factors in 260 patients (both cirrhotic and non-cirrhotic). In the same cohort, we have evaluated the effect that some modifications in the treatment protocol (changes in treatment design, activity calculation and routine use of ursodeoxycolic acid, and low dose steroids) had on its incidence. In cirrhotic patients, REILD occurred in 9.3 % of patients when using the current modified protocol. REILD was more likely to occur in those patients with small liver volumes (<1.5 L), hypersplenism (platelets <100/pL) or abnormal bilirubin, and in those treated in a selective fashion (Gil-Alzugaray et al. 2012). The actual incidence of this complication in cirrhotics and non-cirrhotics patients is difficult to establish because most published series report on changes in individual laboratory values along different periods of time, from 30 days to the entire follow-up period.
3.2 Liver Atrophy and Radiation Segmentectomy and Lobectomy
Liver atrophy may occur in patients treated with 90Y-RE (Jakobs et al. 2008) and has been associated with an increase in bilirubin (Nosher et al. 2011). Although this remains an important issue in cirrhotic patients, no long-term complications derived from portal hypertension have been reported in the literature so far. When a single lobe is targeted (and usually receives a more intense treatment), liver atrophy affects the treated lobe and is associated with a contralateral increase in lobar volume (lobar atrophy–hypertrophy complex formation), in what has been termed “radiation lobectomy” (Gaba et al. 2009; Fernandez-Ross et al. 2013). It has been recently described in patients with unresectable HCC that this hypertrophy along with tumor response in the treated area may allow some patients to receive surgical treatment with a curative intent and prolonged survival (Iñarrairaegui et al. 2012).
Further on, radiation segmentectomy is an approach by which high-dose radiation is delivered to two or fewer hepatic segments, resulting in eradication of the tumor (Riaz et al. 2011). By limiting this high dose of radiation to segmental hepatic anatomy, patients are theoretically able to tolerate these radiation doses with much less risk of developing the potentially fatal complications of liver irradiation. The radiated sector usually develops a process of atrophy and over time, the entire segment can even disappear in cross-sectional images. This technique requires comprehensive and careful hepatic angiography prior to treatment, and can be applied to those tumors in which ablation and resection are contraindicated because of location, co-morbidities, or insufficient liver reserve.
4 Results in Hepatocellular Carcinoma
Having described the effects of 90Y-RE in the tumor and the liver, we will review in the next pages the available evidence supporting the role of 90Y-RE in the different stages of HCC using the Barcelona Clinic Liver Cancer (BCLC) classification, that has been endorsed by the two main Western Hepatology societies, EASL (European Association For The Study Of The Liver; European Organisation For Research And Treatment Of Cancer 2012) and the American Association for the Study of Liver Diseases (AASLD) (Bruix and Sherman 2011). All the evidence comes from retrospective series or non-controlled prospective studies (Lau et al. 1994; Geschwind et al. 2004; Salem et al. 2005, 2006; Lewandowski et al. 2009; Kulik et al. 2006, 2008; Iñarrairaegui et al. 2010a, b), without any randomized controlled trials comparing 90Y-RE with other available therapies. However, in the last 3 years four large series have provided valuable information in the different stages of HCC, and may allow to put the outcomes in the perspective of other treatments, mainly in terms of survival (Salem et al. 2010; Hilgard et al. 2010; Sangro et al. 2011; Mazzaferro et al. 2013) (Table 2). Besides, some of these series provide with data on toxicity (Table 3) and on surrogate endpoints that are likely to predict clinical benefit, as objective tumor response rates and time to progression. Despite this growing body of evidence and due to the lack of randomized controlled trials, 90Y-RE is not recommended in the proposed algorithms of treatment in the above mentioned EASL and AASLD guidelines (European Association For The Study Of The Liver; European Organisation For Research And Treatment Of Cancer 2012; Bruix and Sherman 2011). However, its use is considered in others guidelines, as the European Society for Medical Oncology (ESMO) (Jelic et al. 2010) and the National Comprehensive Cancer Network (NCCN) (Benson et al. 2009) and has been a matter of debate and editorials in one of the most notable journal of the specialty lately (Kulik 2010; Bolondi and Piscaglia 2013).
Table 2
Median survival after radioembolization of HCC patients according to tumor stage
Author, year | N | Median survival (months) | 95 % confidence interval |
|---|---|---|---|
BCLC A | |||
Salem et al. 2010 | 48 | 26.9 | 17.0–30.2 |
Sangro et al. 2011 | 52 | 24.4 | 18.6–38.1 |
BCLC B | |||
Salem et al. 2010 | 83 | 17.2 | 13.5–29.6 |
Hilgard et al. 2010 | 51 | 16.4 | 12.1–∞ |
Sangro et al. 2011 | 87 | 16.9 | 12.8–22.8 |
Mazzaferro et al. 2013 | 17 | 18 | 12–38 |
BCLC C | |||
Salem et al. no EHD 2010 | 107 | 7.3 | 6.5–10.1 |
Salem et al. EHD 2010 | 45 | 5.4 | 2.7–7.5 |
Sangro et al. 2011 | 183 | 10.0 | 7.7–10.9 |
Mazzaferro et al. 2013 | 35 | 13. | 9–17 |
Table 3
Non-liver related clinical toxicity among HCC patients treated by 90Y-RE
Author, year | Salem et al. 2010 | Sangro et al. 2011 | Hilgard et al. 2010 | Mazzaferro et al. 2013 a
Related posts: and Requirements of Hospitals Performing Radioembolization
for Combining Radioembolisation with Systemic Chemotherapy for Metastatic Colorectal Cancer
in Liver Metastatic Colorectal Cancer and Requirements of Hospitals Performing Radioembolization
for Combining Radioembolisation with Systemic Chemotherapy for Metastatic Colorectal Cancer
in Liver Metastatic Colorectal Cancer
 Liver Disease Liver Disease
 of the Response by Multimodality Imaging of the Response by Multimodality Imaging
 Medicine Procedures for Treatment Evaluation and Administration Medicine Procedures for Treatment Evaluation and Administration
Stay updated, free articles. Join our Telegram channel
Full access? Get Clinical Tree
 Get Clinical Tree app for offline access

|
|---|