Fig. 1
Axial spectral presaturation with inversion recovery image of the thigh with more or less symmetric hyperintensities of mainly the anterior compartment in DM. Fat suppression is not uniform over the leg
Thigh muscles that are affected on MRI in DM/PM patients show a significantly higher number of inflammatory cells in muscle tissue after a muscle biopsy compared to non-affected MRI muscles of the same patients, thus perhaps indicating an increase in the yield of a histological diagnosis after MRI-guided biopsy (Tomasova Studynkova et al. 2007).
The cost effectiveness of MRI in suspected PM is evaluated in a small study of 25 patients through comparing false-negative biopsies in patients with biopsies based upon MRI results versus untargeted biopsies. False-negative results are reported in one of 14 patients after MRI-guidance biopsies and in 5 of 11 without MRI guidance. MRI prior to biopsy has been associated with a medical costs reduction from 20,000 USD to 14,000 USD, which the authors presented as cost-effective. These costs are outdated and cannot be used at present as patients were admitted for many days, which was included in the price as were other ancillary investigations (Schweitzer and Fort 1995; Fleckenstein 1996). A 1994 study in the Washington DC area found that the cost of performing and interpreting an MRI ranged from 680 to 1030 USD whereas the costs for performing a muscle biopsy and interpretation ranged from 1520–2400 USD. The authors concluded that MRI might be more cost-effective than repeat biopsy (Adams et al. 1995). So far consensus is lacking on this subject.
In IIM, STIR sequences are preferred over fat-saturated T2-weighted sequences due to their more uniform fat suppression (Fig. 2). Administration of gadolinium appears to have no advantages compared to T2-weighted images (Reimers et al. 1994) or in comparison to STIR and fat suppressed T2 images (Dion et al. 2002). MRI protocols in IIM commonly contain axial slices of several muscle groups aimed at the highest probability of finding diagnostically helpful features. The upper legs are preferentially studied, because they are often affected, and are an easy target for a muscle biopsy.
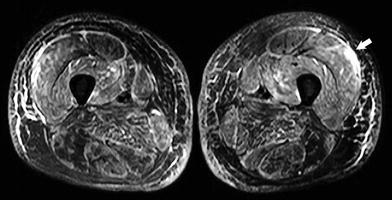
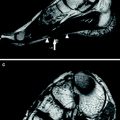
Fig. 2
Axial STIR images of the thigh in a different patient with DM with hyperintensities of mainly the anterior compartment and fascia with chemical shift artifact between skin and subcutis (arrow)
Increasingly, whole-body MRI becomes available to clinicians (see also MRI in Muscle Dystrophies and Primary Myopathies of this book). It has the advantage to detect areas of muscle inflammation in clinically unsuspected muscles, which may even be easily accessible for a muscle biopsy (Cantwell et al. 2005). Furthermore, it gives an overall picture of the anatomic distribution and size of lesions, and expands our knowledge about disease variability as muscles such as the intercostal muscles have now observed to be also affected by the disease process and inflammation can be visualized in cases of suspected amyopathic DM (Fig. 3). Whole-body STIR MRI can be done in 15–30 min, depending on respiratory triggering and the number of coronal slices needed on each level (O’Connell et al. 2002). Whole body T1-weighted MRI can be done even faster.
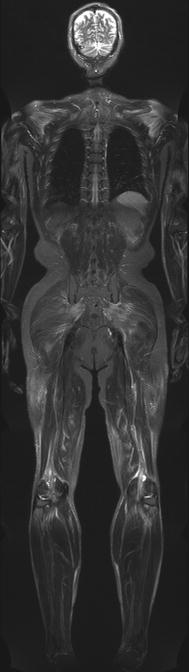
Fig. 3
Coronal STIR MR whole body image of a 56-year-old patient with DM. Symmetrical edema-like changes are present within the shoulder girdle and the thighs, as well as the gluteal muscles (image courtesy of Prof. Dr. M.-A. Weber, Heidelberg)
The hyperintensity observed on STIR or fat-suppressed T2-weighted images, is often regarded as muscle edema, an unspecific sign. It can be subtle, focal, diffuse, inhomogeneous, and with ill demarcated margins and be the result of muscle injury, inflammation, interstitial fluid overload or (sub)acute denervation. Apart from inflammatory myopathies, muscle edema is also observed, diffuse or focal, in muscular dystrophies such as Duchenne’s muscular dystrophy, fascioscapulohumeral dystrophy and myotonic dystrophy, metabolic myopathies, toxic myopathies, infectious myopathies, congenital myopathies such as minicore disease, muscle channelopathies such as hypokalemic periodic paralysis, rhabdomyolysis, sports injuries, after acute exercise, but also in neurogenic lesions, including neuropathies such as hereditary motor and sensory neuropathies and spinal muscular atrophy. Apart from metabolic myopathies these increased T2 signal intensities are usually infrequent, relative and unspecific (Schedel et al. 1992, 1995).
In a small series of DM and PM patients, MRI has been shown to have a sensitivity of 100 %, a specificity of 88 %, a positive predictive value of 77 %, and a negative predictive value of 100 %, as compared to histopathological diagnosis (Weber et al. 2006). Another larger study reported a sensitivity of 80 % (Reimers et al. 1994). So far, only studies in 0.5–1.5 T MRI have been published on the subject of IIM.
4.2 Muscle Involvement Patterns in IIM on MRI
The number of studies looking at MRI abnormalities in DM is limited. Focal or diffuse areas with high signal intensity on fat-suppressed T2-weighted images are the most common findings. These areas suggest edema or inflammation and are preferentially located in proximal muscles and tend to be more or less symmetrical. In unusual cases, however, a unilateral distribution can be seen (Reimers et al. 1994). Within these high signal intensity areas, signal intensities may fluctuate. There is a preference for involvement of the four heads of the quadriceps muscles and the dorsiflexors of the lower legs. Least affected muscles are the pectineus, obturatorius, thigh adductors, biceps femoris caput brevis, gracilis, soleus and caput laterale of the gastrocnemius (Reimers et al. 1994). There can be diffuse or focal subcutaneous edema, and edema may show a myofascial pattern in some muscles (Cantwell et al. 2005; O’Connell et al. 2002; Schulze et al. 2009; Yoshida et al. 2010).
In PM studies, the problem of uncertainty with regard to the correct diagnosis at inclusion reappears. Reported MRI studies may be hampered by unjustly including IBM patients or DM patients without a rash and consequently the results of these PM studies are less reliable. In those studies where IBM patients have been excluded inflammation is a more prominent feature than fatty infiltration (Cantwell et al. 2005; Dion et al. 2002; Reimers et al. 1994). Patients may have inflammation as a sole manifestation, thus in the absence of fatty infiltration. Both, however, are located preferentially in proximal limb muscles with a more or less symmetrical distribution. Most studies focused on abnormalities in the legs. Muscles with high signal intensity on fat-suppressed T2-weighed images are most frequently the vasti of the quadriceps, the anterior tibial and the caput laterale of the gastrocnemius. Fatty infiltration is preferentially observed in the hamstrings, vastus muscles of the quadriceps, and the gastrocnemius.
Least affected muscles by inflammation are the gracilis, peroneal, extensor digitorum, posterior tibial, flexor digitorum, and flexor hallucis longus muscles. Comparatively spared from fatty infiltration are the rectus femoris, gracilis, posterior tibial, and soleus muscles (Reimers et al. 1994). During treatment, inflammatory changes on MRI resolve but without a clear clinical correlation.
The MRI hallmarks of IBM are inflammation, fatty infiltration and (asymmetric) atrophy, with fatty infiltration as the most noticeable feature (Fig. 4). Inflammation is erratically present, most often in a patchy focal nature (Fig. 5). It is repeatedly found in the extensor carpi ulnaris, soleus and gastrocnemius muscles.
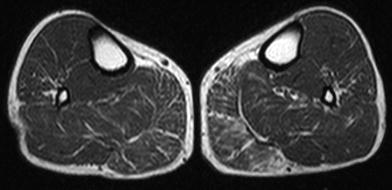
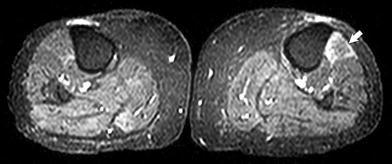
Fig. 4
Axial T1-weighted images of the lower legs showing the beginning of preferential and asymmetric fatty infiltration of the medial gastrocnemius muscle, most pronounced on the left side, in inclusion body myositis
Fig. 5
Axial STIR images through the lower legs showing hyperintensity in the left anterior tibial muscle (arrow) in inclusion body myositis
Fatty infiltration is more prominent in the legs than in the arms, and the lower legs have less muscle bulk left compared to the upper legs. The upper arms are more affected than the shoulder girdle muscles and in the forearm the deep finger flexors appear to be the most vulnerable to fatty infiltration. In the upper legs, the ventral muscles are more affected than the dorsal muscles and adductors, with sparing of the rectus femoris muscle (Phillips et al. 2001). In the lower legs, the medial part of the gastrocnemius muscle appears to be the most susceptible for fatty infiltration, and the lateral head is often spared (Cox et al. 2011a).
Asymmetry of muscle bulk usually follows the clinical pattern of muscle weakness distribution and that of fatty infiltration of muscle groups. Disease duration, the degree of muscle weakness, and functional disability scores correlate well with the level of fatty infiltration in IBM. Fatty infiltration is more usual and apparent in IBM than in PM. Inflammation is less obvious in IBM than in PM and does not relate to the level of weakness.
MRI in NM (Fig. 6) has hardly been reported and shows edema of the thigh muscles (100 %), muscle atrophy (75 %), fatty replacement (67 %), and fascial edema (25 %) in a selection of 16 patients with auto-immune associated necrotizing myopathy (Christopher-Stine et al. 2010).
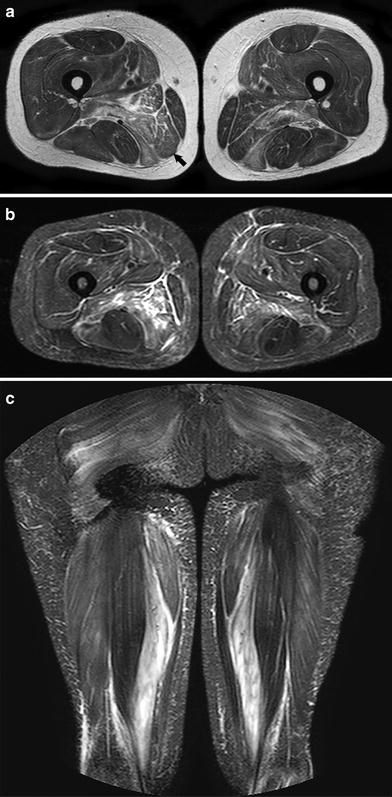
Fig. 6
a Axial T2-weighted images (without fat suppression) of the thigh in a patient with necrotizing myopathy with hyperintensities of preferentially the dorsomedial compartment (arrow) and fascia b Axial STIR images of the thigh of the same patient as in Fig. 5a c Coronal STIR images of the same patient as in Fig. 6a
4.3 Other Magnetic Resonance Imaging Techniques in IIM
Phosphorous magnetic resonance spectroscopy (MRS), 31P MRS, is used to assess energy metabolism in muscle. With this technique, high energy phosphate metabolites phosphocreatinine (PCr), adenosine triphosphate (ATP), and inorganic phosphate (Pi) can be assessed as well as tissue pH (see also chap 8 of this book). In the quadriceps muscles of DM patients, elevated levels of the ratio of Pi/PCr are observed, which is attributed to lower levels of PCr. During exercise, PCr levels drop further compared to controls and the recovery of PCr after exercise is slower in these patients. In addition, the level of phosphorylated sugars is increased compared to control subjects (Park et al. 1990). These changes all indicate disturbed energy metabolism, both at rest and during exercise, and show problems with oxidative ATP production. Interestingly, these abnormalities are also found in mitochondrial dysfunction. The problems in DM are not thought to be due to impaired mitochondrial function, but are due to reduced oxygen supply by the vessels. Also in PM, problems with oxidative ATP production are found, which is in contrast to IBM, where PCr recovery after exercise is normal. In IBM, lower levels of PCr and increased levels of Pi are observed (Argov et al. 1998; Lodi et al. 1998; Cea et al. 2002).
Diffusion-weighted imaging (DWI) enables quantification of the apparent diffusion coefficient, a measure of random motion of water. Using sophisticated models, diffusion of water within the muscle fibers and in the capillary bed can be separated. Using this technique, skeletal muscles of DM and PM patients that appear normal on T1 and T2 weighted images also show no differences in diffusive properties compared to healthy muscles. Muscles with inflammation showed increased diffusion values, which agree with an increase in the amount of fluid in these muscles. In contrast, muscles with fat infiltration show decreased diffusion values, in agreement with a reduction in water content. Interestingly, modeling of the diffusion signal indicates that there is a reduced perfusion volume in muscles with inflammation, which could be due to a reduced capillary bed (Qi et al. 2008).
Magnetic resonance elastography is a method to measure muscle stiffness based upon the propagation of shear waves. A decrease of muscle stiffness is found in patients with PM/DM/JDM (McCullough et al. 2011). Wave attenuation, a viscoelastic parameter, is significantly different in healthy muscles compared to muscle of patients with DM/PM (Domire et al. 2009).
Quantitative and semi-quantitative assessment with MRI has been done by measuring the T2 relaxation time as well as by visual or automated assessment of signal intensity values on fat saturated T2-weighted or STIR images. An increased T2 relaxation time gives rise to increased signal intensity on STIR or fat-suppressed T2-weighted images, but can also be quantitatively and semi-quantitatively assessed to enable a more objective and accurate measure of muscle edema. While this has significant advantages in terms of therapy follow-up or disease monitoring, in severely atrophied and fat infiltrated muscles it is impossible to measure the T2 relaxation time accurately. In the acute phase of DM and PM, semi-quantitative visual analysis of signal intensity correlates well with global disease activity and muscle disease activity (Tomasova Studynkova et al. 2007).
In response to treatment, MRI intensity parameters on STIR and T2-weighted fat-suppressed images improve (Reimers et al. 1994; Fujino et al. 1991). This improvement precedes improvement of muscle biopsy features in a second biopsy (Tomasova Studynkova et al. 2007). Another method based upon pixel intensity values is the myositis index, which uses a histogram of intensity values obtained from STIR images. This method appears to be equally sensitive to changes on MRI in PM, DM, and one patient with IBM as visual analysis (Bartlett et al. 1999).
Whether swift improvement of MRI abnormalities is predictive of a favorable outcome remains to be studied. In JDM, T2 values were measured and compared to inactive JDM. The T2 relaxation time is significantly increased in active JDM and correlates with muscle strength (Maillard et al. 2004).
4.4 Other Imaging Modalities Used in IIM
Computed tomography scanning in the inflammatory myopathies can be useful in muscle imaging in IBM, but is less informative in PM and least in DM and NM. CT has a good spatial resolution, but lacks the contrast resolution of MRI to distinguish smaller muscles from each other. In IBM, CT is able to detect fatty infiltration, muscle atrophy, and asymmetry, but inflammation is missed as is the case in the other types of immune-mediated myopathies. Although CT scanning is widely available, faster, less sensitive to motion artifacts and cheaper, it has the disadvantage of ionizing radiation exposure and is less informative compared to MRI, especially in detecting edema-like muscular changes. Therefore, MRI is the preferred imaging modality unless contraindications exist, such as certain metal implants like pacemakers and cochlear implants or claustrophobia, making it impossible to use. CT is superior in detecting muscle calcifications.
Muscle ultrasonography can be used to detect inflammation in muscles and has, in particular, been described in PM and DM patients. Affected muscles show increased echogenicity and the fasciae and septa become obscured and the normal architecture changes. Contrast-enhanced intermittent power Doppler ultrasound in PM and DM showed significant higher blood flow velocities, blood volume, and blood flow compared to patients without myositis, with blood flow being the best measure for DM and PM with a sensitivity of 73 %, a specificity of 91 %, a positive predictive value of 80 %, and a negative predictive value of 88 % (Weber et al. 2006) (Fig. 7). Ultrasound is compared with MRI often readily available, not distressing, and easy to do without contraindications and cheap. Reproducibility may vary between sonographers. Ultrasound can be used for muscle biopsy guidance as well to reduce the false-negative rate. MRI, however, gives a more global scope on involvement because more muscles and even deeply located muscles are investigated at once than with ultrasound. Calcifications can also be detected by ultrasound as bright echogenic foci with acoustic shadowing.
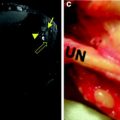
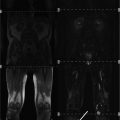
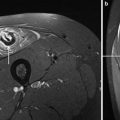
Fig. 7
a–c 64-year old woman with DM. d–f 36-year old woman with final diagnosis of collagenosis and exclusion of myositis on histologic analysis. a and d Whole-body MR imaging using a fat-suppressed T2-weighted short tau inversion recovery sequence. Transverse images of power Doppler sonography (7 MHz) after bolus injection of 10 mL Levovist in 1.5 cm depth (focus area) showing initial increase b, e and maximum plateau c, f) of microbubbles’ replenishment. In DM, a focal area of moderate signal enhancement in the right vastus lateralis muscle is visible (arrow in a), whereas in the other patient, muscles are free of pathological signal alterations d. The corresponding contrast-enhanced power Doppler signals clearly visualize the higher concentration of microbubbles in muscle tissue of the woman with myositis b, c due to the higher muscle perfusion. Reprinted from Weber et al. (2006) J Neurol 253: 1625–1632 with permission from Springer
Scintygraphy has been used to assess myositis using technetium (Tc 99 m), gallium (Ga 67), and indium (In111) altumomab pentetate-labeled antimyosin antibodies. Uptake of antimyosin antibody in the legs correlates with myositis activity based on CK levels (Lofberg et al. 1998). Scintigraphy lacks the ability to distinguish between lesions in different muscle groups and does not reflect atrophy or fatty infiltration compared to MRI.
Swallowing video-fluoroscopy is the method of first choice to objectively assess dysphagia. Dysphagia is common in the idiopathic inflammatory myopathies. Obstruction due to cricopharyngeal dysfunction, vallecular and piriform sinus residues, pharyngeal weakness, diverticula and aspiration can be visualized.
18F-fluorodeoxyglucose-PET/CT has limited value in detecting active inflammation in PM and DM patients because of its low sensitivity; the diagnostic yield is lower than that of EMG, MRI, and muscle biopsy (Owada et al. 2012). However, it is useful in the detection of malignancies and one study group advocates that it is equally sensitive to conventional screening with CT scanning of the chest and abdomen, mammography, gynecological screening, ultrasonography, and tumor marker analysis (Selva-O’Callaghan et al. 2010a). However, cost and accessibility have to be weighed against personal convenience and distress of these investigations.
5 Other Idiopathic Inflammatory Myopathies
Granulomatous myositis can occur in isolated form, as part of sarcoidosis or secondary to a disorder associated with skeletal muscle granuloma such as inflammatory bowel disease, thymoma, myasthenia gravis, and lymphoma. It can be asymptomatic or present as a subacute or chronic myositis. The acute form presents with proximal muscle weakness, whereas the chronic form can evolve into a clinical picture that is indistinguishable from IBM (Le Roux et al. 2007; Larue et al. 2011). On MRI of the thigh, preferential affliction by fatty replacement in the adductors and semimembranosus muscles, with relative sparing of the rectus femoris and semitendinosus muscles has been described in chronic cases (Reimers et al. 1994), but given the small numbers of patients investigated is it still uncertain whether MRI may be helpful in discriminating between IBM and isolated granulomatous myositis.
Eosinophilic polymyositis occurs as part of the hypereosinophilic syndrome with an idiopathic rise of eosinophils causing infiltration and clinical signs and symptoms of the involved organs. There is slow onset of muscle aching with weakness of proximal muscles. There can be skin changes, Raynaud phenomenon, and small hemorrhages of the nail beds. Serum CK is elevated and the muscle biopsy shows predominantly eosinophilic infiltration, scattered necrosis, and regeneration of muscle fibers. MRI data are scarce, but suggest a diffuse and irregular hyperintensity of muscle on STIR images (Hundt et al. 1999; Layzer et al. 1977).
6 Therapy in Idiopathic Inflammatory Myopathies
The first line of treatment in DM and PM is administration of corticosteroids, based on empirical data, in order to improve muscle strength. High dose prednisolone is given during 6–8 weeks and then tapered off during a year. Pulsed oral dexamethasone compared with daily oral prednisolone is equally effective, but the latter has more side effects but a longer median time to relapse (van der Meulen et al. 2000). A second immunosuppressive agent (azathioprine, methotrexate, cyclophosphamide, cyclosporine A) is added in case of relapse, ineffective treatment, failure to lower the prednisolone dose in time, or in order to minimize side effects. Sometimes intravenous immunoglobulin is used. Treatment of a concurrent neoplasm can result in improvement or fading of clinical symptoms.
In IBM, none of the immunosuppressive or immunomodulating therapies tested have shown long-term benefit, neither improvement, nor stabilization of the disorder. Intravenous immunoglobulin may temporarily improve dysphagia.
Chronic obstructive dysphagia in the IIM can be treated with a cricopharyngeal myotomy. Botulinum toxin injections have been reported to be effective as well. Sometimes a percutaneous gastrostomy is needed to prevent cachexia and orally administered fluid or food aspiration.
7 Infectious Inflammatory Myopathies
The infectious inflammatory myopathies can be split up into viral, parasitic, fungal, and bacterial myopathies. Apart from infectious myositis via the direct infection of skeletal muscle, microorganisms may also cause myositis past immune mechanisms. Bacterial myositis ordinarily presents with focal infection of the muscle, whereas viruses and parasites present with a more diffuse clinical picture of widespread myalgia or multifocal muscle involvement.
Acute viral myositis is a disorder following a short illness, usually accompanied by fever, associated with a viral infection. The most common symptom is myalgia, but muscle tenderness and swelling, weakness, and a moderately elevated serum CK can accompany this disorder. Benign acute childhood myositis begins within a week after developing symptoms like malaise, fever, sore throat, headache, nausea or rhinorrhea, and usually starts with pain of the calves, gait difficulties, and sometimes leading to refusal to walk. It most commonly resolves within a week (Middleton et al. 1970; Rubin et al. 2010). It is related to an Influenza virus infection but has also been described after adenovirus, parainfluenza virus, respiratory syncytial virus, and herpes simplex virus infections. Muscle biopsies of the gastrocnemius muscle may show necrosis and mononuclear inflammatory infiltrates depending on the time between the biopsy and initial symptoms. Influenza virus myositis in adults is uncommon, but when present, weakness and tenderness are more diffuse compared to children.
Overall, acute viral myositis in adults is rarely described in large series, but has been associated in small series and case reports with many viruses, such as Epstein-Barr virus, echovirus, cytomegalovirus, human immunodeficiency virus (HIV) type I, adenovirus, herpes simplex virus, hepatitis B and C, dengue virus, and parainfluenza virus.
Related posts:
 of Skeletal Muscle in Neuromuscular Disease: A Clinical Perspective
 of Skeletal Muscle Anatomy to MRI and US Findings
 MRI for Evaluation of the Entire Muscular System
 Spectroscopy and Spectroscopic Imaging for Evaluation of Skeletal Muscle Metabolism: Basics and Applications in Metabolic Diseases
 in Muscle Tumors and Tumors of Fasciae and Tendon Sheaths
 of Muscle Injuries
Stay updated, free articles. Join our Telegram channel

Full access? Get Clinical Tree


