Fig. 1
Typical myotonic bursts on conventional electromyographic examination performed with a concentric EMG needle. The bursts consist of repetitive muscle action potentials that typically show a modulation of amplitude and frequency. Mostly the amplitude decreases and the frequency increases
Periodic paralysis occurs episodically with varying intervals of normal muscle function. Apparently, the underlying ion channel defects are usually well compensated and an additional trigger is often required for channel malfunction. Two dominant episodic types of weakness with or without myotonia are distinguished by the serum K+ level during attacks: HyperPP and HypoPP. Intake of K+ and glucose has opposite effects in the two disorders: while K+ triggers attacks and glucose is a remedy in HyperPP, glucose-induced hypokalemia provokes attacks in HypoPP which are ameliorated by K+ intake (Lehmann-Horn et al. 2004). Due to additional release of K+ from muscle in HyperPP and uptake of K+ by muscle in HypoPP, the resulting dyskalemia can be so severe that cardiac complications arise. During an attack, death can also occur due to respiratory insufficiency (Jurkat-Rott et al. 2009). Independently of the severity and frequency of the paralytic episodes, many patients develop a chronic progressive myopathy in their forties, an age at which the attacks of weakness decrease.
5 Histopathology
Myotonic muscle fibers may have normal appearance, however, slight myopathic changes with increased occurrence of central nuclei and pathological variation of fiber diameter may be found. Both hypertrophy of type 2A fibers and absence of type 2B fibers can be identified (Jurkat-Rott and Lehmann-Horn 2013) (Fig. 2).
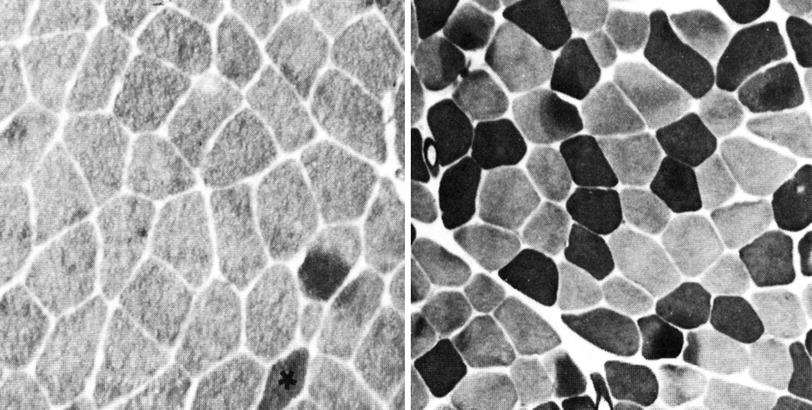
Fig. 2
Histopathologic images of muscle cross sections obtained from myotonia congenita patients. Preincubation of muscle slices at pH 4.6 yields in high ATPase activities (dark) of type 2B fibers while type 2A fibers show no activity (bright). In contrast to the control (right), myotonia patients exhibit almost no type 2B fibers (left the only 2B fiber is marked by an asterisk)
In both types of familial periodic paralysis, dilations of components of the T-tubular system and the sarcoplasmic reticulum occur. Dilation, proliferation, and regeneration result in vacuolization (Engel 1970). Contractions of nearby myofibrils and focal increases in muscle glycogen have also been noted, suggesting that the changes in several organelles accounted for the permanent myopathy of the disease. In otherwise unaffected fibers, collections of multiple closely packed tubules giving a honeycomb appearance may be viewed in cross sections, mostly at the end of fiber. These tubular aggregates are located between longitudinally running myofibrils or beneath the sarcolemma and may contain an internal circular membrane that is not normally seen in the T-tubule or the sarcoplasmic reticulum from which they originate (Jurkat-Rott and Lehmann-Horn 2013; Engel 1970).
6 Magnetic Resonance Imaging
Myotonia congenita and PAM patients do not generally present with pathological imaging findings. In potassium-aggravated myotonia, normal T1- and T2-weighted MR images of the lower legs were observed in a study of six patients (median age, 43 years) (Weber et al. 2006a). In a recent study, three severely affected RMC patients were examined using a multisequence (T1-weighted, T2-weighted, fat suppressed T2-weighted sequences) whole-body 3 Tesla MRI (Kornblum et al. 2010). In agreement with (Weber et al. 2006a), none of the patients showed skeletal muscle signal changes indicative of fatty muscle degeneration or edema. However, two patients showed muscle bulk hypertrophy of thighs and calves in line with the clinical appearance (Fig. 3) (Kornblum et al. 2010). The authors concluded that chloride channel myotonia and even serious and prolonged transient weakness alone do not result in MRI skeletal muscle signal changes, while MRI fatty skeletal muscle changes and edema that can be seen in myotonic dystrophy type 1 (Kornblum et al. 2006) are not the result of chloride channel dysfunction but clearly consequences of the dystrophic disease process. Therefore, imaging can be used to differentiate DMC and RMC from myotonic dystrophy in which there is reduced muscle mass and edema. Likewise, the prominent muscle bulks in myotonia congenita are due to genuine muscle hypertrophy and not to pseudo-hypertrophy as possible differentiation to other muscular dystrophies (Kornblum et al. 2010). In myotonic dystrophy type 1, a characteristic distribution of muscle involvement with frequent and early degeneration of the medial heads of gastrocnemius muscles, and a perifemoral semilunar pattern of quadriceps muscle affection sparing the rectus femoris has been reported using 3 Tesla MRI (Kornblum et al. 2006). The most frequently affected muscles in myotonic dystrophy type 1 were the medial heads of gastrocnemius, soleus, and vastus medialis muscles.
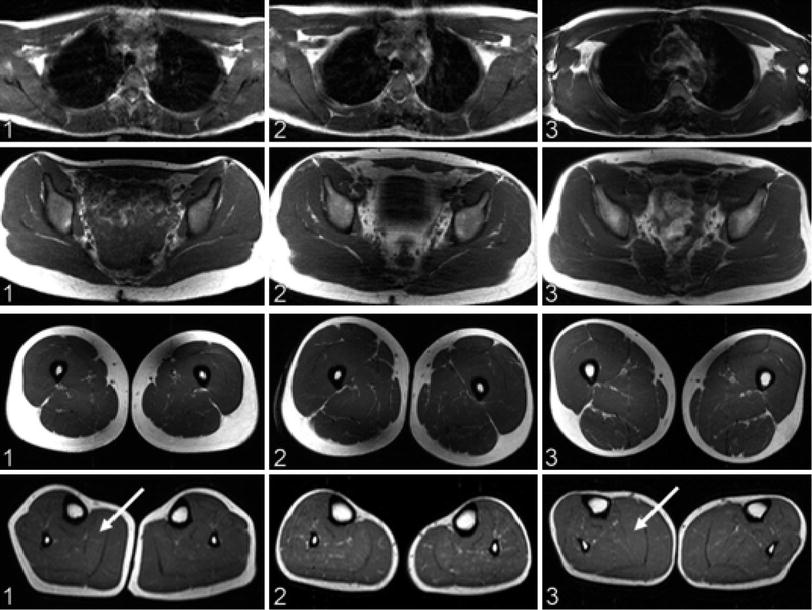
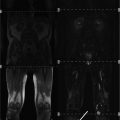
Fig. 3
Whole-body magnetic resonance imaging (MRI) findings in three recessive myotonia congenital (RMC) patients corresponding to columns 1–3. Axial sections of T1-weighted turbo spin-echo sequences at the level of the shoulder girdle (top row), pelvis (second row), thighs (third row), and calves (bottom row). In all patients, shoulder girdle and trunk muscles showed no trophic changes. Patients 1 and 3 had hypertrophy of the thigh and calf muscles (arrows). Lower leg muscles of patient 2 were comparatively hypotrophic, with neither fatty degeneration nor skeletal muscle edema. Reproduced with permission of Kornblum et al. (2010)
In PC, approximately 38 % of patients show normal muscle on T1-weighted and T2-weighted 1.5 Tesla MR imaging examinations of the lower legs (Weber et al. 2006b). In 12.5 % (two male R1448C patients of 25 and 42 years), a bilaterally symmetric homogeneous edema was observed at rest before any exercise or other provocation scheme that was confined to the medial head of the gastrocnemius muscle (Fig. 4) (Weber et al. 2006b). Edema-like muscular changes in the triceps surae muscles were evidenced in 10 % of PC patients (median age 45 years) in another cohort (Weber et al. 2006a). Up to 50 % of older patients (mean age 55 ± 13 years; mutation, R1448H in 1, T1313 M in 3, and R1448C in 4 patients) showed a bilaterally symmetric increased signal intensity of the medial head of the gastrocnemius muscle on T1- and T2-weighted images that was interpreted as a fatty infiltration. There was no distinct muscle atrophy in any of the so far studied 16 paramyotonia patients (Weber et al. 2006b). Highly specific for PC is 23Na MRI which can visualize and monitor aspects of muscular pathophysiology, such as a disturbed muscular Na+ homeostasis. For example, cooling of the lower leg muscles of PC patients, opens non-inactivating Na+ channels and depolarizes the muscle fibers and thereby causes muscle stiffness followed by muscle weakness that lasts several hours even after immediate rewarming (Weber et al. 2006a). 23Na MRI is able to depict a myoplasmic sodium accumulation (Fig. 5) which correlates well with the grade of paresis (Fig. 6) (Weber et al. 2006a) and is reproducible (Weber et al. 2006b). Therefore, 23Na MRI is the method of choice for this disease. Na+ channel blockers such as mexiletine are able to prevent the myoplasmic sodium accumulation (Fig. 7) (Weber et al. 2006b).
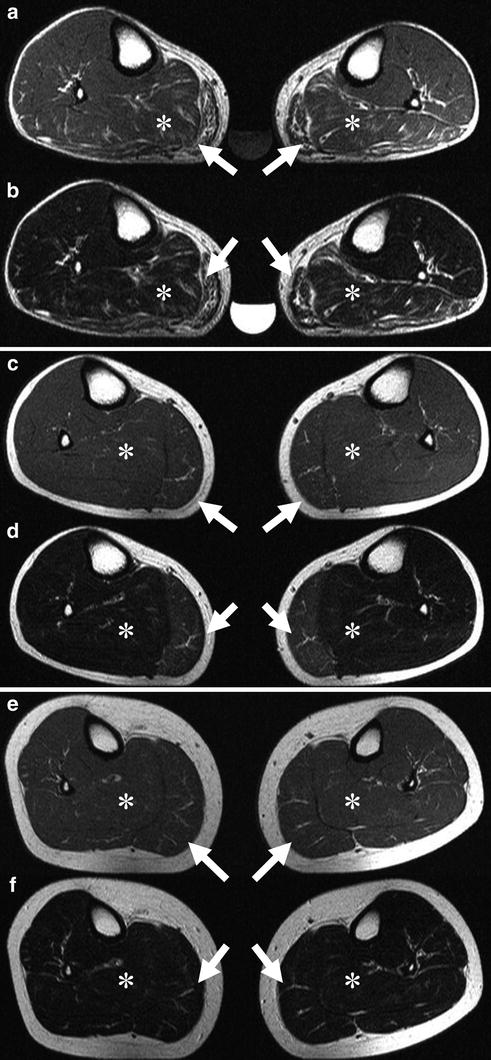
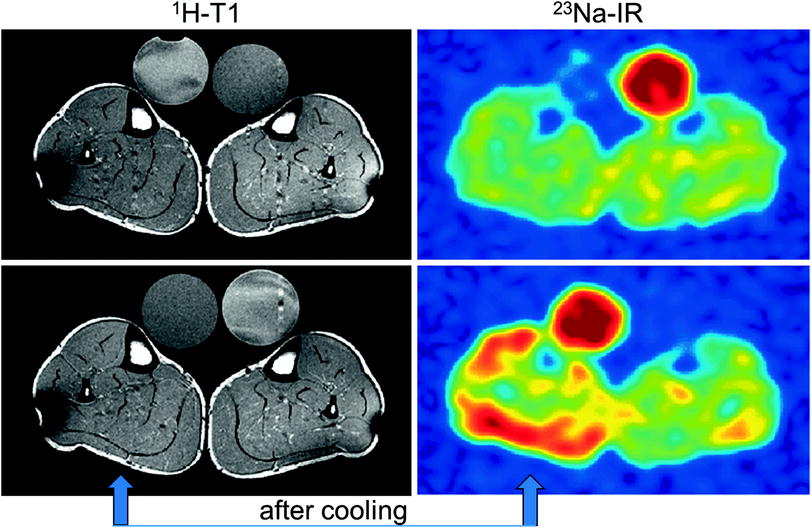
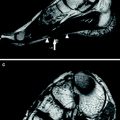
Fig. 4
a, c, e, Transverse T1-weighted spin-echo (516/15) and, b, d, f, transverse T2-weighted turbo spin-echo (3000/104) MR images of both lower legs in a family with paramyotonia congenita (R1448C mutation). Images of the 54-year-old father (a, b) show a symmetrically fatty infiltration of both gastrocnemius muscles (arrows) and edema in both soleus muscles (asterisks). The 0.3 % saline reference phantom is also visible. Images of the 25-year-old son (c, d) show muscle edema, a precursor and possible causative mechanism of muscle degeneration, bilaterally symmetrical in the medial head of both gastrocnemius muscles, whereas the youngest family member, a 17-year-old daughter (e, f), has not yet developed morphologic changes. Reproduced with permission of the Radiological Society of North America (RSNA) from Weber et al. (2006b)
Fig. 5
1H-MR and 23Na-MR images of a PC patient before and after cooling of the lower leg (arrow). While the T1-weighted 1H-MR signal is unaltered, the 23Na inversion recovery (Na-IR) signal is markedly increased in the muscles of the cooled leg (blue low intensity, red high intensity)
Fig. 6
Analysis of the correlation between 23Na signal increase, membrane potential, and muscle strength reduction. The filled symbols represent the mean resting membrane potentials of the muscle fibers taken from the eight patients (three PC, three HyperPP, two PAM) versus the muscular 23Na signal increase of these patients. The open symbols show the decrease in muscle strength of all patients who underwent a provocation test (nine PC, seven HyperPP, five PAM) versus the muscular 23Na signal increase of these patients. The degree of the membrane depolarization correlates with the percent change of the muscular 23Na signal after provocation according to the function y = 0.825x—60.3 (continuous line) and yields a correlation coefficient of r = 0.92 after Pearson. The muscle strength reduction is much less correlated with the muscular 23Na signal (r = 0.48; y = 0.043 x + 0.24, dashed line for plantarflexion). Reproduced with permission of Weber et al. (2006a)
Fig. 7
Graph shows results in seven patients with paramyotonia congenita before (first and second examination) and after (third examination) blockage of pathologic Na+ channels. Percentage change of muscular 23Na signal intensity after cooling (measured by means of 23Na free induction decays with a time delay between end of the radiofrequency pulse and start of acquisition (echo time) of 0.2 ms) is shown for each patient. There is a decrease in the extracellular-to-intracellular Na+ concentration ratio in the cooled leg at the first and second examination (without mexiletine). At the third examination, concomitant with an improvement in muscle strength, there is an increase in the concentration ratio to values comparable to those in the reference leg. Reproduced with permission of Weber et al. (2006b)
In HyperPP, increased signal intensities on T2-weighted 1.5 Tesla 1H MRI were visible in the triceps surae muscles of 43 % of the patients prior to any provocation (Fig. 8) (Weber et al. 2006a). In a more recent series using 3 Tesla MRI, eight of twelve HyperPP patients exhibited edema-like changes prior to any provocation on STIR images (Amarteifio et al. 2012). Seven of the twelve HyperPP patients showed fatty infiltration/degeneration, i.e., high signal intensities within their lower leg muscles on T1-weighted images (Amarteifio et al. 2012). HyperPP patients suffering from permanent weakness presented with a high degree of lipomatous changes compared to the group without permanent weakness and healthy volunteers (Amarteifio et al. 2012). A specific pattern of lipomatous changes was noticeable: the highest degree of fatty atrophy was observed in the triceps surae muscle (gastrocnemius followed by the soleus muscle). The peroneal muscles showed concomitantly with the lowest degree of edema-like changes also the lowest degree of fatty atrophy/degeneration (Fig. 9) (Amarteifio et al. 2012). In the hip muscles, the ischiocrural muscles are particularly affected.23Na MRI displayed significantly higher intracellular muscular sodium signal intensities normalized to a reference phantom containing 51.3 mM Na+ in HyperPP patients with permanent weakness than in those without permanent weakness or healthy volunteers (0.83 vs. 0.67 vs. 0.53). Cooling induced or aggravated muscle weakness in the patients and further increased the sodium signal intensity significantly from 0.75 to 0.86 (Fig. 10). High sodium signal intensities were associated with an osmotic edema. In five patients with permanent weakness, treatment with acetazolamide or hydrochlorothiazide reduced the muscular 23Na signal intensity from 0.85 to 0.64 and increased muscle strength (Amarteifio et al. 2012).
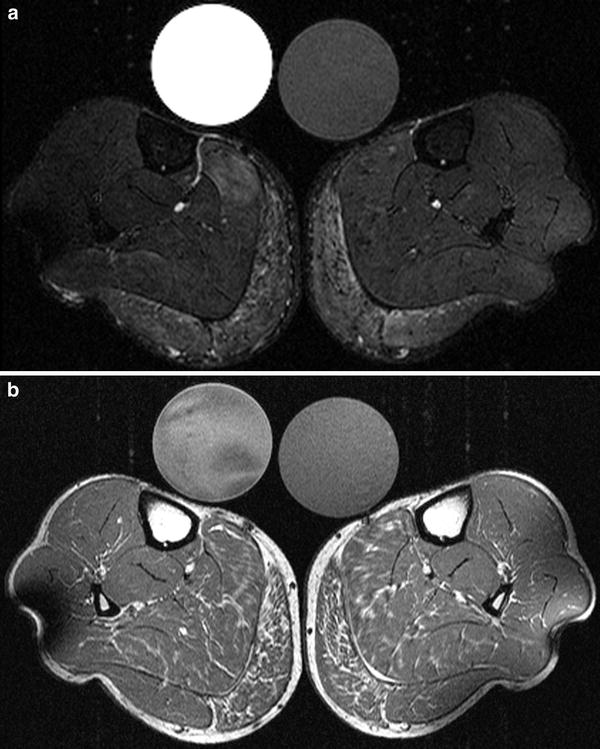
Fig. 8
Muscular 23Na signal intensity relative to reference prior to and after provocation. Muscular 23Na MRI signal intensities of regions-of-interest from the lower legs are shown in relation to the signal of the phantom prior to and after provocation. The figures give the age of the individuals in years. PC and HyperPP patients exhibited a striking increase in the muscle 23Na signal intensity after provocation whereas volunteers showed no significant changes. This increase could also be observed in all PAM patients after cooling. A muscle edema was caused by cooling in all PC patients. The 17-year-old HyperPP patient presented with a unilateral calf edema after he had experienced an attack of paresis and aching muscles of this calf two days before. Reproduced with permission of Weber et al. (2006a)
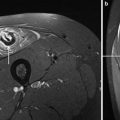
Fig. 9
 of Skeletal Muscle in Neuromuscular Disease: A Clinical Perspective
 of Skeletal Muscle Anatomy to MRI and US Findings
 MRI for Evaluation of the Entire Muscular System
 Spectroscopy and Spectroscopic Imaging for Evaluation of Skeletal Muscle Metabolism: Basics and Applications in Metabolic Diseases
 in Muscle Tumors and Tumors of Fasciae and Tendon Sheaths
 of Muscle Injuries


1H MRI of the lower legs of a HyperPP patient at age 39. Fat-saturated axial T2 short tau inversion recovery (STIR) sequence visualizes edematous changes most pronounced within the gastrocnemius muscle of both calves (a). The axial T1-weighted sequence demonstrates fatty changes most pronounced within both gastrocnemius muscles. The soleus muscle is less affected on both sides (b). Two different reference tubes filled with 51.3 mmol/l sodium are also visible
Related posts:
of Skeletal Muscle in Neuromuscular Disease: A Clinical Perspective
of Skeletal Muscle Anatomy to MRI and US Findings
MRI for Evaluation of the Entire Muscular System
Spectroscopy and Spectroscopic Imaging for Evaluation of Skeletal Muscle Metabolism: Basics and Applications in Metabolic Diseases
in Muscle Tumors and Tumors of Fasciae and Tendon Sheaths
of Muscle Injuries
Stay updated, free articles. Join our Telegram channel
Full access? Get Clinical Tree
