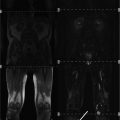
Fig. 1
Axial fat-suppressed T2-weighted images obtained from whole-body MRI protocol in a 37-year-old woman a and a 16-year-old boy with myotonic dystrophy type 1. Please note the dilatation of the esophagus with an air-fluid level (arrows). Both patients presented clinically with a gastrointestinal reflux (from Wattjes et al. (2010) Reprinted with permission from Springer
2.3 Contrast-Enhanced MRI
Contrast-enhanced MRI is important in the diagnosis of neoplastic and inflammatory muscle diseases. In the diagnostic work-up of patients with muscle dystrophies, the use of contrast agents does not have added diagnostic value and is not recommended in the clinical routine setting. Current research is going on developing and testing specific contrast agents targeting affected muscle tissue and allowing the detection of (microstructural) muscle damage even in a preclinical stage are presently a matter of research. When available, such contrast agents may aid in the understanding of the pathophysiological mechanisms of muscle degeneration in inherited muscle diseases. Several new contrast agents are currently in a preclinical stage and are hoped to clinical application in the future may become available. A comprehensive summary of these new contrast agents and the corresponding pharmacodynamics goes beyond the scope of this book chapter. Please consider the following references for further reading (Amthor et al. 2004; Straub et al. 2000; Schmidt et al. 2009).
3 Image Analysis
Image analysis of muscle tissue in patients with suspected and/or definite inherited muscle diseases should include the following parameters:
Shape (normal configuration, deformation etc.)
Size (normal, atrophic, and hypertrophic)
Tissue architecture (homogenous, signs of (fatty) degeneration, and adjacent connective tissue)
Focal lesions (calcifications, soft/mixed tissue lesions)
Signal abnormalities (edema).
The muscle shape, size, and tissue architecture should be analyzed on T1-weighted images. The shape and size of the muscle is depending on individual parameters such as nutrition, exercise, age, sex, and hormone status. In addition, the tissue architecture of the skeletal muscle in terms of shape and inclusion of physiological fat tissue in and adjacent to the muscle strongly differs between muscle groups and anatomic locations.
The crucial parameter in the diagnostic work-up of patients with suspected inherited muscle diseases is the assessment of fatty muscle degeneration. Before approaching this important topic, the reader should be familiar with physiologic T1- and T2 signal intensities (relaxation times) of the two most relevant tissue types of the body: muscle and fat. The signal intensity of skeletal muscle tissue on T1-weighted images is slightly higher than the signal intensity of water and substantially lower than that of fat. On T2-weighted images, the signal intensity of muscle tissue is much lower compared to water and fat tissue. Due to its short T1-relaxation time, the signal intensity of fat tissue is bright on T1-weighted MR images (Figs. 2, 3). Fat shows also high signal intensities on T2-weighted images. T2-weighted images with fat suppression (e.g., STIR) allow to differentiate between fat and water. Water shows a high signal intensity on fat suppressed T2-weighted images leading to a high tissue contrast between fat/water and water (e.g. edema). This substantially improves the sensitivity in the detection intracellular and extracellular free water like in muscle edema (Fig. 3).
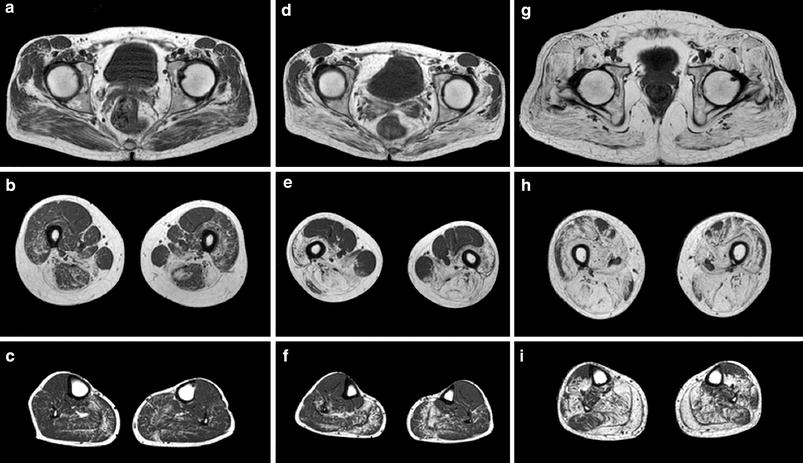
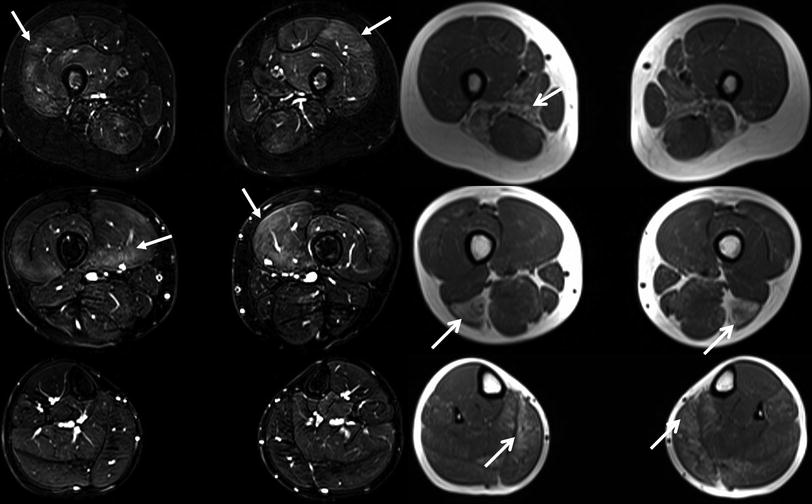
Fig. 2
Axial T1-weighted MRI obtained from three LGMD 2I patients on the pelvic (a, d, g,) thigh (b, e, h) and lower leg (c, f, i) levels demonstrating different degrees of fatty muscle degeneration. The MRI findings correspond well with the clinical phenotype. In the mild clinical phenotype (a, b, c) the fatty degeneration is most obvious in the adductor and biceps femoris muscles. In the patient with a rather moderate clinical phenotype (d, e, f) additionally changes are present in the semimembranosus and semitendinosus, vastus intermediolaterals, and in the gluteus maximus muscles. In the patient with severe clinical phenotype (g, h, i) an almost all muscles diffuse involvement can be observed. Reprinted from Fischer et al. (2005) with permission from Springer
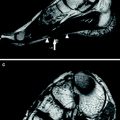
Fig. 3
Axial T1-weighted images (right) and fat suppressed T2-weighted images (left) at different levels of the lower extremities obtained from a 4-year-old female with a genetically unclassified muscular dystrophy. The focal areas of fatty degeneration involving different muscles/muscle groups (open head arrows) are clearly visible on the T1-weighted images. The areas of high signal hyperintensity on the T2-weighted images with fat suppression (closed head arrows) particularly reflect edematous (inflammatory) changes in terms of active muscle degeneration in muscles that do not show fatty degeneration at that time. From: Wattjes MP, “Conventional MRI” in Wattjes and Fischer (2013), with permission from Springer
3.1 Fatty Degeneration
Fatty degeneration (synonym: fatty replacement) is defined as the replacement of muscle tissue by fat. It can be a physiologic phenomenon like in normal aging muscle tissue (sarcopenia) but is more prominent in pathophysiologic conditions such as inactivity, disuse, denervation (chronic stage), drug use (steroids), and degenerative/dystrophic muscle diseases. However, the term fatty degeneration is more appropriate for primary degenerative disease processes like in chronic denervation and (inherited) dystrophic muscle diseases, whereas as the term fatty replacement should rather be used for normal muscle aging and other possibly reversible conditions.
Fatty degeneration as well as fatty replacement can present as focal lesions or as a diffuse process involving the entire muscle or even muscle groups. Since the volume of the muscle may decrease during muscle degeneration, fatty degeneration is frequently associated with atrophy. However, fat deposition may also lead to an increase in muscle volume and therefore to “pseudo hypertrophy”, most frequently observed in the calf muscles (Fischer et al. 2005). Structured and reproducible assessment and grading of fatty muscle degeneration is crucial for the diagnosis and disease monitoring. In particular, patterns of muscle involvement may be of value in diagnostic and differential diagnostic considerations. Although quantitative MR methods such as the three-point Dixon method might be more accurately describe the degree of fatty degeneration (Glover and Schneider 1991; Wren et al. 2008), several semi-quantitative rating scales have been developed, established and validated in clinical practice allowing a fast and reproducible rating of fatty degeneration (Kornblum et al. 2006; Fischer et al. 2008; Mercuri et al. 2002). Table 1 gives an overview of the most established and used rating scales on fatty degeneration in inherited muscle diseases. Fig. 2 shows different stages of fatty degeneration.
Table 1
Overview of well-established rating scales on MRI concerning the visual rating of dystrophic changes (fatty degeneration) of striated muscle tissue
Grade | Mercuri et al. (2002) | Kornblum et al. (2006) | Fischer et al. (2008) |
|---|---|---|---|
0 | Normal appearance | Normal appearance | |
1 | Normal appearance | Discrete moth-eaten appearance with sporadic T1w-hyperintense areas | Mild: traces of increased signal intensity on the T1-weighted MR sequences |
2 | Mild involvement: early moth-eaten appearance with scattered small areas of increased signal or with numerous discrete areas of increased signal with beginning confluence, comprising less than 30 % of the volume of the individual muscle | a. Moderate moth-eaten appearance with numerous scattered T1w-hyperintense areas b. Late moth-eaten appearance with numerous confluent T1w-hyperintense areas | Moderate: increased T1-weighted signal intensity with beginning confluence in less than 50 % of the muscle |
3 | Moderate involvement: late moth-eaten appearance with numerous discrete areas of increased signal with beginning confluence, comprising 30–60 % of the volume of the individual muscle | Complete fatty degeneration, replacement of muscle by connective tissue and fat | Severe: increased T1-weighted signal intensity with beginning confluence in more than 50 % of the muscle |
4 | Severe involvement: washed-out appearance, fuzzy appearance due to confluent areas of increased signal, or an end stage appearance, with muscle replaced by increased density connective tissue and fat, and only a rim of fascia and neurovascular structures distinguishable | End stage appearance, entire muscle replaced by increased density of connective tissue and fat |
3.2 Muscle Edema
Skeletal muscle edema in MRI (synonym: myoedema) is defined as an increase in the amount of extracellular and/or intracellular water leading to a prolonged T2-tissue relaxation time and therefore to high signal intensities on T2-weighted images. Fat suppressed T2-weighted sequences are the most sensitive MR sequences in the detection of myoedema (Fig. 3). Similar to the assessment of fatty degeneration, muscle edema can present as focal areas of edema involving parts of a certain muscle, may involve the entire muscle and muscle groups or may present as diffuse edema involving major parts of the skeletal muscle system such as in systemic rhabdomyolysis. Compared to fatty degeneration, visual rating scales for the assessment and grading (quantification) of myoedema are less popular and not applied on regular basis in the clinical routine setting. One example of a rating scale in muscle edema by Poliachik and colleagues (2012) is presented in Table 2.
Rating scale on skeletal muscle edema (myoedema) |
|---|
Myoedema absent |
Slight, interfascicular myoedema |
Slight, intrafascicular, and segmental myoedema of individual muscle |
Slight, intrafascicular, and global myoedema of individual muscle |
Moderate, intrafascicular, and segmental myoedema of individual muscle |
Moderate, intrafascicular, and global myoedema of individual muscle |
Myoedema is a rather unspecific finding on imaging and is not exclusively being found in degenerative muscle diseases accompanying fatty muscle degeneration. It can be observed in a broad and heterogeneous spectrum of diseases including muscle denervation (Chap. 11), autoimmune (aseptic) inflammatory myopathies (polymyositis, dermatomyositis) (Chap. 13), infectious muscle diseases or infections of the adjacent structures, muscle trauma (Chap. 10), treatment related (e.g., radiation), rhabdomyolysis (e.g., toxic, drug induced), and inherited myopathies/muscular dystrophies. Myoedema may also occur in physiologic conditions e.g., during or after exercise probably due to extracellular (intercellular) water accumulation.
In patients with inherited muscle diseases, the assessment of muscle edema is a crucial part of MR image analysis. Histopathological studies have conclusively shown that the corresponding histopathological findings include the loss of muscle fiber integrity leading to primarily intracellular water accumulation as a first sign of degeneration followed by degeneration of muscle fibers which will subsequently be replaced by fat and connective tissue in later disease stages. The exact pathophysiological mechanism is not well understood yet. However, results from immuno-histochemistry studies provided some arguments that inflammatory processes are involved in dystrophic muscle tissue with muscle edema. The development and degree of muscle edema in dystrophic muscle tissue can be initiated, aggravated, and accelerated by muscle exercise. From the clinical point of view, it is important to understand that muscle edema not only accompanies but also precedes degenerative findings such as fatty degeneration. Therefore, muscle cell edema in dystrophic muscle diseases detected by MRI might be the first imaging manifestation of muscle tissue degeneration. This is of particular importance since these findings on muscle MRI can guide muscle biopsy, in order to acquire muscle tissue with ongoing disease activity as a target tissue for diagnostic and treatment monitoring.
3.3 Pitfalls in Image Analysis
Fat depositions in the skeletal muscle have a broad differential diagnosis and do not exclusively represent fatty degeneration. In terms of the correct interpretation of fatty replacement and degeneration in the skeletal muscle, it is key to distinguish between real fatty muscle degeneration and other entities associated with increased fat deposition, such as soft tissues including lipomas, hemangiomas, and other soft tissue tumors containing lipomatous tissue. Another important pitfall is the increased amount of fat tissue in the muscle of older and/or immobile patients. From the clinical point of view, it is crucial to differentiate between muscle changes due to aging, misuse, and immobilization (e.g., atrophy and fatty replacement) in terms of sarcopenia and abnormalities due to a primary degenerative disease of the skeletal muscle such as late onset inherited muscle dystrophies or sporadic inclusion body myositis. In sarcopenia and “normal aging” skeletal muscle, atrophy and fatty replacement are rather homogenously and symmetrically distributed affecting almost the entire skeletal muscle. In immobilezed patients and patients with misuse, the underlying cause (e.g., degenerative changes of the spine, postoperative changes) must be assessed first to enable a correct interpretation. Degenerative muscle changes in patients with muscle dystrophies can be symmetrically but may also asymmetrical. Co-morbidity such as aging and misuse can make a correct estimation and differentiation of primary and secondary degenerative changes challenging.
As far as the assessment of muscle edema concerns, the greatest pitfall is the inhomogeneous and/or insufficient fat suppression of T2-weighted images due to magnetic field inhomogeneity particularly at the peripheral region of the field of view (Fig. 4). Identifying T2-hyperintense lesions in the skeletal muscle on fat suppressed T2-weighted images, the assessment of the adjacent tissues (e.g., subcutaneous fat) is useful. If the adjacent structures show inhomogeneous signal intensity and an insufficient suppression of the subcutaneous fat, these muscle changes should not be considered as “real” muscle edema. Other important reasons for insufficient fat suppression include susceptibility artifacts particularly close to material containing metal (e.g., joint prosthesis).
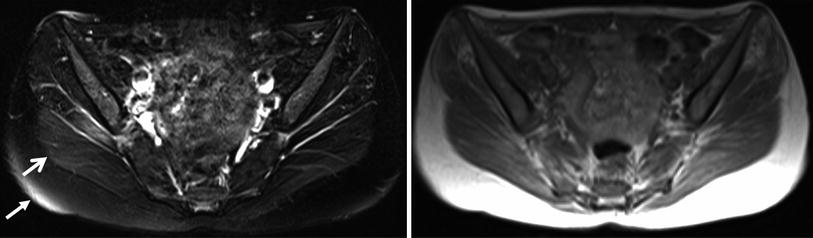
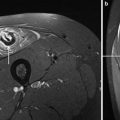
Fig. 4
Axial T1-weighted images (right) and fat suppressed T2-weighted images (left) at the pelvis region from a patient with suspected myotonic dystrophy. The areas with high signal intensities in the subcutaneous fat (closed head arrow) and in the adjacent gluteus maximus muscle (open head arrow) are based on inhomogeneous fat suppression and not on edema. These areas of inhomogeneous fat suppression can be frequently observed in the periphery of the field-of-view. From: Wattjes MP. “Conventional MRI” in Wattjes and Fischer (2013), with permission from Springer
4 Muscle Imaging as a Diagnostic Tool in Muscular Dystrophies
Muscle imaging is increasingly used in neuromuscular disorders to identify the underlying disease in patients with progressive weakness. Often the distribution of weakness in the physical examination is characteristic for a larger group of muscular dystrophies (e.g., limb-girdle muscular dystrophy (LGMD) or distal myopathy) despite of their wide genetic heterogeneity including several underlying genetic defects. While genetic analyses and whole-genome sequencing a widely used the search for a causative genetic mutation is still time consuming and expensive. Dystrophic changes in affected muscles usually do not occur randomly but rather develop in a specific pattern, which is often characteristic for the underlying protein defect and sometimes even for the causative gene. Detecting a specific pattern of muscular involvement is therefore often used to narrow down the genes to be sequenced and evaluated. Several muscle imaging protocols have been described either for the lower limbs (Straub et al. 2012) or in some cases the whole body (Sect. 2.2) (Kornblum et al. 2006; Quijano-Roy et al. 2012; Jarraya et al. 2012). In addition to pattern description, muscle imaging is also used to guide muscle biopsy e.g., to target an involved area which is not yet completely replaced with fatty tissue. In this review we try to focus on common patterns. An exhaustive description of all possible disorders and patterns has been prepared in a larger volume (Wattjes and Fischer 2013).
Related posts:
 of Skeletal Muscle in Neuromuscular Disease: A Clinical Perspective
 of Skeletal Muscle Anatomy to MRI and US Findings
 MRI for Evaluation of the Entire Muscular System
 Spectroscopy and Spectroscopic Imaging for Evaluation of Skeletal Muscle Metabolism: Basics and Applications in Metabolic Diseases
 in Muscle Tumors and Tumors of Fasciae and Tendon Sheaths
 of Muscle Injuries
Stay updated, free articles. Join our Telegram channel

Full access? Get Clinical Tree


