Julien FLAMENT1, Hélène RATINEY2 and Fawzi BOUMEZBEUR3 1 MIRCen, CEA, Fontenay-aux-Roses, France 2 CREATIS, CNRS, Inserm, INSA Lyon, Université Claude Bernard Lyon 1, France 3 NeuroSpin, CEA, Gif-sur-Yvette, France NMR spectroscopy (MRS) is a technique used to study the magnetic properties of nuclei with non-zero spin; it was invented concomitantly soon after the second world war by Purcell (1946), Bloch (1946) (Nobel Prize in Physics 1952) and their collaborators based on the work of Rabi (1938) (Nobel Prize in Physics 1944). Very quickly, MRS developed into a method for chemical structure analysis, in particular thanks to the discovery of chemical shift effects in 1950 by Proctor and Yu (1950) and by Dickinson (1950). In the following decades, other important discoveries and inventions have been made for the development of MRS such as pulsed NMR by Ernst (1991 Nobel prize in chemistry) in Zurich (Ernst and Anderson 1966) and Waugh in Boston at MIT (Waugh 1968). Although MRS is a spectroscopy technique with relatively low sensitivity (compared to other chemical analysis methods exploiting higher energies), it has been rapidly adopted for non-invasive investigations of biological samples, from vegetal ones (Shaw and Elsken 1950) to prepared tissue samples (Odebald and Lindström 1954), or cells (Odebald 1956), and gradually for studying intact excised organs (Moon and Richards 1973; Hoult 1974). However, it was not until the invention of MRI by Mansfield and Lauterbur (Nobel Prize in Medicine 2004) that in vivo MRS in intact and functional organs or animals could be performed (Ackerman 1980). Contrary to MRI, NMR spectroscopy is not (yet) commonly used in clinical routine, partly due to its limited spatial resolution. Nevertheless, it is recognized as a valuable tool for clinical research, in particular for the study of the central nervous system. Indeed, in vivo MRS enables the non-invasive characterization of metabolic changes occurring in many neurological and psychiatric pathologies as well as when monitoring their evolution. This chapter is dedicated to the presentation of the basics of in vivo NMR spectroscopy and metabolic imaging, in particular via chemical exchange saturation transfer (CEST) and non-proton (X) nuclei MRI, with an overview of specific acquisition and analysis methods. Like MRI, NMR spectroscopy is based on the nuclear magnetic resonance phenomenon. Within a strong magnetic field B0, nuclei with a non-zero spin possess quantized magnetic moments precessing around B0 associated with discrete energy levels. From a macroscopic point of view, a magnetization M0 is observed and can be manipulated by means of radiofrequency (RF) waves applied at the Larmor frequency (?0 = ??0/2?). The macroscopic magnetization M0 is calculated from the sum across the sample of all those individual nuclear magnetic moments via the application of Boltzmann’s statistics (see section 1.2.1), where T is the temperature and N is the number of spins: As a result, the macroscopic magnetization M0 increases with the intensity of the magnetic field B0 and the number N of spins in the sample and decreases with the temperature (expressed in K). It should be noted that this magnetization and the Larmor frequency depend on the value of the gyromagnetic ratio γ of the considered nucleus (see Table 9.1). Hence, great differences in sensitivity exist between nuclei. The hydrogen nucleus (1H) or “proton” presents the most favorable sensitivity thanks to its high gyromagnetic ratio and its ubiquity in biochemistry, in particular as water (1H2O) in tissues. Table 9.1. NMR properties of most nuclei-of-interest in biomedical research. IC: intracellular concentration; EC: extracellular concentration In the most simple NMR experiment, a radiofrequency pulse B1(t) is applied, ideally at the sole Larmor frequency, to excite the spins and tip entirely or partially the macroscopic magnetization M0 into the transverse plane. In practice, the radiofrequency pulse B1(t) has a finite selectivity in frequency, as defined by its Fourier transform. The transverse component MT of the magnetization induces an electromotive force within the receiver coil (see section 2.4). A time-domain signal ?(?), called free induction decay (FID), can be recorded, and its frequency-domain representation Ŝ(?), called the NMR spectrum, is obtained after a Fourier transform (Ernst and Anderson 1966): ?(?) ∝ ?x(?) + ??y(?) = ?T(0) ?-(i2π(?0−?)+1/T2∗)t, for a single resonance Figure 9.1. Free induction decay (FID) signal and its spectral representation before and after phase correction Typically, a phase-correcting term ?c = ?0 + 2?(?0 − ?)?1 has to be applied with ?0 and ?1, denoted as the “zero-” and “first-” order phases, respectively (see section 9.3.1.1), to visualize the absorption spectrum ?(?): As illustrated in Figure 9.1, for a single resonance, the absorption spectrum corresponds to a Lorentzian distribution centered at the Larmor frequency and with a full width at half maximum (FWHM) Δ?1/2 equal to 1/??2*. Otherwise, the modulus If MRS could distinguish only different nuclei, that is, 1H and 13C, its utility would be very limited. Luckily, the chemical shift phenomenon allows MRS to differentiate between nuclei of the same element depending on their electronic environment. Figure 9.2. In presence of an external magnetic field B0, electrons generate an opposing magnetic field around the nucleus leading to a local field Blocal = B0 – Binduced Every nucleus is affected not only by the static magnetic field B0 but also by an opposing magnetic field Binduced (Figure 9.2) induced by the motion of electrons, proportional to B0. Therefore, the nucleus perceives a local field ?local = ?0 − ?induced = (1 − ?)?0 and precesses at a specific frequency Although σ is a tensor of the second order, only its trace can be observed if the molecule is in a liquid phase solution. This shielding constant is independent of B0 and is expressed in ppm (parts per million). Experimentally, the chemical shift δ is defined as ? = ?ref − ?, with ?ref the shielding constant of a reference compound such as tetramethylsilane (TMS). Thus, δ of water is equal to 4.786 ppm at T = 37°C for in vivo 1H MRS. For a given molecule, one can observe as many different resonance frequencies as there are non-identical electronic environments. Although it does not depend on the intensity of the magnetic field, the electronic environment can vary depending on the employed solvent, its pH and temperature. The range of chemical shifts depends of course on the considered nucleus. For 1H, it extends over less than 10 ppm, while for 13C it covers about 200 ppm. Besides the chemical shift, direct (through space) or indirect (via shared electrons and thus via chemical bonds) dipolar interactions between nuclear spins help distinguish the molecules of interest according to their NMR spectrum. While the first type of interaction has an average value of zero for solutes in liquids, the second type, also called scalar couplings, spin-spin or J-couplings, influences the energy levels associated with the different possible quantum states of the considered spin system. Thus, for two nuclear spins A and B linked by a covalent bond, one observes, on the one hand, the appearance of doublets instead of single resonances associated with two isolated spins, and, on the other hand, intensity distortions, also referred to as “roof effect” (Figure 9.3). For each possible transition of the spin system AB, table C in Figure 9.3 presents their resonance frequencies and their relative intensities. The values of the scalar coupling constant J are in the range of 100–200 Hz for 1H-13C, 70–110 Hz for 1H-15N, 30–80 Hz for 13C-13C, and 10–20 Hz for 1H-31P. Coupling constants for n bonds exist as well, indicated as nJ, for example, the two-bond coupling 2JHH typically is comprised between –20 and +40 Hz, while 2JCH coupling equals approximately half of 2JHH for a comparable geometry. For two given nuclei, the values of J are quite stable and mainly vary with the geometry, type and number of bonds. Figure 9.3. Energy diagrams and NMR spectra for (A) two isolated nuclei and (B) a system of two spins A and B linked by a covalent bond. (C) Resonant frequencies νij and relative intensities for the AB spins system: Generally, it can be assumed that the J-coupling manifests as a splitting of the NMR resonances following rather simple rules: Figure 9.4. 1H spectrum acquired in a rat at 17 T and its spectral decomposition COMMENT ON FIGURE 9.4. Abbreviations: macromolecules (MM), alanine (Ala), ascorbate (Asc), aspartate (Asp), creatine (Cr), gamma-aminobutyric acid (GABA), glucose (Glc), glutamine (Gln), glutamate (Glu), glycero-phosphoryl-choline (GPC), glycine (Gly), glutathione (GSH), lactate (Lac), myo-inositol (mI), N-acetyl-aspartate (NAA), N-acetyl-aspartyl-glutamate (NAAG), phosphoryl-choline (PCh), phosphocreatine (PCr), phosphoryl-ethanolamine (PE), serine (Ser) and taurine (Tau) (Lopez-Kolkovsky 2015). Metabolites are small (M < 200 Da) and mobile (10-9 < τC < 10-8 s) molecules participating in the metabolism of our cells and whose concentration is sufficient to be detected ([Met] > 10-3 mol/L) in a reasonable time. These metabolites and their concentrations depend on the investigated species and organ. In a human or mouse brain, around 20 metabolites are considered detectable using 1H MRS (Figure 9.4). Among the most prominent are N-acetyl-aspartate, a marker of neural density or vitality; creatine and its phosphorylated form, phosphocreatine, an energy buffer; the choline compounds, intermediaries of membranal metabolism; glutamate and GABA, the main excitatory and inhibitory neurotransmitters, respectively; energetic substrates such as glucose and lactate; osmolytes like myo-inositol and taurine; or antioxidants such as glutathione and ascorbate (vitamin C). MRS identifies these metabolites as markers of abnormal metabolism when unusually absent or concentrated in tissues. This can be particularly useful in oncology (Julià-Sapé 2019), neurology (Rothman 2019), diabetology or myology (Kššák 2021). In vivo MRS provides a biochemical analysis of a volume of interest (VOI) or voxel thanks to different methods of 3D localization or spatial encoding of the NMR signal. These methods are based on the same principles of slice selection or phase encoding employed in MRI (see section 1.5.1). Two approaches can be distinguished: single voxel spectroscopy (SVS) and chemical shift imaging (CSI). SVS aims to acquire a global NMR spectrum from the organ or structure under investigation. The most common SVS sequences are OVS (outer volume suppression), ISIS (image selected in vivo spectroscopy) (Ordidge 1986), STEAM (STimulated Echo Acquisition Mode) (Frahm 1987) and PRESS (Point RESolved Spectroscopy) (Bottomley 1987). Figures 9.5 and 9.6 illustrate the chronograms and present the principles of these spatial localization sequences. Figure 9.5. Main MRS signal localization sequences COMMENT ON FIGURE 9.5.– (A) Signal pre-saturation bands are positioned to excite and then dephase the signals outside the voxel. (B) The signal is localized by means of three spatially selective inversion pulses, executed with a pattern of eight scans such that the intra-voxel signal is summed up (while canceling out the signals outside the voxel). (C) The STEAM and PRESS sequences corresponding to the application of three spatially selective pulses define a parallelepiped where an echo (at TE + TM for STEAM) or a double spin echo (at TE = TE1 + TE2 for PRESS) is stimulated and can be recorded. Other localization sequences have been proposed, such as LASER (Localization by Adiabatic SElective Refocusing) (Garwood and DelaBarre 2001), semi-LASER (Öz and Tkáč 2011) or SPECIAL (SPin‐ECho full‐Intensity Acquired Localized) (Mlynárik 2006). These sequences employ pairs of adiabatic refocusing pulses to generate spin-echoes despite strong non-uniformities of the B1 field, in particular when employing a surface coil, or at very high magnetic fields (see Chapters 2 and 12). In addition, using adiabatic pulses has the benefit of large bandwidths, which reduce chemical shift artifacts (see section 9.5). In practice, multiple localization sequences can be combined together. In particular, OVS bands can be placed at the level of moving organs or the scalp (the corresponding RF pulses operating at the resonance frequency of lipids) before STEAM or PRESS sequences to reduce the contamination of the spectra by undesired signals originating from outside of the voxel. NMR spectroscopic imaging or CSI provides a matrix of spectra from a volume of interest by combining a spatial localization sequence with a phase encoding pattern (see section 1.5.1) that preserves spectroscopic information. As in conventional MRI, a phase encoding scheme is charted across the Fourier or k-space typically along a Cartesian grid with phase-modulated NMR signals ?(?x, ?y, ?): Figure 9.6. Generic 2D chemical shift imaging (CSI) sequence. By combining a spatial localization sequence (A) with a phase encoding scheme (B), one can acquire and reconstruct a matrix of spectra (C) from which metabolic images can be computed Applying a Fourier transform first in space and then in the time domain enables the reconstruction of a matrix of NMR spectra corresponding to each pixel of the spectroscopic image. It should be noted that the actual spatial resolution of the spectroscopic image is estimated via the point spread function (PSF). Due to the modest size of the phase encoding matrix, the PSF can be improved by applying a Hanning-type apodization filter a posteriori, or, preferably, by employing a density-optimized k-space encoding pattern (see Figure 9.6(B)). In 1H MRS, the water signal is several orders of magnitude larger than the signals from the different metabolites of interest. Therefore, to allow their detection, several techniques exist to suppress the water signal. This is usually achieved by including a presaturation module composed of a train of frequency-selective RF pulses with the role of exciting the water signal and then dephasing it immediately before a SVS or CSI sequence. Typical methods are CHESS, WET or VAPOR (Ogg 1994; Tkáč 1999). Another approach, the so-called metabolite cycling, consists of a selective inversion of the water signal (Giapitzakis 2018). Adding two spectra acquired with and without inversion provides a metabolic profile without the residual water signal – if a perfect inversion is indeed achieved. As illustrated in Figure 9.4, several resonances can overlap (especially at low magnetic fields) and some metabolites such as lactate, GABA, or glutathione are hard to detect and quantify in a rigorous way. For these metabolites, it is recommended to use spectral-editing sequences or J-difference editing (Mescher 1998; Harris 2017). Let us consider an AB spin system with a J-coupling term JAB. Due to this coupling, after a spin-echo, the resonances exhibit a phase ? = ??AB??. If ?? = 1/?AB, then ? = ?. Spectral editing consists of canceling out this phase for spin B via a selective inversion of the transverse magnetization of spin A at TE/4 and 3TE/4 (Figure 9.7). Since these inversions are neutral for non-coupled spins (except for spins resonating at the frequency of spin A), subtracting two spectra with and without inversion provides a visualization of the resonances of spin B without the interference of the resonances of non-coupled spins. Figure 9.7. Schematics of the spectral editing method MEGA-SE (A). The two selective inversions of spins A (in orange, at the frequency vA) refocuse the phase of spins B (in blue, at the frequency vB) due to the JAB coupling. By repeating the measurement without the frequency-selective inversions and subtracting the two spectra (B), the resonance spectra of spins B are better resolved (C) than previously, when they were masked by the signal of non-coupled spins (singlet in gray) A critical condition for acquiring high-quality spectra is the generation of a uniform B0 field in the spectroscopic voxel. The homogenization (or shimming) of the B0 field is performed by adjusting the currents in the so-called shim coils that generate magnetic fields following spherical harmonic functions of the first and second order (Gruetter and Tkáč 2000). The shimming efficacy can be verified by measuring the full width at half maximum of the water peak ∆?1/2 = The chemical shift displacement error originates from the fact that for two resonances separated by δ, their signals originate from two different planes. This distance between those two planes is proportional to δ/BWRF, with BWRF the bandwidth of the spatially selective pulse. In the case of an MRS sequence with several spatially selective pulses, these co-localization errors accumulate and can hinder the interpretation of the spectrum. It is therefore advisable to apply RF pulses with a large bandwidth and to use an operating frequency at the center of the frequency range or at the frequency of the investigated metabolite (rather than the water frequency). The main objective of analyses of spectra acquired in vivo (Figure 9.8) is to detect the metabolites in the sample and “quantify” their concentrations. Before proceeding with the quantification step, it is often useful to “prepare” the signals. Acquired spectroscopy data cannot elude practical imperfections such as eddy currents, frequency drifts or subject motion. Before the quantification step, the preliminary step that will improve the quantification and the quality of the spectra (width at half maximum, signal-to-noise ratio [SNR]) is called the signal preprocessing step. The main preprocessing aspects are described below. Figure 9.8. Overview of the steps and concepts for the analysis of in vivo NMR spectroscopy signals leading to the determination of metabolite concentrations The complex spectra obtained from the acquisition chain need to be “re-phased” to observe and analyze their real part (see section 9.2.1) that corresponds to the absorption spectrum. Conventionally, a spectrum is said to be phased when the lines (especially for singlets) of its real part are all positive (Figure 9.9(Ai)). For multiplets, some resonances can be negative because of the scalar coupling (Figure 9.7(B)). The phases to be corrected (-?c) have multiple causes: phase difference between transmission and reception, unbalanced delays in the sequence, imperfections in the digitization of the RF pulses, digital-to-analog conversion, differences between RF coil elements and different cable lengths. These result in two phase terms: zero-order and first-order phases that can be corrected either manually or automatically. When the signals are acquired, residual eddy currents (see section 1.5.2.1) and non-uniformities of the magnetic field distort the envelope of the NMR signal’s decay over time. In the frequency domain, this manifests as an alteration of the lines, which ideally should be Lorentzian (see section 9.2.1 and Figure 9.9(Aii)). The distortions due to eddy currents can be reduced or corrected in a preprocessing step. Supposing that these distortions are identical for all the resonance lines, it is possible to estimate the deformation of a reference signal, such as the water signal (spectrum without water suppression), and to correct the metabolites signal by applying an opposite phase modulation (De Graaf 1990). Frequency drifts are often observed during an acquisition: this phenomenon corresponds to a gradual change of the B0 field due to the warm-up of the ferromagnetic components providing passive shimming, or to the temperature variation in the sample. To correct this drift, frequency variations can be determined for all the spectra before averaging, by following a reference peak (water, or a major resonance component such as creatine), or by estimating the frequency shift of the complex signal in the time domain, which is then applied for each signal. When the magnetic field has a good uniformity, water suppression during the acquisition is effective. This is often the case for SVS acquisitions, but it cannot be guaranteed for CSI scans. The most effective and used methods for suppressing the residual water peak in post-acquisition are those based on singular value decomposition (SVD). These methods are based on linear algebra properties, with the most known being those based on the linear prediction method and those employing a state space model with SVD of a Hankel matrix (HSVD, HLSVD) as used in automatic control and identification. The Hankel matrix is obtained by positioning each signal sample in such a way that all the values are constant along ascending diagonals. The sequence of signal samples is described by a simple model in terms of complex amplitudes ( Figure 9.9. (A) Examples of (i) a phased spectrum and (ii) a spectrum affected by eddy currents. (B) (i) Spectrum affected by a zero-order phase; (ii) example of water suppression, after decomposition of the signal via HLSVD: below, a spectrum with water residual; in the middle, the components modeling the water residual via HLSVD; above, spectrum after removing the water components At zero (or very short) echo time, the area under the curve of the real part of a phased spectrum is proportional to the number of spins contributing to this signal, and therefore, for a given volume element, to the concentration of the corresponding molecule or chemical group. The main quantification operation consists of determining the relative proportions of the spectral components originating from different chemical groups or molecules, which are characterized by their chemical shifts. When the spectra are sufficiently resolved as in high-resolution NMR, the measurement of the area under the curve of the resonance peaks can be done via a simple integral. This approach is increasingly difficult to implement in vivo due to the variable uniformity conditions of the magnetic field that broaden the lines and the spectral overlap that impedes distinguishing neighboring resonances. The acquired signal is usually described by a parametric function and the quantification methods consist of determining these parameters. These methods perform this correction in the time or frequency domains and may or may not require a model function and a priori knowledge from the user. Once a mathematical model (i.e. a model function) is adopted for describing a spectroscopic signal, the implemented quantification algorithms consist of determining the unknown parameters of the model function. Most methods proposed in the literature are based on the minimization of the distance between acquired (or preprocessed) data and a mathematical model to determine the optimal parameters. Depending on the complexity of the spectrum to be analyzed, different models can be employed: The models above are expressed in the time domain, but when an analytical expression is available they can also be written in the frequency domain (e.g. In the case of signals acquired at short echo times, the recommended model is a weighted sum of simulated or acquired in vitro metabolite spectra. An example of the model function used in the LCModel method (Provencher 1993), which is the most widely used quantification method in the community, performing the minimization in the frequency domain, is the following: ?j corresponds to a B-spline modeling of the baseline, ?0 and ?1 are the adjustable phases of the zero and first order, ?l is the parameter of the metabolites proportion (directly related to the concentration), ?k is the convolution with an arbitrary line shape that has to be determined, γl are the frequency shifts, ?l is the line broadening due to shorter ?2 or ?2*. In this case, the ?M signals of ?l metabolites are known and considered as a priori knowledge. They can be obtained from in vitro measurements or simulations based on required quantum mechanics (see section 9.3.2.2). The model functions can be more or less complex. The more parameters have to be estimated, the more probability there is that these parameters are correlated among each other: the optimization algorithm will then have to restrict the parameter search to allowed intervals of values and/or penalize the minimization. Several solutions have been proposed and have been reviewed by the community (https://mrshub.org/). The minimization of the distance between the function model and the acquired data is most commonly solved using iterative algorithms such as Gauss–Newton or Levenberg–Marquardt, but these methods tend to fall into local minima and a way to avoid this pitfall is to reiterate the optimization process with varying initial parameters. In a more marginal way, Bayesian approaches have been proposed and provide a global optimization of the problem. They are based on Markov chain Monte Carlo (MCMC) methods and the Metropolis–Hasting algorithm. The metabolite spectra used as a priori knowledge and the decomposition basis of the NMR spectrum are obtained either experimentally or via numerical simulations. While it can be complicated to acquire experimental spectra (which involves the preparation of dedicated test objects, control of physicochemical parameters, etc.), it is often preferable to calculate the spectra of each metabolite by simulating the corresponding spins system and its evolution during the considered NMR sequence. For this purpose, the formalism of the “density operator” is used by many free simulation programs (e.g. Spinach, (py)GAMMA, SIMPSON). Without going into the details of the required quantum mechanical considerations, the density operator, or density matrix, is a mathematical object defined by John von Neumann in 1927 that combines all the statistically possible quantum states in a single matrix. This formalism links the statistical approach with the quantum one. It gives access to all the average macroscopic values of a given observable. The time evolution of the density operator is described by Liouville–von Neuman’s equation. This equation is equivalent to Schrödinger’s equation of wave functions:
9
In Vivo MR Spectroscopy and Metabolic Imaging
9.1. Introduction
9.2. In vivo MR spectroscopy


9.2.1. Free induction decay signal


 can be considered.
9.2.2. Chemical shift and dipolar coupling

9.2.2.1. Electron shielding and shielding constant
 .
.
9.2.2.2. Spin–spin coupling

 ≈ |?A − ?B| for ? ≪ |?A − ?B|

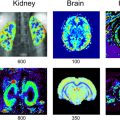
9.2.3. Metabolites investigated in MRS
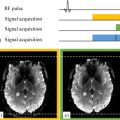
9.2.4. Principle of signal localization
9.2.4.1. Single voxel spectroscopy

9.2.4.2. Chemical shift imaging


9.2.5. Signal editing, suppression and inversion
9.2.5.1. Water signal suppression – metabolic cycling
9.2.5.2. Spectral editing

9.2.6. Experimental considerations in MRS
9.2.6.1. B0 shimming
 + ?Δ?0. Ideally, ∆?1/2 should be of the order of 0.04 ppm, which yields thin and high-intensity spectral lines.
9.2.6.2. Chemical shift artifact
9.3. Processing and quantification of MRS signals
9.3.1. Good practices for preprocessing MRS/CSI data

9.3.1.1. Correction of zero- and first-order phase
9.3.1.2. Eddy-current correction
9.3.1.3. Correction of the frequency drift
9.3.1.4. A posteriori suppression of water residual
 = ?k??? ??k) and poles (?k = ???(−?k + ?2??k)?e) of the signal according to the expression
  , ? = 0, …, ? − 1. The SVD of the Hankel matrix enables the determination of complex poles and amplitudes of the expression ŷ?. This is a purely mathematical description and the signal energy distribution by components does not necessarily represent the distribution by metabolites (Figure 9.4). To suppress the residual water signal, thanks to the mathematical model of the signal in an interval [ν1; ν2] centered at the water signal, the corresponding components are subtracted from the spectrum (Figure 9.9(Bi, Bii)).

9.3.2. Quantification method
9.3.2.1. Model function
 ;
;
 ;
;
 , for Lorentzian lines). In each case, the signal is described as a sum of ?p resonances with an amplitude ?k (proportional to the area under the curve in the frequency domain), and characterized by their frequencies ?k (chemical shift), relative phases ?k and damping factors ?k (Lorentzian case) or ?k (Gaussian case). The latter two are related to the effective transverse relaxation time T2* and to the non-uniformities of the static field (see section 9.2.6.2). These descriptions are useful whenever the acquired spectrum presents lines that are simple or easy to model, such as in 1H spectroscopy with long echo times (TE = 144 ms), 31P (Figure 9.14), or 13C spectra (Figure 9.15).

9.3.2.2. Generation of the decomposition basis

Related posts:
Stay updated, free articles. Join our Telegram channel

Full access? Get Clinical Tree


