6 Inflammatory Disorders of the Spine and Spinal Canal
Contents
Inflammatory Disorders of the Spine
Infectious Spondylodiskitis and Spondylitis
Spondylodiskitis (Andersson Lesion)
Intervertebral Disk Calcification
Inflammatory Disorders of the Spinal Canal
Radiation Myelopathy and Myelitis
Myelopathy Associated with HIV Infection and AIDS
Myelitis in Systemic Lupus Erythematosus
Intraspinal and Intramedullary Sarcoidosis
Spinal Arachnoiditis and Arachnopathy
Inflammatory Disorders of the Spine
MRI diagnostics of inflammatory disorders of the spine and the spinal cord provide verification of location and extent of such lesions and, together with clinical and laboratory findings, allow a differential-diagnostic assessment.
Infectious Spondylodiskitis and Spondylitis
Pathogenesis
Inflammatory disorders of the spine can manifest themselves in the form of a diskitis, spondylitis, or spondylodiskitis. Inflammation may develop in the following ways:
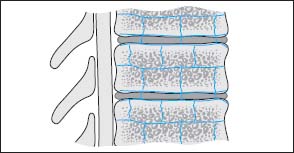
Fig. 6.1 Arterial supply of a vertebral segment with corresponding intervertebral disk. The illustration shows the paired segmental arteries, which course in the middle of the vertebral body in an anterior to dorsal direction and reach the posterior aspect of the vertebra via the intervertebral foramen. These vessels are accompanied by others coursing from proximal to distal, parallel to the end plates, which are interconnected via collaterals and also communicate all around with the next higher or lower vertebra. These collateral vessels thus span the disk and give off several small nutrient vessels to the vertebral body.
• by the hematogenous route (arterial or venous),
• from direct inoculation with pathogens (e.g. during disk surgery or from a penetrating injury),
• by contiguous spread.
Arterial Spread.
By far the most common way is the hematogenous form of development, above all via the arterial vascular system, less often by the venous system. The spread of the inflammation occurs somewhat differently in the adult than in the child because of the differences in arterial vasculature. The intervertebral disk of the child is well vascularized, while the disk of the adult lacks vessels. The blood supply of the vertebral bodies also differs between the child and the adult: the vertebral bodies of the adult has terminal arteries, while in the child there is a marked collateral supply in the region of vertebral body and intervertebral disk. The vascular supply in the adult is via paired segmental arteries which course in the middle of the vertebral body in an anterior to dorsal direction and reach the posterior aspect of the vertebra via the intervertebral foramen. They penetrate the vertebral body via the nutrient foramen. These vessels are accompanied by others coursing from proximal to distal, parallel to the end plates, which are interconnected via collaterals and also communicate all around with the next higher or lower vertebra. These collateral vessels thus span the disk and give off several small nutrient vessels to the vertebral body (Fig. 6.1).
Branches from the paired segmental arteries also supply the dorsal vertebral elements and the paraspinal muscles. In the child there are additional collaterals between the intraosseous vessel (nutrient artery) and the paired subchondral extraosseous vessels, which have degenerated by adulthood. There are terminal arteries present in the disk of the neonate that degenerate over the years.
This explains why an isolated diskitis secondary to hematogenous spread is mainly diagnosed in children rather than a spondylitis, even though a concomitant infection of the bone may also be present (Milone et al., 1962; Lascari et al., 1967; Spiegel et al., 1972; Bonfiglio et al., 1973). A diskitis spread by the hematogenous route with secondary invasion of the vertebral bodies also occurs, albeit rarely, in adulthood (Kemp et al., 1973). The mechanism by which an inflammation in the disk and the adjacent vertebral bodies develops is based on the fact that the arterial supply of the disk does not completely degenerate in childhood, but vessels still persist in the disk in a rudimentary form (Smith, 1931; Coventry et al., 1945).
Normally the route of spread in adults is as follows:
• bacterial seeding into the vertebral bodies,
• extension of the inflammatory process on to the adjacent intervertebral disk,
• involvement of the adjacent vertebral body,
• extension on to paravertebral structures, possibly following an epidural to intradural direction.
Over 90 % of infections involve both disk and adjacent vertebral bodies by the time they are diagnosed. Rarely is an isolated spondylitis found.
Bacterial seeding into the vertebral bodies usually occurs from an anterobasal location, i.e. in the region that is regarded as the endpoint of vascular branching. First, a circumscribed infarction develops in the bone secondary to the intraosseous infection. From this focus the inflammation tracks subligamentously and rapidly encroaches on the adjacent structures. Hematogenous spondylodiskitis most commonly affects older patients. There is a predilection for involvement of the lumbar spine.
Venous Spread
A spondylodiskitis can, in rare cases, develop via the venous vascular system (Batson, 1940, 1957; Sherman, 1955; Lame, 1956). The valveless veins emerging from the dorsal aspect of the vertebral body receive their blood from the vertebral periphery and relay it to the epidural venous plexus in the spinal canal, which has connections to the paravertebral venous plexus. Furthermore, the intraosseous veins also have a direct connection with the paravertebral venous plexus via perforating vessels. Since the direction of flow in the valveless paravertebral veins is strongly dependent on intra-abdominal pressure, bacterial spread resulting from reversal of flow is also conceivable. Inflammatory processes in the intestinal tact, the urinary tract collecting system, and the prostrate or gynecological organs can be regarded in this context as potential initial sites for a spondylodiskitis.
Direct inoculation with Pathogens
Direct inoculation with pathogens occurs, for example, iatrogenically or via penetrating injuries. Iatrogenically induced inflammations can develop from:
• puncture of the spinal canal, the vertebral bodies and the paravertebral space,
• surgery of the disk interspace or the spinal canal.
In rare cases a spondylodiskitis can result from penetrating injuries. The most common injuries in this context are gunshot wounds.
Inflammation by Contiguous Spread
The propagation of inflammation by contiguous spread takes its origin from an infectious focus near the spine.
Pathogens
About 80 % of all cases of spondylodiskitis are caused by Staphylococcus aureus. Other gram-positive (streptococci, pneumococci) or gram-negative (Escherichia coli, Salmonella, Pseudomonas) bacilli are found less commonly. Infections by fungi are an exception. Tuberculous infection has become less common.
Infection from Staphylococcus aureus is promoted by the fact that this bacterium has its own proteolytic enzyme, which causes lysis of the structural fibers of the annulus fibrosus and thus contributes in facilitating bacterial spread.
Disease Course
In the case of a bacterial spondylodiskitis, a concomitant involvement of the disk with a corresponding loss of disk-space height typically develops very early (about 1–3 weeks after the onset of the infection) from the spondylitic focus in the bone marrow. During the further course, the infection spreads to the immediately adjacent vertebral body and only later on is there destruction of the cortices of the vertebral body with paravertebral exudation and the development of granulation tissue. Relatively seldom does an epidural abscess develop as a result.
Bacterial Spondylodiskitis
Diagnostics
MRI
Spondylodiskitis is diagnosed at MRI by a pattern of findings that is encountered in more than 90 % of all cases and therefore usually allows a secure diagnosis:
• A clear, usually homogeneous reduction in signal intensity of the vertebral body or bodies is displayed on T1-weighted images. The difference in contrast between vertebral body and disk can be lacking, particularly in older patients who regularly display slightly higher bone-marrow signal intensity than disk signal, so that the inflammatory segment reveals a uniformly low signal.
• The contours of the end plates lying within the inflammation are lost or to a large extent disrupted, with the disruption being most pronounced ventrally.
• On T2-weighted images a signal enhancement of the intervertebral disk is seen, displaying higher signal intensity than the healthy disks. The intranuclear cleft is lost. In addition, signal enhancement of those vertebral bodies affected by the inflammation may become apparent.
• After contrast application (depending on the extent of inflammation) a clear contrast enhancement is visible in the inflammatory region, including the disk.
These MRI criteria can be regarded as reliable and hold good for over 90 % of all patients. Apart from these there are also less reliable criteria available:
• In about 50 % of all patients, additional signal changes of the disk are seen on T1-weighted images in the form of a reduction in signal intensity.
• In less than 50 % of cases, the following combined signal changes are found:
– a reduction in signal intensity of disk and vertebral body on T1-weighted images and a signal enhancement of disk and vertebral body on T2-weighted images (Hosten et al., 1995; Dagirmanjian et al., 1996; Wikstroem et al., 1997).
Additional signs are:
• disk space narrowing,
• paravertebral exudate,
• epidural abscess.
Examination technique
STIR sequences have particularly proven themselves for detecting edema. The STIR sequence provides the highest contrast between pathological tissue and adjacent normal bone marrow. The following are recommended for clarifying infectious spondylitis with the aid of MRI:
• T1-weighted images before and after contrast application,
• T2 sequences,
• STIR sequences (Thrush et al., 1990).
Contrast images are particularly helpful for:
• separation of paraspinal abscess from the dural sac,
• differentiation of inflammatory active elements from elements inactive after medicinal treatment.
Post et al. (1990) point out that, after application of Gd-DTPA, T1-weighted images are more sensitive in detecting changes relating to diskitis than T2-weighted images. They describe the following pattern of findings for contrast enhancement of inflammatory changes of the disk:
• band-like, broad enhancement of the disk margin,
• thin, contrast-enhancing rim,
• contrast-filling of practically the entire disk space, comparable in its extension to the signal enhancement on T2-weighted representations,
• patchy contrast enhancement in different, noncontiguous, elements of the disk material,
• fine linear contrasting in the periphery of the disk.
The osteomyelitic components are better demonstrated on plain T1-weighted images than after application of Gd-DTPA because the intensity of contrast enhancement seen in inflammatory and normal bone marrow is similar (Post et al., 1990) (Figs. 6.2–6.11).
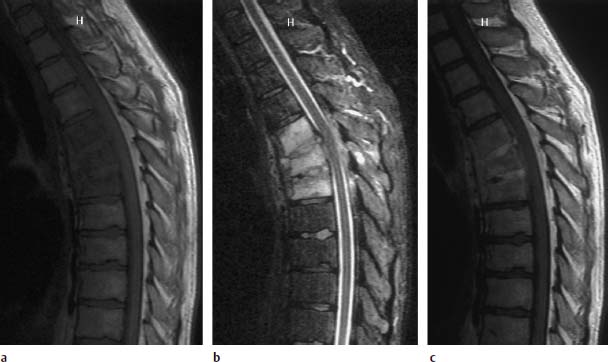
Fig. 6.2a—c Acute spondylodiskitis of the thoracic vertebrae 4–6:
a T1-weighted sagittal image (TR = 800 ms, TE = 12 ms): Very homogeneous reduction in signal intensity of vertebrae 4–6, with the signal of the vertebrae appearing slightly lower than that of the intervertebral disk. The vertebral end plates are no longer demarcated. The vertebrae have lost somewhat in height, particularly anteriorly. Paravertebral abscess with displacement of the anterior longitudinal ligament.
b T2-weighted sagittal image (STIR sequence): Marked signal enhancement of the affected intervertebral disks, including the disk spaces.
c Sagittal image after contrast application: Clear enhancement of the disks, slight enhancement of the vertebral bodies, and contrast uptake along the paravertebral abscess.
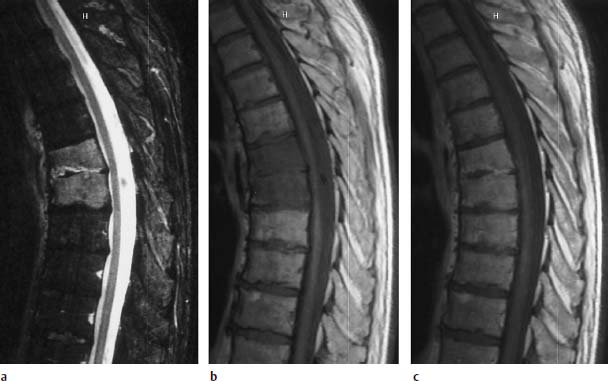
Fig. 6.3a—c Spondylodiskitis at the T6/7 level :
a T2-weighted sagittal image (STIR sequence): Very clear homogeneous signal enhancement in both vertebral bodies and in the disk space.
b T1-weighted plain image (TSE; TR = 800 ms, TE = 12 ms): Clear reduction in signal of both vertebral bodies so that the difference in contrast between disk signal and bone signal appears lost.
c Sagittal image after contrast application: The contrast of the vertebral bodies is brought into line with that of the healthy sections. Band-like contrast enhancement in the disk reflecting the florid inflammatory reaction.
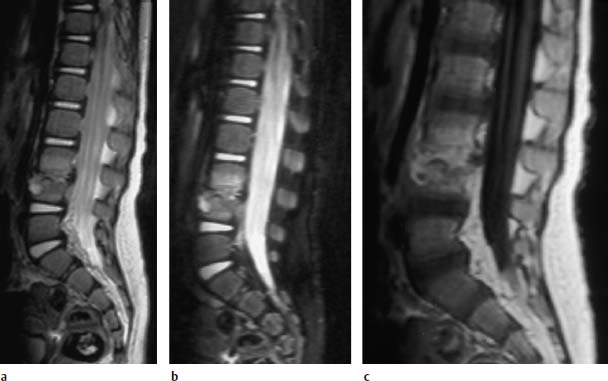
Fig.6.4a—c Spondylodiskitis at the level L3/L4. 15-month-old child:
a T2-weighted sagittal image (TSE; TR = 6000 ms, TE = 120 ms): Slight signal enhancement in the two corresponding vertebral bodies, reduced signal intensity in the disk space. Epidural abscess formation. Circumscribed, hyperintense core in the anterior cortex of L4, to be regarded perhaps as the starting point of the inflammation.
b Sagittal STIR sequence: The destruction of the end plates is better displayed on these images. The signal-intense inflammatory core in L4 demonstrates communication with the disk space.
c Sagittal image after contrast application: Strong, diffuse enhancement of both the disk space and the adjacent vertebral bodies.
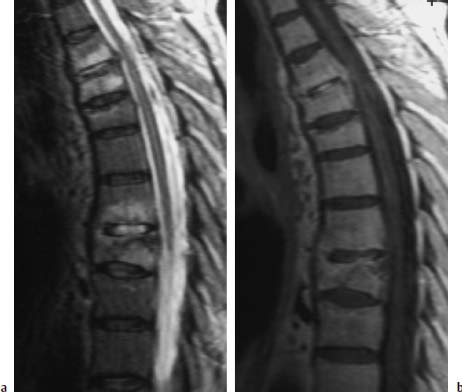
Fig. 6.5a, b Polysegmental spondylodiskitis T3–T9, sparing the disks T5/6 and T6/7.
a T2-weighted sagittal image with evidence of clear signal enhancements of the vertebral bodies and corresponding disks in the segmental region T3–T9.
b Sagittal image after contrast application: Somewhat more marked enhancement of the disk T3/4 and disk T7/8. Slight subchondral contrast uptake in the region of the end plates T5 and T9.
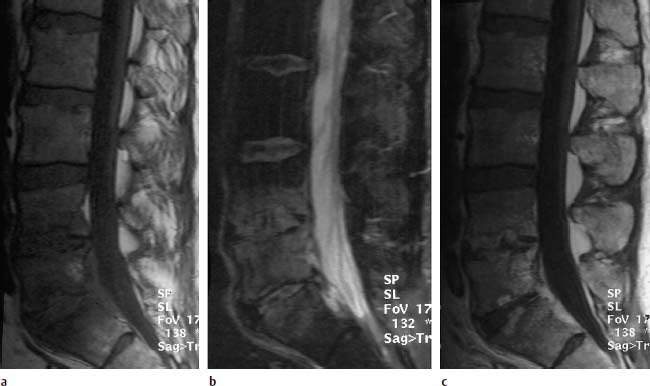
Fig. 6.6a—c Spondylodiskitis of the vertebrae L4–S1:
a T1-weighted sagittal pre-contrast image: Reduced signal intensity of the corresponding vertebral segments L4/L5 and L5/S1 with partial lack of contour delineation of the upper and lower end plates.
b T2-weighted image (STIR): Very clear signal enhancement along the vertebrae L4–S1 with involvement of the disk spaces.
c Sagittal T1-weighted image after contrast application: Patchy enhancement, above all in the disk spaces L4/L5 and L5/S1.
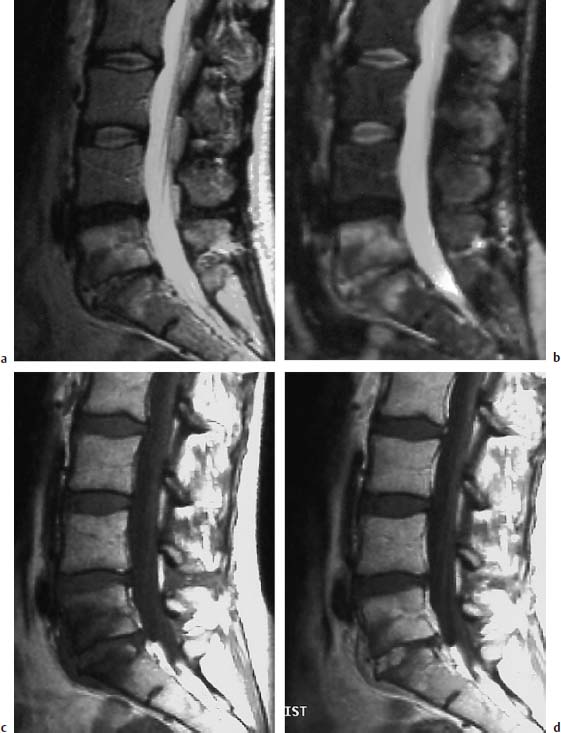
Fig. 6.7a—d Sciatica. 38-year-old female patient examined for recurrent sciatica 4.5 months after surgery for disk herniation at the level L5/S1. Greatly elevated ESR:
a T2-weighted sagittal image: Reduced signal intensity of the L4/L5 disk due to degenerative causes, reduced height of the L5/S1 disk with increased signal intensity due to inflammatory causes, and concomitant finding of a hyperintense marrow edema of L5 and S1.
b T2-weighted sagittal image (STIR sequence): Confirmation of the finding with particularly contrast-rich depiction of the edema of the vertebral body and the signal enhancement in the disk space L5/S1.
c T1-weighted sagittal pre-contrast image: Reduced signal intensity of the vertebral bodies l5 and S1.
d Sagittal T1-weighted image after contrast application: Broad, patchy, ventrally accentuated signal enhancement is apparent within the L5/S1 disk, which displays inflammatory changes. Partial hyperemia of the adjacent vertebral bodies, in part with enhanced signal intensity relative to the healthy segments.
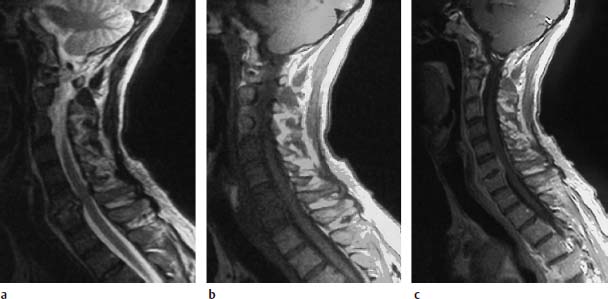
Fig. 6.8a—c Spondylodiskitis with epidural abscess. 58-year-old patient with known diabetes mellitus, cervical pain and slowly progressive tetraparesis:
a Sagittal T2-weighted image: Increased signal intensity of the disk at the level C6/C7. Both vertebral bodies display marrow edema with corresponding signal enhancement.
b Sagittal T1-weighted plain image: The fat signal in the vertebral bodies C4–C7 is reduced.
c Sagittal T1-weighted image after contrast application: This results in an increase of signal intensity, especially in the sixth and seventh cervical vertebra. Dorsal to these two vertebral bodies there is a fringe-like contrast enhancement indicating an epidural abscess formation. The spinal meninges are also thickened at this level, dorsal to the cord. A slight space-occupying effect on the cervical cord takes its origin from this lesion.
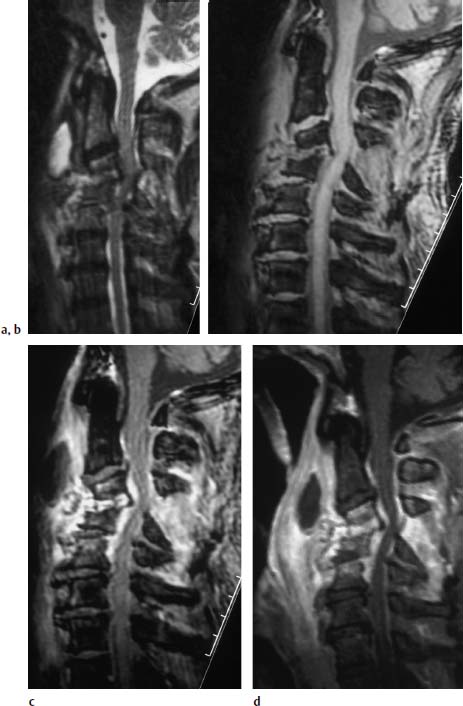
Fig.6.9a—d Spondylodiskitis C3–C5 with subluxed position of C3/C4.
a Sagittal T2-weighted image (TSE; TR = 4600 ms, TE = 112 ms): Signal enhancement in the disk space C3/4 and C4/5 with low-grade reactive edema in the adjacent vertebral bodies. Subluxed position of C3/C4. Widening of the interspinal distance between the spinous processes of C3 and C4, here too associated with signal enhancement. Marked paravertebral exudate with retropharyngeal abscess formation. Increased signal intensity along the spinal meninges. Spinal cord compression secondary to frank degenerative changes with posterior osteophytic spurring.
b Sagittal T1-weighted image (FLASH 2D; TR = 403 ms, TE = 11 ms, flip angle α = 90°): Mild reduction in signal intensity in the disk space C3/C4. Subluxed position in the segmental region C3/C4. Widening of the interspinal distance between the spinous processes of C3 and C4. The slight compression of the spinal cord is also recognizable here.
c Sagittal T2-weighted image after contrast application (FLASH 2D; TR = 403 ms, TE = 11 ms, flip angle α = 90°): Very marked contrast enhancement of the disk space C3/C4 and the prevertebral structures with sparing of the retropharyngeal abscess formation reflecting the cavitating process. The epidural structures also demonstrate contrast enhancement as an indication of the epidural abscess formation with involvement of the meninges. Contrast enhancement furthermore in the dorsal appendant structures, especially between the interspinal processes C2/C3, C3/C4, and C4/C5.
d Image after contrast application (SE; TR = 572 ms, TE = 12 ms, with fat saturation): The compression of the spinal cord is more clearly recognizable on this image. There is in addition a better demarcation of the meningeal reaction, both ventrally and dorsally along the spinal canal. The massive retropharyngeal abscess formation with a marked long-segment phlegmonous reaction along the anterior contour of the cervical spine is well delineated.
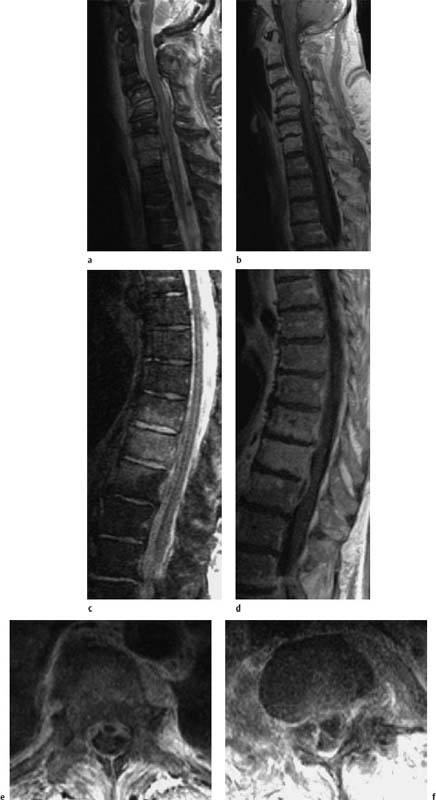
Fig. 6.10a—d Polysegmental acute spondylodiskitis in the cervical and thoracic spine.79-year-old diabetic. Clinical presentation of a rapidly progressive paraparesis.
a Sagittal T2-weighted image of the cervical spine region: Evidence of spondylodiskitis of the segments C4/C5 and C7/T1. There is a correspondingly clear signal enhancement of both the vertebral bodies and the disks. Clearly recognizable structural instability in this section. Evidence of a prevertebral exudation with elevation of the anterior longitudinal ligament in the C4–C6 section and circumscribed at C7/T1. Mild prevertebral reactive edema.
b Sagittal T1-weighted image after contrast application: Mild enhancement of the vertebral bodies, especially at C4/C5 and to a slight degree in the dorsal area of the disk of this segment.
c Sagittal T2-weighted image: Evidence of spondylodiskitis of the thoracic vertebrae 9–11. A corresponding, relatively homogeneous signal enhancement is visible in T10 and an adjacent, marginal enhancement of the ninth and eleventh thoracic vertebrae. The T9/T10 and T10/ T11 disks display signal enhancement.
d Sagittal T1-weighted image after contrast application: The associated epidural abscess at the level of the segments T9/T10 and T10/T11 are well delineated on these images. There is a corresponding enhancement of the abscess membrane. In addition, there is a mild contrast enhancement of the ninth and eleventh vertebrae as well as a strong, homogeneous enhancement of the tenth thoracic vertebra.
e Corresponding transverse image after contrast application: The epidural abscess formation and the additional paravertebral abscess are well delineated on this image.
f Transverse image through the level of the abscess after contrast application: This image shows division of the ventrally located epidural abscess by the Trolard membrane (curtain sign).
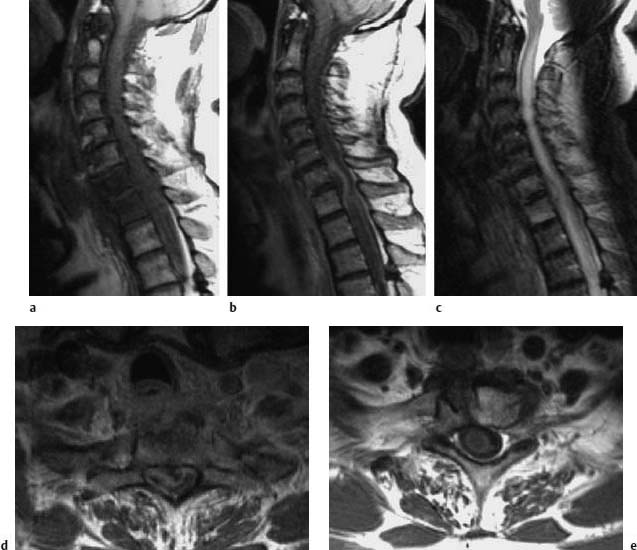
Fig. 6.11 a—e Spondylodiskitis of C7–T1 with extensive epidural abscess. The 54-year-old patient had suffered a perforating injury to the esophagus two weeks previously. Subsequently there was a subacute development of a progressive paresis of the lower extremities:
a Sagittal T1-weighted plain image: Edema of the vertebral bodies C7 and T1.
b Image after contrast application: Demarcation of an extensive compressive epidural abscess.
c Sagittal T2-weighted image: Bone marrow edema at C7 and T1. The compression of the spinal cord by the abscess results in a considerable long-segment edema of the cord, which extends from C2 into the segments of the thoracic spine.
d Transverse section after contrast application: The image shows an extensive space-occupying effect by the epidural abscess with corresponding marked compression of the spinal cord.
e After surgical revision of the abscess, the postoperative T1-weighted image after contrast application displays complete regression of the space-occupying effect. The spinal cord edema is still recognizable by the reduction in signal intensity.
During the healing of spondylodiskitis, a regression of the strong signal reduction on the T1-weighted images, as well as of the signal enhancement on the T2-weighted images, is observed. Instead, patchy and, as the disease progresses, increasingly confluent signal enhancements of the bone marrow are found on T1-weighted plain images, indicating fatty marrow formation. A persistent reduction in signal reflecting sclerosis, as well as a slight signal enhancement due to the formation of fatty marrow, can develop on T2-weighted images. The intervertebral disk displays low signal intensity after a healed spondylodiskitis due to scar formation. After contrast application a reduced, partly mottled, signal enhancement develops, which is totally absent later in the development of the disease. Over a period of several months and years osteophytic bridging is seen and is an indication of the subsequent fusion of the segment (Figs. 6.12 and 6.13).
a Sagittal image: Evidence of a clear signal enhancement in the disk space L5/S1 and a corresponding reaction in the vertebral segments.
b Examination 1.5 months later: Slightly regressive edema of the intervertebral disk. Strong reactive edema still present in the adjacent vertebral segments.
c Examination 4 months after the initial scan: Further regression of the edema of the intervertebral disk. Strong edema still present in the adjacent vertebral segments.
d Examination 1 year after the initial scan: Complete involution of the disk material, mild marginal signal enhancement still present in the vertebral segments.
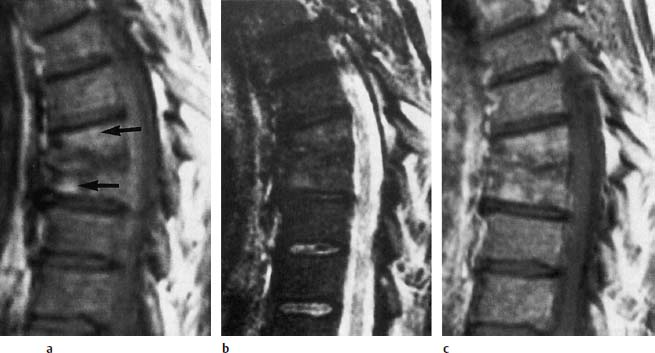
Fig.6.13a—c Largely healed spondylodiskitis that was followed-up over 1 year:
a T1-weighted image (SE; TR = 780 ms, TE = 25 ms): Destruction of the inferior and superior end plates of T7 and T8 with loss of disk space height. No larger reduction of signal intensity of the bone marrow. Individual segments of fatty marrow (arrows).
b T2-weighted image (SE; TR = 2100 ms, TE = 80 ms): Uniform reduction in signal intensity. Individual zones of slightly increased signal intensity corresponding to fatty marrow.
c After contrast application (SE; TR = 750 ms, TE = 25 ms): Mottled, stippled signal enhancement of the bone marrow without any larger area of contrast enhancement.
Tuberculous Spondylodiskitis
Tuberculous spondylodiskitis demonstrates some special features in comparison to nonspecific inflammations, although in individual cases differentiation is only possible by identification of the organism.
Location
In contrast to nonspecific spondylodiskitis, tuberculous spondylodiskitis is most commonly found at a thoracic location, followed by lumbar and cervical ones.
Pathogenesis and Spread
Tuberculous spondylodiskitis typically demonstrates a slow insidious onset and it can take months before changes are detectable on plain radiographs. In about 80 % of all cases, tuberculous spondylodiskitis is not associated with an affection of the lungs, nor even succeeds it, making the diagnosis even more difficult.
The inflammation usually originates in the ventral third of the vertebral body near the end plate. A typical finding is circumscribed areas of subchondral erosion. A mere spondylitis, without involvement of the disk, is more often encountered than with a pyogenic inflammation. This is because, unlike Staphylococcus aureus, mycobacteria lack proteolytic enzymes.
Tuberculous spondylodiskitis is rarely limited to the posterior structures of the vertebrae, without involvement of the vertebral body or the disk.
If the posterior longitudinal ligament remains intact, tuberculous spondylodiskitis spreads through several segments, although individual vertebral bodies can be skipped. Polysegmental spread is also possible by the hematogenous route.
Tuberculous spondylodiskitis often results in marked collapse of the vertebral bodies. In many cases this vertebral collapse is associated with a reactive gibbus deformity of the spine. A typical feature is this respect is telescoping, where the entire vertebral body, including the disk, collapses into the next higher or next lower vertebra, although the disk can remain more or less intact.
Differential Diagnosis
Due to the often-marked abscess formation associated with tuberculosis, the application of contrast can result in mere marginal enhancement of the inflammatory area instead of a homogeneous distribution. This marginal enhancement is sometimes also encountered within the vertebral body. It defines the region of the intraosseous abscess.
In contrast to bacterial spondylitis, the adjacent disk material is less damaged or is completely spared from the inflammatory changes. Similarly, signal enhancement of the disk on the T2-weighted image is often lacking on the MRI presentation of tuberculous spondylitis.
The following features are helpful in differentiating tuberculous from bacterial spondylitis.
Tuberculous spondylitis:
• expansion into the paraspinal soft tissue is much more strongly developed,
• duration of symptoms is longer (months to years),
• the patient is of a younger age (Smith et al., 1990),
• tuberculous abscesses demonstrate calcifications in a higher percentage of cases, although they are often not detectable on the MR image.
Follow-up studies of tuberculous spondylodiskitis reveal, on the T1-weighted sequences of some of the patients, an increase in signal intensity of those vertebral elements previously damaged by the infection. Smith et al. (1990) assume that ischemic or inflammatory effects promote the conversion of hematopoietic bone marrow into fatty marrow.
Differential diagnostic considerations for spondylitis must include erosive osteochondrosis (Staebler et al., 1998) and, particularly in the case of tuberculous spondylitis, metastatic spread to the vertebrae (Thrush et al., 1990) (Figs. 6.14 and 6.15).
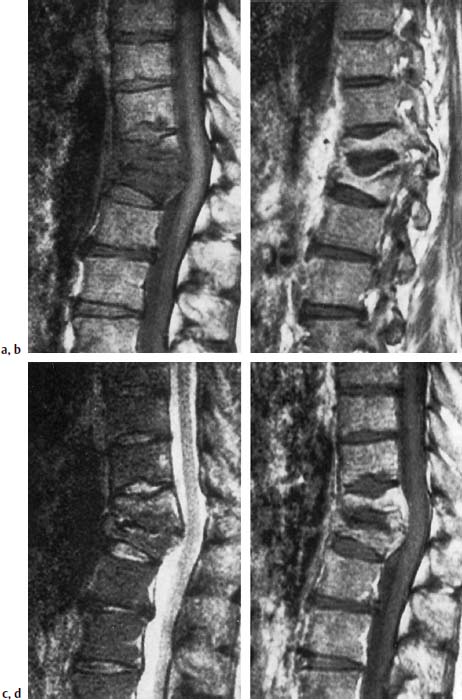
Fig. 6.14a—d Tuberculous spondylodiskitis T11/T12. 46-year-old patient with pulmonary tuberculosis.
a Sagittal T1-weighted image (SE; TR = 785 ms, TE = 25 ms): Reduced signal intensity of the vertebral bodies T11/T12 with reduction in height and signal loss of the vertebral contours, resulting in lack of demarcation of the disk.
b In the section further laterally, evidence of a prolapse of the largely preserved disk into the adjacent vertebral body.
c T2-weighted image: Slight signal enhancement of the vertebral bodies, especially of T11. No signal enhancement of the disk.
d T1-weighted image after contrast application: Enhancement predominantly in the regions of increased signal intensity. Signal void corresponding to the intervertebral disk.
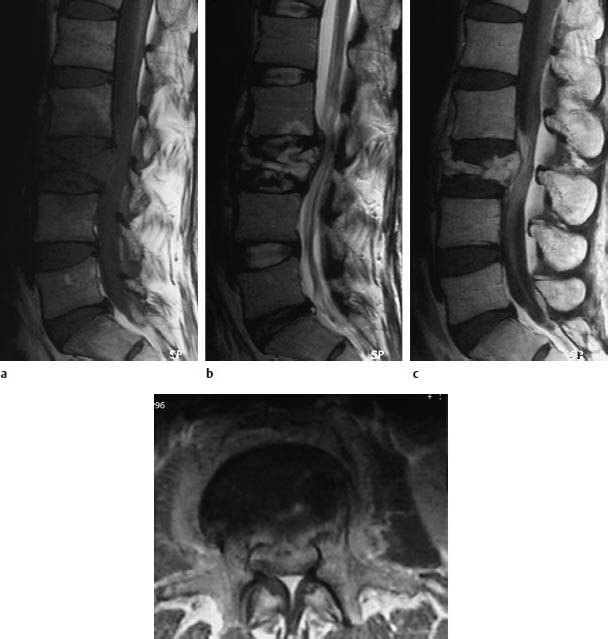
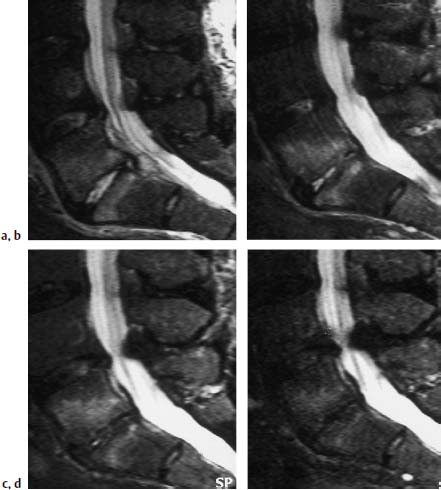
Fig. 6.15a—d Tuberculous spondylodiskitis at the level L2/3. 38-year-old patient:
a Sagittal T1-weighted image (TSE; TR = 800 ms, TE = 12 ms): More or less complete collapse of L3 with homogeneous reduction in signal intensity. Focal reduction in signal intensity in L2, dorsally, with a hint of interruption in the contour of the inferior end plate.
b Sagittal T2-weighted image (TSE; TR = 4000 ms, TE = 120 ms): Mottled inhomogeneous signal enhancement of L3 and marginal signal enhancement within the focus in L2.
c Sagittal image after contrast application: Marked enhancement both of the bone and paravertebral segments, initial development of an epidural abscess. Slight enhancement of the roots of the cauda equina as a sign of an incipient inflammation of the cauda. Marked elevation of the anterior longitudinal ligament in the region of L2 and L3 secondary to the inflammatory reaction.
d Transverse image after contrast application (SE; TR = 700 ms, TE = 15 ms): Contrast enhancement of the paravertebral structures with involvement of the psoas region on both sides. The epidural abscess formation is clearly recognizable.
Spondylitis, without involvement of the intervertebral disk, displays the same changes with respect to the bone as does spondylodiskitis. The acute stage reveals a reduction in signal intensity within the bone on the T1-weighted plain image and a more or less marked signal enhancement after contrast application. Nonspecific signal enhancement is seen on the T2-weighted image (Shanley, 1995).
Rheumatoid arthritis
Incidence and etiology
Rheumatoid arthritis (RA; chronic polyarthritis [CP]) is the most common systemic disease of the connective tissue. It primarily affects women, the male to female sex ratio being 3:1. The exact etiology of rheumatoid arthritis is not known. Autoimmune mechanisms could possibly play a role in its pathogenesis since up to 70 % of the patients are HLA-DR4 positive.
Location
In rheumatoid arthritis, the thoracic and lumbar spines are only relatively seldom involved. Destruction of the thoracic and lumbar vertebral bodies by rheumatoid granulomas, however, is seen occasionally. Epidural rheumatoid nodules can result in compression of the spinal cord. The facet joints of the mid to lower spine are also only rarely affected. However, damage to the thoracic and lumbar spine can occur secondary to treatment. Ischemic necrosis of the bone commonly results from the administration of steroids, sometimes affecting thoracic and lumbar vertebrae apart from the typical location within the femoral head. Furthermore, the combination of immobilization due to pain plus corticosteroid therapy can lead to marked osteoporosis with subsequent vertebral collapse (Dihlmann, 1987; Resnick and Niwayama, 1988).
The most important and most common vertebral changes associated with rheumatoid arthritis are seen in the cervical spine, particularly in the region of the craniocervical junction. One of the most common findings in rheumatoid arthritis in the region of the cervical spine is C1/C2 subluxation, of which the following forms are distinguished:
• anterior atlantoaxial subluxation,
• cranial subluxation,
• lateral subluxation,
• rotatory subluxation,
• posterior subluxation.
The atlantoaxial subluxation involves a widening of the interval between the anterior atlas arch and the dens axis (anterior atlantodens interval or ADI) by 2.5mm and more. The cranial subluxation results in a basilar impression with a high-riding dens, which can extend far into the foramen. There is concomitant settling of the atlas arch so that it is found in an abnormally low position in relation to C2. The lateral subluxation involves a lateralization of the lateral mass of C1 in relation to C2 by more than 2 mm. The rotatory subluxation demonstrates a unilateral displacement of the atlas in relation to the joint facets of C2. If the anterior atlas arch is dorsal to the dens then this is referred to as a posterior subluxation.
The cause of these changes lies in a laxity or destruction of the atlantoaxial ligamentous structures, especially the transverse ligament, secondary to an inflammatory synovial reaction. In addition, instability of the articular structures develops between the skull base, atlas and axis. An erosion of the dens is also a typical finding and occurs in about 20 % of patients. Synovial proliferation can result in exuberant pannus formation. A distinction is made here between the development of retrodental, predental, supradental and laterodental pannus, with a combination of these types of pannus formation being a common finding. The inflammatory changes can reduce the dens down to a small rudiment. This can result in atlantoaxial subluxation, even in the presence of intact ligamentous structures.
A common result of the pannus reaction and the destruction of the ligamentous and joint structures is compression of the spinal cord at the level of C1 or proximal to it. This compression can be present both in neutral position as well as occurring exclusively during anteflexion of the head. Compression of the spinal cord is particularly common when a combination of atlantoaxial and cranial subluxation is present.
Apart from changes in the region of the atlantoaxial articulation, erosions of the vertebral bodies are observed in rheumatoid arthritis, occurring particularly at the end plates. This results in a reduction in disk space height, which, unlike osteochondrosis, primarily affects the C2–C4 segments and is regarded by some authors as pathognomonic. Erosions of the facet joints is also common and can occur in conjunction with joint space narrowing and articular destruction, even together with ankylosis during late stages.
The erosive changes of the vertebral end plates are often associated with structural instability of the joints so that findings consistent with an anterolisthesis or retrolisthesis are seen, sometimes combined with a marked deformity of the spine. Osteophytes at the vertebral end plates are an uncommon finding, although they can arise in late stages of rheumatoid arthritis and are the result of malposture.
Clinical Presentation
A distinction should be made clinically between local symptoms originating in the affected articular segments and general symptoms. The American Rheumatism Association (ARA) has compiled diagnostic criteria for rheumatoid arthritis (Arnett et al., 1988):
ARA classification criteria for rheumatoid arthritis
 Morning stiffness lasting at least one hour.
 Arthritis of three or more joints.
 Arthritis involving hand or finger joints.
 Symmetric arthritis.
 Rheumatoid nodules.
 Detection of serum rheumatoid factor.
 Typical radiographic changes in hand or finger joints.
The first four criteria must have been present for at least six weeks.
General symptoms that may occur include:
• fatigue,
• sweating,
• arteriitis,
• myo- and pericarditis.
The clinical presentation strongly depends on the extent of joint damage. The patients usually present with pain that can be referred to as being in the region of the neck, as well as temporal or retro-orbital in location. Deeper lying lesions can also cause radiation of the symptoms into the shoulder-arm region. Compression of the cervical cord or the medulla oblongata leads to paresthesia and, in marked cases, to paralysis or even tetraplegia. Compromise of cerebral circulation can arise from compression of the vertebral artery, and compromise of spinal cord circulation from impairment of the spinal artery.
Pathogenesis
The pathogenesis is assumed to be an immune complex reaction resulting in the activation of complement secondary to the deposition of immune complexes in the synovial joint structures. This induces the infiltration of lymphocytes, especially T4 helper cells, which maintains the inflammatory process. B lymphocytes and macrophages are also encountered. In the acute inflammatory exudative phase, numerous inflammatory cells are detected in the synovial fluid. Cartilage destruction is seen primarily near the inflammatory changes of the synovia or near the pannus covering the articular cartilage. This tissue consists of proliferative fibroblasts, small blood vessels and mononuclear cells. Proteinases released from here destroy the cartilage.
Histology
Histology reveals proliferation of the synovial lining cells, which demonstrate a palisade-like arrangement and are covered by a fibrin film. Sometimes enlarged lymph follicles and blood vessels with endothelial proliferation are also present. The appearance of rheumatoid granulomas is a rare occurrence. Apart from synovial proliferation, a similar type of granulation tissue also appears in the subchondral medullary cavity. Once the joint space has been bridged, fibrous ankylosis results from fibrotic alterations of the pannus tissue and may be converted further into a bony ankylosis by metaplastic changes.
Diagnostics
MRI
The most impressive findings are encountered at the atlantoaxial junction, especially when extensive pannus formation is present. This pannus displays a moderate signal intensity that corresponds approximately to that of muscle on T1-weighted images and is well delineated from the higher signal of bone.
On the T2-weighted images the pannus can demonstrate either very high signal intensity or a low one. This depends on the water content and extent of fibrosis. If high water content is present then high signal intensity is found, while fibrosed pannus displays a correspondingly low signal. Erosions of the dens are well depicted, although the smallest punctate erosions escape detection by MRI and are better demonstrated by CT. The transverse ligament is often delineated, especially when it is merely displaced by pannus yet otherwise intact.
The application of contrast has proven itself helpful. Pannus tissue usually shows a strong enhancement, which appears less distinctive when the tissue is very edematous and loose. If the other vertebral bodies also exhibit changes, then they are particularly well delineated on contrast-enhanced images. In this case a mild signal enhancement can be found along the vertebral end plates, extending down to the subchondral region and producing a band of diminished signal intensity (Figs. 6.16–6.24).
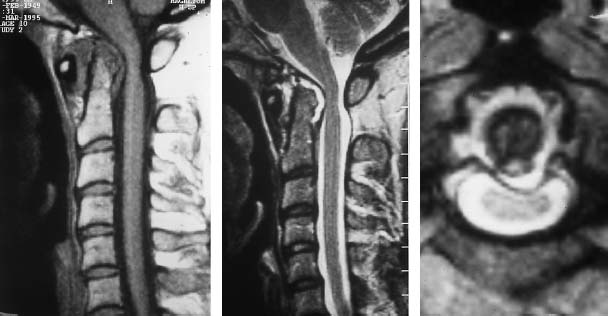
Fig. 6.16a—c Known long-standing rheumatoid arthritis. 46-year-old female patient:
a Sagittal T1-weighted image (SE): The extensive pre- and retrodental pannus tissue displays a moderate signal intensity. The dens axis is included in the destruction with its point showing structural rarefaction. The atlantoaxial distance is widened.
b Sagittal T2-weighted image (SE): The pannus tissue reveals a clear signal enhancement as an expression of the edematous inflammatory reaction. There is a mild compressive effect in the region of the cervical cord. There is no cord edema.
c Transverse section with T2 weighting: The paradental pannus tissue is well delineated, the retrodental component causes a bulging protrusion of the transverse ligament. Thus the spinal cord is reached and is slightly compromised, especially toward the left.
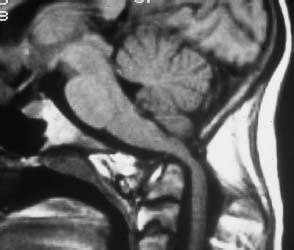
Fig. 6.17 Rheumatoid arthritis. 56-year-old female patient with a very long history of chronic rheumatoid arthritis. Sagittal section with T1 weighting (SE technique): Extensive destruction of the apex of the dens with marked widening of the atlantodental interval. Basilar impression with marked compression of the spinal cord. The cervicomedullary angle (the angle formed by lines drawn parallel to the anterior aspects of the medulla and the upper cervical cord; normal value = and >135°) is reduced.
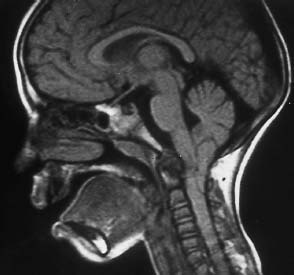
Fig. 6.18 Rheumatoid arthritis and Arnold-Chiari type I malformation. 7-year-old girl. The sagittal section with T1 weighting shows marked reactive pannus at the apex of the dens with extensive destruction. A compressive effect occurs at the level of the medulla. Additional narrowing of the spinal canal as a result of the very low position of the tonsils.
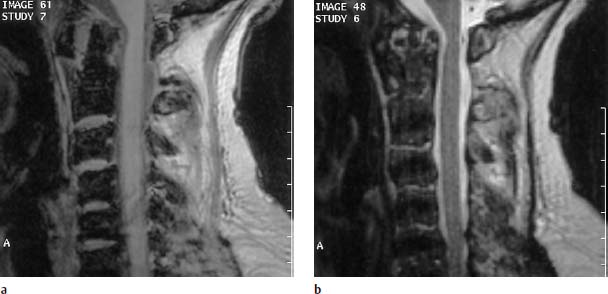
Fig. 6.19a, b Long-standing rheumatoid arthritis. 70-year-old female patient:
a Sagittal T1-weighted image (FLASH 2D; TR = 400 ms, TE = 11 ms, flip angle α = 90°): Partial destruction of the apex of the dens and evidence of marked predental pannus with widening of the atlantoaxial distance. Slight pannus reaction also recognizable at the dorsal margin of the tip of the dens. Slight impression of the spinal cord.
b Sagittal T1-weighted image (TSE; TR = 4600 ms, TE = 112 ms): The pannus displays a largely reduced signal intensity as a sign of the remodeling of the fibrous scar tissue. Despite the slight compressive effect at the level of the spinal cord, there is no evidence of edema.
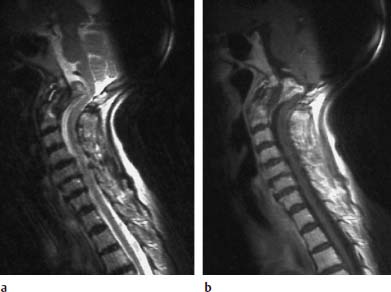
Fig. 6.20a, b Rheumatoid arthritis. 81-year-old female patient with marked pannus formation and progressive high-grade tetraparesis:
a Sagittal T2-weighted image: Presentation of marked pannus tissue formation dorsal to the dens producing a considerable compressive effect along the course of the medulla oblongata. The pannus reveals a moderate and, in parts, slightly increased signal intensity. Hypointense tissue situated dorsal to the eroded dens is distinct from this.
b Sagittal T1-weighted image after contrast application: An inhomogeneous contrast enhancement of the inflammatory granulation tissue has occurred. The sections of the tissue that are hypointense with T2 weighting dorsal to the dens show on the whole no contrast reaction.
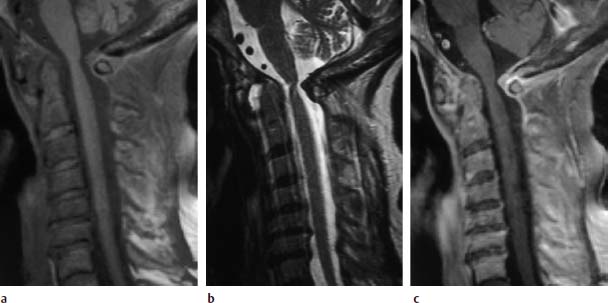
Fig. 6.21a—c Long-standing rheumatoid arthritis. 67-year-old female patient:
a Sagittal T1-weighted image (SE; TR = 572 ms, TE = 12 ms, fat saturation): Widening of the atlantodental interval secondary to a more extensive predental pannus. Slight retrodental pannus reaction is recognizable. Inflammatory reaction at the posterior arch of the atlas with the formation of granulation tissue extending in a dorsal to intraspinal direction. Structural instability in the segments C4–C7.
b Sagittal T2-weighted image (TSE; TR = 4600 ms, TE = 112 ms): The pannus tissue displays high signal intensity. The tissue located along the posterior arch of the atlas appears hypointense. Pathological signal enhancements are not detectable within the disks of the segments C4–C7.
c Sagittal T1-weighted image after contrast application: Clear contrast enhancement of the granulation tissue along the posterior arch of the atlas, patchy inhomogeneous contrast reaction in the region of the predental pannus. In addition, there is a subtle linear contrast enhancement of the disks C5/C6 and C6/C7 with a further contrast reaction in the region of the posterior longitudinal ligament and the annulus fibrosus at the levels of C3/C4, C4/C5 and C6/C7, reflecting the concomitant inflammatory reaction.
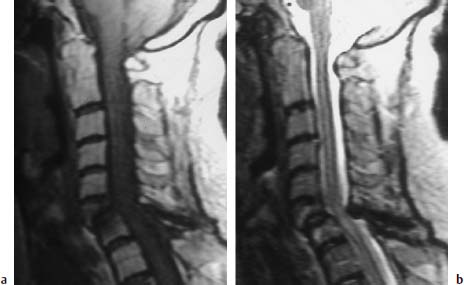
Fig. 6.22a, b Long-standing rheumatoid arthritis. 63-year-old female patient:
a Sagittal T1-weighted image (TSE; TR = 800 ms, TE = 12 ms): Extensive inflammatory reaction in the segment C6/C7 with partial destruction of the sixth cervical vertebra, which displays reduction of the posterior margin in particular. Decreased signal intensity within the cancellous bone of both vertebral bodies due to edema. Obvious angulation in the segmental region C6/C7 with compression of the spinal cord from a ventral and dorsal direction secondary to ligamentous instability.
b Sagittal T2-weighted image (TSE; TR = 5310 ms, TE = 112 ms): The anterior malalignment of C6 over C7 is also clearly recognizable on this image. Compression of the spinal cord from a dorsal direction secondary to the hypertrophy of the ligamenta flava. Evidence of cord edema in this segment. The slight signal enhancement of the vertebral bodies C6 and C7 can also be seen. No destructive changes are delineated in the atlantodental space.
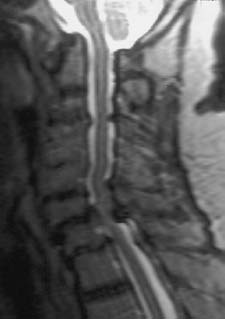
Fig. 6.23 Known long-standing rheumatoid arthritis. 68-year-old female patient. Sagittal T2-weighted image (TSE; TR = 5310 ms, TE = 112 ms): The image demonstrates a basilar impression in the region of the atlantodental joint. In addition there are marked structural instabilities of the spine present at C6 and C7 with partial destruction in the region of the vertebral end plates. This results in narrowing of the spinal canal with compression of the spinal cord and mild cord edema. The vertebrae C4/C5 display partial fusion with extensive collapse of the disk space.
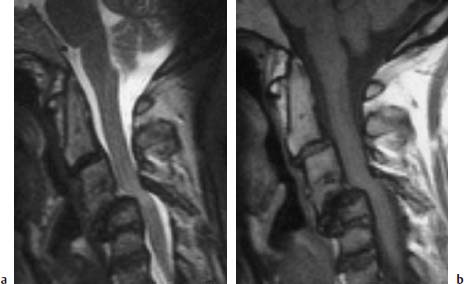
Fig. 6.24a, b Extensive destruction of the cervical spine secondary to long-standing rheumatoid arthritis. 42-year-old female patient:
a Sagittal T2-weighted image (TSE; TR = 5000 ms, TE = 112 ms): Considerable structural instability in the segmental area C4/C5 with frank compression of the spinal cord. Evidence of cord edema. There is partial ossification in segment C3/C4 with disk disintegration and considerable reduction in height of the remaining disk space. Atlantodental joint instability with superior migration of the dens. There is no cord compression here.
b Sagittal T1-weighted image (TSE; TR = 695 ms, TE = 12 ms): The inflammatory tissue in the segmental region C4/C5 extends far ventrally. The vertebral bodies display a normal bone marrow signal; only at C5 is there a slight reduction in signal intensity ventrally. Mild destruction of the end plate at C6 is also recognizable on this image.
It has been shown to be useful to obtain functional images. Placing a cushion beneath the patient’s head will suffice to bring it into a stable position of anteflexion. The majority of patients, even those with severe changes of the atlantoaxial junction, are capable of tolerating this position for a limited period of time. T2-weighted sagittal images should be obtained that provide information about possible compression of the spinal cord. It is important here to look out for a possible myelon edema, which can be an indication of damage to the spinal cord. If the patient is capable of sustaining it, the examination in anteflexion can be supplemented by the administration of contrast in order to detect any possible barrier disturbance along the course of the spinal cord. Coronal sections should also be obtained to gain information about a possible compression of the vertebral artery along the course of the C1 loop. These images are important for the surgeon’s preoperative planning with regard to the positional relationship of the bone to the vertebral arteries (Aisen et al., 1987; Beltran et al., 1987; Neuhold et al., 1989; Kroedel et al., 1989; Reiser et al., 1990; Naegele et al., 1992; Roca et al., 1993) (Figs. 6.25–6.30).
Therapy
Therapy comprises the administration of non-steroidal antirheumatics, so-called basic therapeutics (chloroquine, gold compounds, D-penicillamine), immunosuppressives and steroids. Chemical synoviorthesis, radiosynoviorthesis and operative or arthroscopic synovectomy can be indicated as local forms of treatment for removing destructive pannus.
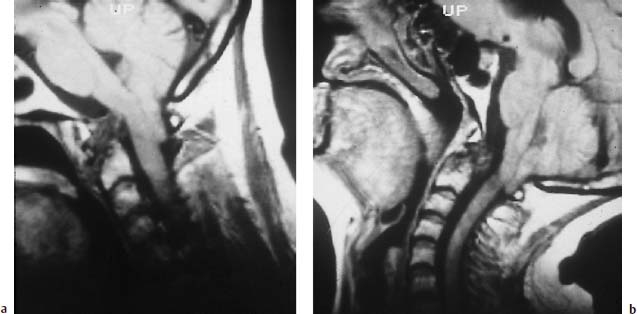
Fig. 6.25a, b Arnold-Chiari type I malformation and long-standing rheumatoid arthritis. Images obtained in anteversion and reclination. The sagittal images display hypointense pannus at the level of the dens with more or less total destruction of its apex. This pannus reaches the medulla oblongata in anteversion. The image obtained in retroflexion reveals a change in the form of the pannus, which now appears spherically delineated and no longer compromises the spinal cord. Frankly low-lying cerebellar tonsils with corresponding additional narrowing of the spinal canal from a dorsal direction.
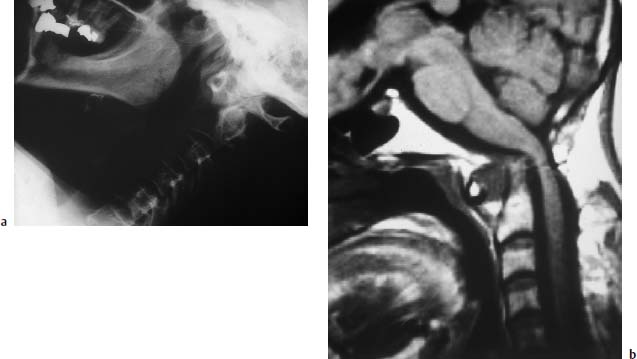
Fig. 6.26a, b Long-standing rheumatoid arthritis. Images of a 64-year-old female patient:
a Conventional functional studies: Demonstration of an obvious widening of the atlantodental interval. The tip of the dens is more or less destroyed and eroded away.
b Sagittal T1-weighted MR image: The widening of the atlantodental interval is also well displayed on this image. The structural atlantodental instability is associated with a mild basilar impression and corresponding superior migration of the dens. Marked compression of the spinal cord.
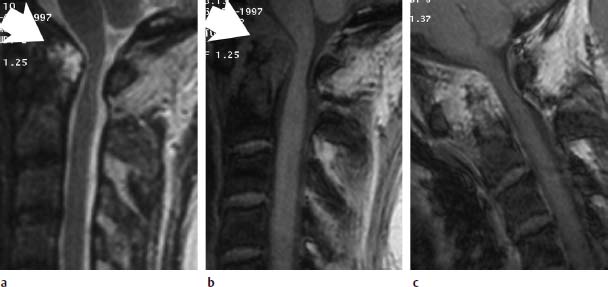
Fig. 6.27a—c Long-standing rheumatoid arthritis. 50-year-old female patient:
a Sagittal T2-weighted image (TSE; TR = 4600 ms, TE = 112 ms): Very signal-intense pannus along the dens, which appears almost completely destroyed (arrow). The spinal canal is narrowed by the pannus tissue. The spinal cord appears compressed.
b Sagittal T1-weighted image (FLASH 2D; TR = 403 ms, TE = 11 ms, flip angle α = 90°): Apart from the pannus tissue located dorsal to the dens, this image also shows marked granulation tissue ventrally (arrow).
c Functional image in anteflexion with additional contrast application (FLASH 2D; TR = 403 ms, TE = 11 ms, flip angle α = 90°): A very strong contrast enhancement of the whole granulation tissue has developed. The dens also displays signal enhancement, reflecting the hypervascularization. The functional image has resulted in no increase of the compressive effect.
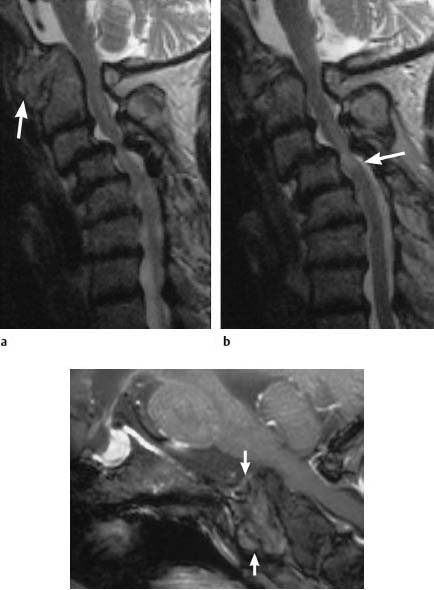
Fig. 6.28a—c Extensive changes secondary to long-standing rheumatoid arthritis. 70-year-old female patient:
a, b Sagittal T2-weighted images (TSE; TR = 4600 ms, TE = 112 ms): Marked basilar impression with considerable widening of the atlantodental interval due to pannus tissue, which demonstrates moderate signal intensity (arrow). Narrowing of the spinal canal and mild compression of the spinal cord in this segment. There are also massive faults in the segments C3–C6 with a considerable forward translation of C3 over C4, resulting in narrowing of the spinal canal and compression of the spinal cord at the level C3/C4 with cord edema (arrow). c Functional image in anteflexion with additional contrast application (FLASH 2D; TR = 403 ms, TE = 11 ms, flip angle α = 90°): The pannus tissue displays only slight contrast enhancement, which has a patchy inhomogeneous appearance. The compressive effect in the region of the spinal cord does not increase with anteflexion of the head.
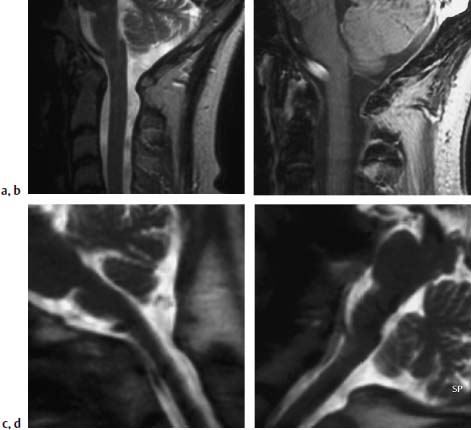
Fig. 6.29a—d Long-standing rheumatoid arthritis. 58-year-old female patient:
a Sagittal T2-weighted image of the craniocervical junction (TSE; TR = 4600 ms, TE = 112 ms): Predental patchy inhomogeneous pannus tissue associated with slight widening of the atlantodental interval.
b T1-weighted image after contrast application (FLASH 2D; TR = 403 ms, TE = 11 ms, flip angle α = 90°): Strong contrast enhancement of the predental pannus.
c T2-weighted functional image (HASTE sequence). The image obtained in anteflexion shows mild contact of the dens with the spinal cord. There is no significant compressive effect.
d Image in retroversion: Contact of the dens with the spinal cord has now been counteracted.
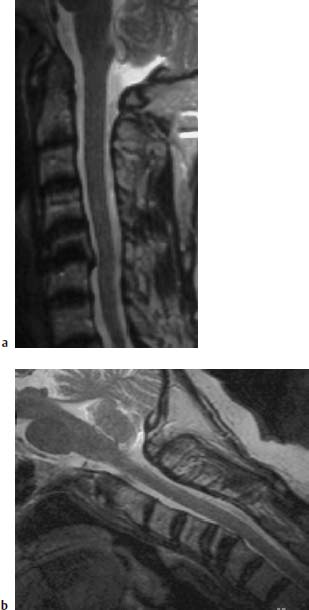
Fig. 6.30a, b Long-standing rheumatoid arthritis. 60-year-old female patient:
a Sagittal T2-weighted image (TSE; TR = 4600 ms, TE = 112 ms): Structural instability at C5/C6 secondary to a chronic inflammatory reaction with involvement of the inferior end plate C5. Retrolisthesis of C5 on C6. The inflammatory reaction reaches the spinal cord. Mild signal enhancement of an elongated predental pannus, no marked destruction to the dens recognizable.
b Sagittal functional image in anteflexion (TSE; TR = 4600 ms, TE = 112 ms): There is no increase in the compressive effect at the level C5/C6. The predental pannus is also recognizable on this image and displays a somewhat mottled inhomogeneous signal with small nodular signal enhancements.
Spondyloarthropathy
Spondyloarthropathy is clinically characterized most notably by inflammatory spinal pain and by an asymmetric peripheral inflammatory arthritis, predominantly involving joints of the lower limbs. The spinal pain results either from a sacroiliitis or inflammatory changes of the vertebral bodies.
Further typical changes include:
• urogenital and intestinal infections,
• psoriatic skin lesions, specific inflammatory bowel disease similar to Crohn’s disease,
• enthesopathy,
• dactylitis (sausage digit),
• acute uveitis,
• positive family history,
• presence of HLA-B27 (human leukocyte antigen B27).
The following disorders are subsumed under the term spondyloarthropathy:
• ankylosing spondylitis,
• reactive arthritis,
• psoriatic arthritis,
• arthritis associated with chronic inflammatory bowel disease,
• undifferentiated spondyloarthropathy.
Related posts:
Stay updated, free articles. Join our Telegram channel

Full access? Get Clinical Tree


