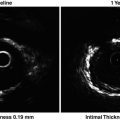
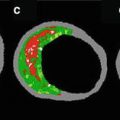
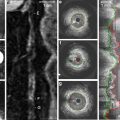
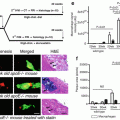
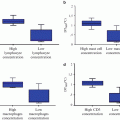
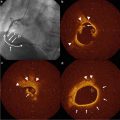
Fig. 15.1
A vulnerable patient, characterized by vulnerable blood, vulnerable myocardium, and vulnerable plaque, may be identified by using risk calculators such as Framingham and Reynolds, which include biomarkers. A combination of biomarkers and imaging may help in further risk stratification and better identification of the vulnerable patient. Combined use of biomarkers and imaging in molecular imaging may help identify not only plaque morphology but also plaque activity, to improve prevention of atherothrombotic events
The concepts of vulnerable patient and vulnerable plaque have helped channel investigative efforts into identifying these phenotypes by using biomarkers, imaging, and a combination of both. In this chapter, we review the potential utility for CVD risk assessment of this integrative approach, focusing on high-sensitivity C-reactive protein (hs-CRP), lipoprotein-associated phospholipase A2 (Lp-PLA2), and myeloperoxidase (MPO) assessed in conjunction with atherosclerotic plaque imaging.
Biomarkers
A biomarker is a substance that can be measured to evaluate normal biological processes, pathogenic processes, or pharmacological response to a therapeutic intervention [5]. Imaging and genetic testing can be considered biomarkers as well, but for this chapter biomarkers will refer only to blood markers. The desirable characteristics of a biomarker differ with the intended use [6]. Biomarkers may have value in improving global CVD risk assessment, monitoring response to therapy, or as targets for therapy [7]. Biomarkers can be classified as screening biomarkers (screening for subclinical disease), diagnostic biomarkers (recognizing overt disease), staging biomarkers (categorizing disease severity), or prognostic biomarkers (predicting future disease course, including recurrence and response to therapy, and monitoring efficacy of therapy) [8]. For screening biomarkers, features such as high sensitivity, specificity, and predictive values, large likelihood ratios, and low costs are important. For biomarkers to monitor the response to therapy, features such as narrow intraindividual variation and association with disease outcome are critical [8, 9]. A multimarker strategy may help us to understand the pathophysiological mechanisms of CVD and to develop new treatments in atherosclerosis. Inflammatory, hemodynamic, and vascular damage biomarkers are currently available and may be considered for the multimarker approach [5, 10, 11].
Given the complex pathophysiology of CVD, it is unlikely that any single biomarker will be able to serve as a universal surrogate for atherosclerosis. Lipoproteins have been used for a long time as biomarkers in CVD risk assessment and prevention. Biomarkers that can be measured in blood have the advantage of availability, lower cost, and repeatability, and hence they have value in risk stratification but may not prove as sensitive as imaging modalities for the detection or assessment of disease [12]. Although atherosclerosis is a generalized disease that involves most of the arterial bed, most deaths are caused by thrombotic occlusion secondary to a single plaque rupture. Thus, nonspecific biomarkers for the generalized process of atherosclerosis are less likely to help identify an individual vulnerable plaque in a disease that is often multifocal or even diffuse; however, such biomarkers may help in the identification of a vulnerable patient [13]. Atherosclerotic lesions or vulnerable plaques associated with thrombosis are frequently found to have a thin and/or fissured cap [14]. The risk is also higher if the plaque has a large lipid core, a history of rupture or remodeling, and is associated with inflammation [15, 16]. Soluble biomarkers may help in detecting systemic inflammation. For example, the inflammatory marker CRP is elevated in patients with unstable angina and more so in patients with acute myocardial infarction (MI) [17]. Moreover, CRP levels are predictive of risk for MI in patients with or without prevalent coronary heart disease (CHD) [17]. The caveat is that CRP is not specific for atherosclerosis and as a consequence can be elevated in other conditions, such as renal disease, infection, cancer, autoimmune diseases, liver and kidney disease, and trauma [13]. Other biomarkers for which assessment is currently available are similarly not specific in detecting atherosclerosis.
Plaque Imaging and Biomarkers
Ideally, we would need better approaches or biomarkers that would identify vulnerable plaques before they become culprit plaques. To evaluate plaque vulnerability, a combined approach capable of evaluating structural characteristics (morphology) as well as functional properties (activity) of plaque may be more informative and may provide higher predictive value than a single approach (Fig. 15.1). Many of these features can be detected by imaging modalities such as angiography, computed tomography (CT), magnetic resonance imaging (MRI), intravascular ultrasonography (IVUS), and molecular imaging [12, 18]. However, newer imaging technology may be limited by technical difficulty, availability, and cost. Therefore, a combined approach using both circulating biomarkers and imaging modalities may be more cost-effective. A number of biomarkers have been examined in conjunction with imaging data for noninvasive identification of high-risk atherosclerotic plaques [19, 20]. It should be noted, however, that circulating biomarkers may be weakly correlated with quantifiable imaging parameters, as shown in the Integrated Biomarker and Imaging Study (IBIS) [21]. Table 15.1 shows the applicability of biomarkers and imaging in CVD risk prediction, therapeutic monitoring, and treatment targets.
Table 15.1
Applicability of biomarkers and imaging in CVD risk prediction, monitoring therapy, and treatment targets
Risk prediction | Monitoring therapy | Treatment targeting | |
|---|---|---|---|
Biomarkers | ++ | ++ | ++ |
Imaging | +++ | +++ | + |
C-Reactive Protein
C-reactive protein (CRP) is a nonspecific inflammatory marker that has now been extensively studied in CVD. It is a member of the pentraxin family of innate immune response proteins [22]. CRP is postulated to have a role in atherosclerosis, as it has been shown to enhance expression of endothelial cell surface adhesion molecules, monocyte chemoattractant protein-1, endothelin-1, and endothelial plasminogen activator inhibitor-1 [23]. Many studies have shown that hs-CRP is associated with incident CVD events in healthy individuals as well as in patients with CVD [17, 24]. Inclusion of hs-CRP measurement has also been shown to improve CVD risk prediction as assessed by the area under the receiving operator characteristic curve (AUC), and hs-CRP is used in conjunction with other risk factors for cardiovascular risk prediction in the Reynolds risk score [25].
A number of studies have shown that statin therapy reduces the risk for CVD events in individuals with high concentrations of hs-CRP [26–28]. In the recent Justification for the Use of Statins in Primary Prevention: an Intervention Trial Evaluating Rosuvastatin (JUPITER), which enrolled subjects without known CVD who had hs-CRP ≥2 mg/L and low-density lipoprotein cholesterol (LDL-C) <130 mg/dL, CVD event rate was reduced with rosuvastatin versus placebo [26]. Based on the results from JUPITER, rosuvastatin is indicated for primary prevention of CVD in men aged 50 years or older and women aged 60 years or older who have hs-CRP ≥2 mg/L in conjunction with at least one additional cardiovascular risk factor, even without overt hyperlipidemia.
The American College of Cardiology (ACC)/American Heart Association (AHA) risk guideline recommendations include consideration of hs-CRP to inform treatment decisions in individuals whose risk is uncertain based on quantitative risk assessment, with hs-CRP ≥ 2 mg/L supporting increasing estimated risk [29]. In contrast, the US Preventive Task Force (USPTF) concluded that the current evidence is insufficient to assess the balance of benefits and risks of using hs-CRP to screen asymptomatic men and women with no history of CHD to prevent CHD events [30]. Several investigators have compared hs-CRP and plaque imaging data in an effort to assess which is better in identifying vulnerable individuals and whether combining biomarkers and imaging improves risk stratification.
CRP and Coronary Artery Calcium in Risk Prediction
Analyses from the Multi-Ethnic Study of Atherosclerosis (MESA) evaluated hs-CRP and CT assessment of coronary artery calcium (CAC) in 950 participants who met the JUPITER entry criteria [31, 32]. In this study, hs-CRP was not associated with CHD (hazard ratio [HR] 0.98, 95 % confidence interval [CI]: 0.62–1.57) or CVD (HR 1.15, 95 % CI: 0.78–1.68) events after adjustments for age, sex, and race. In the same models, CAC was a strong predictor of both CHD (HR 6.65, 95 % CI: 2.99–14.78) and CVD (3.06, 95 % CI: 1.82–5.13). This association persisted even in the multivariate adjusted models. When the population was divided according to hs-CRP (high versus low), it was noticed that increased CAC burden produced similar increases in CHD and CVD events in both hs-CRP groups. The highest CVD event rates per 1,000 patient-years was recorded in the subgroup with both high hs-CRP and CAC >100 (Table 15.2). In this study, hs-CRP did not help in risk prediction for CVD events; however, CAC helped in risk stratification in patients eligible for JUPITER in both high (≥2 mg/L) and low (<2 mg/L) hs-CRP groups. These results suggest that CAC could be used to target subgroups of patients who are expected to derive the most (hs-CRP ≥2 mg/L) and the least (hs-CRP <2 mg/L) absolute benefit from statin treatment [32].
Table 15.2
Event rates per 1,000 patient-years by hs-CRP and CAC categories in MESA
CAC category | CVD events/1,000 patient-years | CHD events/1,000 patient-years | ||
|---|---|---|---|---|
hs-CRP < 2 mg/L | hs-CRP ≥ 2 mg/L | hs-CRP < 2 mg/L | hs-CRP ≥ 2 mg/L | |
0 | 4 | 4 | 2 | 1 |
1–100 | 7 | 8 | 3 | 5 |
>100 | 24 | 26 | 21 | 20 |
In the St. Francis Heart Study, Arad et al. compared the prognostic accuracy of CAC with that of hs-CRP in a setting of primary prevention after 4.3 years of follow-up in 4,613 patients [33]. In this study, hs-CRP and CAC were weakly correlated (r = 0.06, p = 0.01). After adjustment for standard risk factors, hs-CRP levels no longer predicted the CAC score. CAC predicted CHD events independently of standard risk factors (chi-square = 6.6, p = 0.01) and the combination of standard risk factors and hs-CRP (chi-square = 6.6, p = 0.01). Whereas other studies and meta-analyses found that the relative risk for a CHD event in the highest hs-CRP tertile versus the lowest hs-CRP tertile was <2 [34], the relative risk for a CHD event in the highest CAC tertile versus the lowest CAC tertile was 13.9 (95 % CI: 7.1–27.3) in this study. Moreover, after adjustment for CAC score, hs-CRP failed to predict events (p = 0.47). Although these findings do not invalidate hs-CRP as a risk marker, they indicate that CRP, like standard risk factors, is not as powerful a predictor of events as the CAC score [33]. Several other studies that compared the predictive ability of hs-CRP to that of CAC also found that CAC was a better predictor of CVD events than CRP [35–38].
In another comparison of hs-CRP and CAC score, risk stratification of patients at intermediate risk may have benefited from inclusion of both parameters [39]. In this study, the CAC score risk groups were defined by tertiles as low (<3.7), medium (3.7–142.1), and high (>142.1). For hs-CRP, risk groups were defined by the 75th percentile as normal (<4.05 mg/L) and abnormal (≥4.05 mg/L). Compared with participants in the low-risk group for both CAC score and hs-CRP (reference group), risk for MI/coronary events increased with increasing hs-CRP level and increasing calcium score (relative risk ranged from 1.8 to 6.1; p = 0.003 for trend across the six risk groups). Although this study suggested that using both tests may improve risk prediction, the values used for the hs-CRP and CAC categories were different from those in previous studies.
The results of these studies suggest that although imaging parameters such as CAC score might be better prediction tools for identifying vulnerable individuals, imaging and hs-CRP appear to be complementary for risk prediction of CVD events in previously asymptomatic adults.
CRP and Carotid Intima-Media Thickness
Other investigators have analyzed the hs-CRP and carotid intima-media thickness (CIMT) in CVD event risk prediction. In the Cardiovascular Health Study, Cao et al. studied the association of hs-CRP and CIMT with incident strokes in 5,417 participants aged 65 years or older without preexisting stroke or chronic atrial fibrillation [40]. In this study, hs-CRP was correlated with CIMT. For each 1-standard deviation (SD) increment in common or internal CIMT, hs-CRP was 0.37 and 0.40 mg/L higher, respectively (p < 0.001). The association of hs-CRP with incident stroke differed depending on CIMT; there was no association between hs-CRP and stroke among those in the lowest CIMT tertile (adjusted HR 1.03, 95 % CI: 0.98–1.08), but a significant association was found among those with CIMT in the second and third tertiles (HR 1.07, 95 % CI: 1.02–1.12 for the second tertile and HR 1.07, 95 % CI: 1.02–1.12 for the third tertile). These results suggest that hs-CRP may help improve risk prediction in individuals who have thickened CIMT [40].
CRP and IVUS
Imaging, in conjunction with biomarkers, may also help in monitoring disease progression. Nissen et al. analyzed the combination of hs-CRP and IVUS to monitor the progression of atherosclerosis in 502 statin-treated patients who had IVUS performed at baseline and at 18-month follow-up [41]. This study revealed that the decrease in hs-CRP levels with statin therapy was independently and significantly correlated with the rate of progression of atherosclerosis. Patients with reductions in both LDL-C and hs-CRP that were greater than the median reductions had significantly slower rates of progression of atherosclerosis assessed by IVUS than patients with reductions in both biomarkers that were less than the median (p = 0.001) [41]. This study illustrates how imaging and biomarkers may be used in combination to monitor progression of atherosclerotic disease.
CRP and Carotid Magnetic Resonance Imaging
MRI can noninvasively characterize human carotid plaque composition, including the lipid-rich core. Plaques with lipid-rich cores are more prone to rupture, leading to clinical events [15]. Using carotid MRI, Wasserman et al. explored the associations of cardiovascular risk factors with lipid-rich plaques in the healthy population of MESA and found no association between the presence of a lipid-rich core and hs-CRP [42]. This finding is noteworthy because hs-CRP has been strongly associated with plaque rupture in other studies [43], which suggests that hs-CRP may be a marker of plaque instability independent of the presence of a lipid core.
Lipoprotein-Associated Phospholipase A2
Lp-PLA2 is another biomarker that is currently approved for use in CVD risk prediction. Lp-PLA2 is an enzyme that generates lysophosphatidylcholine and oxidized free fatty acids. Lysophosphatidylcholine in turn suppresses release of nitric oxide and up-regulates CD40 ligand expression in T lymphocytes [44]. Lp-PLA2 is associated with vascular inflammation and has relatively low biologic fluctuations [45]. Several large studies have demonstrated an association between Lp-PLA2 and incident CVD events [46–48], but other studies have shown only a modest increase in AUC when Lp-PLA2 was evaluated in risk prediction models [49, 50].
Lp-PLA2 and CAC
A few studies have been conducted to investigate the association of Lp-PLA2 and CAC measured with CT. In a nested case–control study among young adults participating in the Coronary Artery Risk Development in Young Adults (CARDIA) study, Iribarren et al. examined the association of Lp-PLA2 mass and activity with calcified coronary plaque and found that in age-adjusted logistic regression, the odds ratios of having calcified coronary plaque were 1.40 (95 % CI: 1.17–1.67) per 1-SD increment in Lp-PLA2 mass and 1.39 (95 % CI: 1.14–1.70) per 1-SD increment in Lp-PLA2 activity [51]. After adjusting for multiple covariates, including LDL-C, high-density lipoprotein cholesterol (HDL-C), triglycerides, and hs-CRP, a statistically significant association was found for Lp-PLA2 mass (odds ratio 1.28, 95 % CI: 1.03–1.60) [51]. Kardys et al. found that in the Rotterdam Coronary Calcification Study, Lp-PLA2 activity measured in samples collected 7 years before CAC assessment was moderately associated with coronary calcification after adjustment for age in men but not in women [52]. After additional adjustment for non-HDL-C and HDL-C, the association previously seen in men disappeared. No association was found between Lp-PLA2 activity measured concurrently with CT scanning and CAC [52]. In another small study that investigated the relation of Lp-PLA2 levels with a CAC score >0 in American and Japanese men, no association was found between Lp-PLA2 tertile and CAC >0 in Americans and a negative association was found in Japanese men with LDL-C >130 mg/dL [53]. The above-mentioned studies suggest that Lp-PLA2 measurement has a modest correlation with CAC. To date, no head-to-head comparison or evaluation of the combination of Lp-PLA2 and CAC for CVD risk prediction has been published.
Lp-PLA2 and CIMT
Bartoli et al. reported that circulating Lp-PLA2 was increased in patients with high-grade carotid stenosis and unstable plaque [54]. The relationship of Lp-PLA2 mass with CIMT measured by carotid ultrasonography was investigated in diabetic and nondiabetic subjects by Constantinides et al., who found that in nondiabetic patients, CIMT was correlated positively with Lp-PLA2 mass in univariate correlation analysis (r = 0.325, p < 0.009) as well as in multiple linear regression analysis (β = 0.192, p = 0.048) but found no association between CIMT and Lp-PLA2 in patients with diabetes [55]. Two other population-based studies have found an association between CIMT and Lp-PLA2 mass or activity [56, 57]. Although studies suggest that Lp-PLA2 is correlated with CIMT and that Lp-PLA2 and CIMT predict future CVD events, no studies comparing the value of Lp-PLA2 and CIMT in CVD risk prediction have been published.
Lp-PLA2 and IVUS
Several studies have shown that Lp-PLA2 is strongly expressed in the necrotic core of atherosclerotic plaque. In a pathologic study of coronary artery segments from 25 sudden coronary death patients, Lp-PLA2 was absent or minimally detected in early plaques, but thin-cap fibroatheromas and ruptured plaques showed intense Lp-PLA2 expression within the necrotic cores and surrounding macrophages including those in the fibrous cap [58]. Consequently, Lp-PLA2 is being investigated as a possible target for therapy. In the Integrated Biomarkers and Imaging Study-2 (IBIS-2), IVUS and hs-CRP were used to monitor the response to therapy with darapladib, an Lp-PLA2 inhibitor [59]. This study compared the effects of 12 months of treatment with darapladib versus placebo on coronary atheroma deformability and plasma hs-CRP level in 330 patients with angiographically documented CHD. Although no difference in palpography, the primary endpoint, was observed between treatment groups, the secondary endpoint of change in necrotic core, a key determinant of plaque vulnerability, as assessed by virtual histology indicated continued expansion of the necrotic core in patients receiving placebo, whereas Lp-PLA2 inhibition with darapladib prevented necrotic core expansion. No significant difference in plasma hs-CRP levels was seen between treatment groups in this study [59]. This study is an example of how biomarkers may be used in combination with plaque imaging for evaluation of new therapies aimed to treat atherosclerosis.
Lp-PLA2 and MRI
Brilakis et al. examined the association of Lp-PLA2 with atherosclerosis characterized by MRI in the Dallas Heart Study. In this study, Lp-PLA2 was not associated with abdominal aortic plaque or aortic wall thickness in men or women [60].
Myeloperoxidase
MPO is another soluble biomarker that is being investigated for possible use in CVD risk prediction. MPO, a protein produced by polymorphonuclear neutrophils and macrophages, is released in inflammatory conditions [61]. MPO is involved in oxidation of lipids contained within LDL and is thought to promote the formation of foam cells in atherosclerotic plaques [62]. Inflammatory cells producing MPO are found more frequently in ruptured plaques of patients with ACS than in patients with stable CHD [63, 64]. Therefore, MPO may be a marker of vulnerable plaque. Although several studies have shown an association of MPO and CVD events in healthy individuals as well as in patients with acute and chronic CVD [65–68], the additional predictive value of MPO levels in the stratification of cardiovascular risk in clinical practice is still not clear. Additional studies are necessary to evaluate the diagnostic and prognostic ability of MPO in the different forms of presentation of CVD.
MPO and CAC
Wong et al. studied the relation of MPO and CAC in CVD event prediction in 1,302 asymptomatic adults [69]. They found that mean MPO levels were greater with increasing CAC categories; however, after adjustment for other risk factors, this relation was attenuated. Although CAC was the main factor associated with increased CVD event rates, MPO level at or above versus below the median level remained an independent predictor of CVD events (HR 1.9, p = 0.04). For prediction of CVD events, compared with a model with age, sex, and other risk factors alone (AUC = 0.755), AUC was significantly improved in models that added CAC categories (AUC = 0.833, p = 0.005) and combined MPO and CAC categories (AUC = 0.838, p = 0.0037) but not in the model that added MPO alone (AUC = 0.762, p = 0.59). No significant improvement in AUC was observed when MPO was added to the model that already included CAC [69]. This study suggests that CAC is superior to MPO in CVD risk prediction and that combining CAC and MPO may not add any benefit in CVD risk prediction.
Stay updated, free articles. Join our Telegram channel

Full access? Get Clinical Tree


