and Lori Ann Lewis1
(1)
Clinical Research Center of North Texas, Denton, TX, USA
Abstract
The physician, not the technologist, is ultimately responsible for the interpretation of bone densitometry data. However, the ability of the technologist to perform his or her duties is enhanced by understanding what the physician will attempt to do with the data that they provide. Additionally, the circumstances in which bone densitometry is performed are quite different from the circumstances in which other diagnostic procedures are usually performed. For example, unlike having a chest X-ray in which the procedure is finished in a few seconds, the patient is often asked to sit or lie down for several minutes during a bone density study. The technologist is not physically separated from the patient by a protective barrier but usually seated only a few feet away. It is inevitable that the patient will ask questions about the test and the nature of the results. The technologist should be able to respond to these questions appropriately while ultimately deferring to the diagnostic judgment of the physician. It is also true that, occasionally, the technologist must make decisions independently regarding the choice of skeletal site to measure, the technical acceptability of the study, and the timing of return visits. An understanding of how the data are to be used is crucial to making these decisions.
The physician, not the technologist, is ultimately responsible for the interpretation of bone densitometry data. However, the ability of the technologist to perform his or her duties is enhanced by understanding what the physician will attempt to do with the data that they provide. Additionally, the circumstances in which bone densitometry is performed are quite different from the circumstances in which other diagnostic procedures are usually performed. For example, unlike having a chest X-ray in which the procedure is finished in a few seconds, the patient is often asked to sit or lie down for several minutes during a bone density study. The technologist is not physically separated from the patient by a protective barrier but usually seated only a few feet away. It is inevitable that the patient will ask questions about the test and the nature of the results. The technologist should be able to respond to these questions appropriately while ultimately deferring to the diagnostic judgment of the physician. It is also true that, occasionally, the technologist must make decisions independently regarding the choice of skeletal site to measure, the technical acceptability of the study, and the timing of return visits. An understanding of how the data are to be used is crucial to making these decisions.
The Results
The type of information obtained from the various bone densitometry devices may appear different on the computer screen or printout, but the nature of the information is the same. With only a few exceptions, the information can be categorized as follows:
The skeletal image
The measured and calculated bone density parameters
Comparisons to the reference database
% comparisons
Standard score comparisons
sBMD
Age-regression graph
Assignment of diagnostic category based on the WHO criteria
The exact location of this information on the computer screen or on the printout may vary from device to device, but the nature of the information does not.
The Skeletal Image
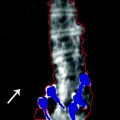
All of today’s X-ray densitometers provide an image of the region of the skeleton being studied. Some, but not all, ultrasound densitometers do so as well. These images1 should always be closely examined for the possible presence of artifacts that would affect the accuracy of the study and the interpretation of the data. If problems are suspected from a review of the image, it is appropriate for the technologist to contact the physician to ask if another site should be studied. At the very least, the technologist should flag the study in some way to alert the physician to possible problems. The skeletal images created during a bone densitometry study are not approved by the FDA to be used to make structural diagnoses.2 Plain films or DXA–VFA studies may be necessary to confirm any suspected structural abnormalities, if the etiology is not already known. Nevertheless, it is important that the images be reviewed for possible structural problems. This situation occurs most often with studies of the PA lumbar spine. As noted in Chap. 3, the presence of osteophytes, facet sclerosis, or compression fractures will increase the measured BMD. While the device is measuring the amount of mineral in the beam path such that the measurement cannot truly be said to be inaccurate, clearly the interpretation of the bone density data in the context of osteoporosis will be affected. The precision of future measurements at that site will also be poorer. As a consequence, if the technologist is aware that the study is being done to establish a baseline value for future measurements, it would be appropriate to contact the physician to explain the potential problem to ask if another skeletal site should be measured. The presence of a suspected fracture has additional significance in assigning the patient’s diagnosis and the interpretation of risk for future fracture. In a postmenopausal Caucasian woman, the presence of a fracture combined with a bone density that is 2.5 SD or more below the average peak bone density of the young adult will result in a diagnosis of severe osteoporosis rather than just osteoporosis.3 In addition, many studies have shown that the risk for future fracture is greater than that implied by the bone density alone once a fracture has occurred [1–4]. For example, the PA lumbar spine image from the DXA study shown in Fig. 10-1 clearly suggests the presence of a compression fracture at L3. A review of the individual BMD values for each vertebra also shows a dramatic increase in the BMD between L2 and L3 which is much greater than expected. The presence of a fracture at L3 should be confirmed with VFA or plain X-rays. Even without these additional studies, suspicion should be aroused by the findings on the densitometry study. The increase in BMD at L3 will increase the L2–L4 BMD upon which comparisons to the reference database will be made. The higher T-score could result in an incorrect diagnosis. It is quite likely that this patient is actually osteoporotic rather than osteopenic as the T-score in Fig. 10-1 suggests. The presence of a fracture also implies that the patient is at much greater risk of future fracture than the bone density alone implies. It would be entirely appropriate for the technologist to note that there appears to be a structural problem at L3 and that the BMD at L3 is unusually high compared to L2 and L4. Without going any further, the technologist has alerted the physician to potential problems in the interpretation of the data.
Fig. 10-1.
A Norland XR-series PA lumbar spine study. Although this image comes from an older Norland device, the importance of reviewing the image and the individual BMDs for each vertebra before reporting the L1–L4 or L2–L4 BMD average is still paramount today. A review of the skeletal image suggests a loss of height and increased density at L3. The values for the individual vertebrae also suggest a much greater increase in density between L2 and L3 than normal. These findings are suggestive of fracture at L3, although plain films or VFA imaging would be required to prove this. The L2–L4 BMD will be increased by the process at L3, regardless of etiology.
Structural diagnoses can be made using the VFA application on Hologic and GE Lunar DXA devices. These applications are available on specific models from the respective manufacturers. If these applications are available and a structural abnormality in the spine is suspected, the physician can be contacted for permission to proceed with VFA spine imaging to confirm the presence and nature of the suspected abnormality. Figure 10-2 is a Hologic VFA image that shows a grade 24 wedge fracture at L1 as well as a heavily calcified aorta.
Fig. 10-2.
Hologic VFA image of the lateral spine. The remarkable clarity of this image allows structural diagnoses to be made. A grade 2 fracture is seen at L1 as well as aortic calcification anterior to spine. The AAC 8 score is 8. Photo courtesy of Hologic, Inc., Bedford, MA.
The Measured and Calculated Bone Density Parameters
The measured and calculated parameters for the regions of interest are displayed on the computer screen at the conclusion of the analysis phase of the bone density study. When multiple regions of interest have been measured during a single study, the technologist must decide which region’s BMD to emphasize. The BMD for the region that is picked will be highlighted and plotted on an age-regression graph. It is this value that will likely receive the attention of the physician. As a consequence, it is imperative that the technologist selects the correct region.
At the PA spine, the measured and calculated values for each vertebra are listed in Fig. 10-3. Also shown are the values for each combination of contiguous vertebrae. On most devices, a “default” region of interest will be programmed into the software. This is the region of interest that will be emphasized unless deliberately changed by the technologist. In the study shown in Fig. 10-3, the L2–L4 BMD is highlighted by default. If unchanged by the technologist, this value will be plotted on the age-regression graph and displayed prominently on the printout. For PA spine studies, it is preferable to use the BMD that is calculated from the measurement of three or four contiguous vertebrae as long as none of those vertebrae are affected by artifacts. The reason for selecting the three- or four-vertebral BMD over the BMD for only one or two vertebrae is that the accuracy and precision of the measurement are superior. The default region of interest in the PA lumbar spine is generally L1–L4 today. If one of the vertebrae in the default region is suspected of being structurally abnormal, it should be excluded from the calculation or the average from another set of contiguous vertebrae chosen. The approach that is preferable will depend upon the specific type of densitometry device.
Fig. 10-3.
A PA lumbar spine GE Lunar Prodigy DXA study. The measured parameters of BMC and area are shown for each individual vertebra and every possible combination of contiguous vertebrae. The BMD is also shown for each individual vertebra and every combination of contiguous vertebrae. The technologist can choose to emphasize any value, although the L1–L4 or L2–L4 BMD is preferred for reasons of statistical accuracy and precision.
In the proximal femur, five different regions of interest can be measured: the total hip (or total femur), the femoral neck, Ward’s area, the trochanter, and the shaft as shown previously in Fig. 3.21a, b. The total hip region of interest combines the femoral neck, Ward’s area, the trochanter, and the shaft into one measurement. Because the combined area of all these regions that contribute to the total hip measurement is greater than the area of any one of these regions alone, the precision of the total hip measurement tends to be the best of any of the five regions. For this reason, many authorities prefer to emphasize the total hip region of interest over the other regions in the proximal femur. This enthusiasm must be tempered by the recognition that any anticipated rate of change in the total hip region of interest will tend to be slower than in the femoral neck or trochanter. The combination of precision and rate of change, not precision alone, determines a site’s utility for serial measurements.5 Excellent precision can be obtained at the femoral neck in which greater rates of change are generally seen than at the total hip. Both regions are similarly useful in the prediction of fracture risk [5]. The WHO 10-year absolute fracture risk prediction algorithm called FRAX® 6 utilizes the measurement of bone density at the femoral neck. As a consequence, the authors prefer to emphasize the femoral neck over the total hip. The technologist should consult with the supervising physician to determine which region of interest is preferred. Ward’s area is virtually never emphasized, as it is not used for diagnosis, fracture risk assessment, or monitoring of bone density. In research studies, Ward’s area is a good predictor of fracture risk and of historical interest7 to those involved in densitometry. Nevertheless, its utility in an individual in clinical practice is quite limited. The area defined by the densitometry computer software as Ward’s area is so small that the accuracy and precision of the measurement are extremely poor compared to the total hip, femoral neck, or trochanter.
At the forearm, most densitometers can be used to measure several different skeletal sites. It is also possible to obtain a measurement at a site on either the radius or ulna alone or on both bones combined. The combined measurement, again because of the larger area being measured, generally offers better accuracy and precision than the single bone measurement, making the combined bone measurement preferable. The preferred site on either bone or both bones combined is highly dependent on the reason for the measurement. The more distal regions in the forearm such as the ultradistal, 8-mm, 10 %, and distal regions of interest are generally preferred for the diagnosis of osteoporosis because of their higher trabecular bone content.8 If a patient is being evaluated for hyperparathyroidism, the proximal, 1/3 or 33 %, sites are preferred because of their higher cortical bone content. In diseases like osteoporosis in which trabecular bone loss is an early feature, the more trabecular distal sites are preferred. Hyperparathyroidism tends to have a pronounced effect on cortical bone, making the highly cortical proximal sites the better sites to measure in the forearm. If the forearm study is performed as a substitute for an unsatisfactory PA lumbar spine or proximal femur study, the more trabecular forearm sites best substitute for the spine, while the more cortical forearm sites best substitute for the femoral neck and total hip. If the patient has had a distal radial fracture or Colles’ fracture, the BMD at the distal site may be increased by as much as 20 %, while the proximal site tends to be unaffected [6]. In this circumstance, if the opposite arm cannot be measured for some reason, the proximal site is the site that more accurately reflects the patient’s bone mineral status. For the prediction of fracture risk, any of the distal or proximal sites can be used. None of the forearm sites are generally used for monitoring therapy. This is not because of either poor accuracy or poor precision at any of the sites. It is because the rate of change at the forearm sites tends to be so slow that the time needed before the least significant change (LSC) will have occurred is much too long to be clinically useful.9
Measurements of bone density at the calcaneus, phalanges, and metacarpals do not present the technologist with a variety of regions of interest from which to choose. These are normally predetermined by the computer software. Total body bone density studies can be subdivided into all the various regions of the skeleton. The accuracy and precision of the total body bone density measurement are excellent. When the skeleton is divided into smaller regions (smaller within the context of the total body measurement) such as the lumbar spine or legs, the accuracy and precision of the measurement suffer. Because of this, it is not recommended that the individual regions of the skeleton from a total body bone density measurement be used for diagnosis or monitoring of therapy. The total body bone density measurement itself is, as noted in Chap. 1, a measure of predominantly cortical bone. As such, it is not particularly useful in the diagnosis of diseases that affect the more trabecular areas of the skeleton or in monitoring changes in trabecular bone from the therapeutic agents used in the treatment of osteoporosis.
Comparisons to the Reference Database
The % comparisons and standard score comparisons were discussed in Chap. 1. The region of interest selected by the technologist to be emphasized on the printout also determines which set of comparisons will be emphasized as well. The % comparisons and standard score comparisons are actually different expressions of the same thing. The % young adult comparison and the T-score both compare the patient’s BMD to the peak BMD value that is expected for a healthy young adult of the same sex. The % age-matched comparison and the Z-score both compare the patient’s BMD to the BMD that is expected for an individual of the same age and sex. One comparison is simply in the form of a percentage, while the other indicates the number of standard deviations above or below the reference value. In clinical practice, the standard score comparisons have been given more importance than the % comparisons in diagnosis and fracture risk prediction, although the patient may better understand a % comparison. The emphasis of the T-score is largely the result of the application of the WHO criteria for diagnosis of osteoporosis, which are based on the number of standard deviations from the average peak bone density of the young adult. These criteria are readily converted to T-scores as shown in Appendix B.
It is just as important to avoid misinterpreting the % comparisons and standard scores as it is to interpret them correctly. The % young adult comparison and T-score should never be interpreted as indicating any magnitude of bone loss. For example, although a patient may be found to have a bone density that is 15 % below the average peak BMD for a young adult, a 15 % bone loss could only be proven if it was known that the patient’s peak BMD was in fact identical to the average peak BMD to which they are being compared. If the patient developed a lower than average peak BMD, they may not have lost any density at all. On the other hand, if they had developed a better than average peak bone density, they might have actually experienced a loss greater than 15 %. It is simply not possible to come to any conclusion in this regard from a single bone mass measurement. The % age-matched comparison and the Z–score can also be misinterpreted. Patients often ask how they compare to others their same age. This question generally follows being told that their % young adult comparison or T-score is relatively poor. It is possible to have a favorable age-matched comparison or Z–score while having a poor % young adult comparison or T-score. This is because, on average, bone loss occurs with advancing age. Simply because lower levels of bone density are expected at older ages should not be misconstrued as indicating the absence of a problem. This loss of bone is not desirable or beneficial. A “good” % age-matched and Z–score comparison can provide a false sense of security in the presence of the more important low young adult comparisons.
T-scores, Z-scores, and % comparisons should never be used in the interpretation of serial bone mass measurements to determine if a change has occurred in the patient’s bone density. It is the actual BMD values that should be compared from study to study. As discussed in Chap. 7, the significance of the change in the BMD is determined by the precision of the measurement and the desired level of statistical confidence.
Related posts:
Stay updated, free articles. Join our Telegram channel

Full access? Get Clinical Tree


