Fig. 14.1
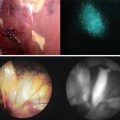
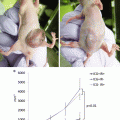
Evaluation of the portal uptake function in veno-occlusive regions by intraoperative ICG-fluorescence imaging. (a) Fluorescence imaging following intravenous injection of ICG reveals the demarcation among possible veno-occlusive regions in S5 (arrow) and S8 (arrowhead) and non-veno-occlusive regions (white arrowhead); left, gross appearance, middle, fluorescence images just before ICG injection, and right, fluorescence images 240 s after the injection. (b) By using a luminance-analyzing software, intersegmental changes in the fluorescence intensity, which reflect the distribution of ICG after intravenous injection, can be evaluated quantitatively (left). FI in the non-veno-occlusive regions, segment V, and segment VIII were continuously recorded (lower right). Corresponding 3D reconstruction of CT images reveals the regions drained by the right hepatic vein (red) and middle hepatic vein tributaries draining segment VIII (yellow) and segment V (green) in the remnant right liver (upper right). (c) An artificial model showing the relationship between the ICG concentrations and the FI values. The FI values increase with elevation of the concentration of phantoms of ICG diluted with ethanol and epoxy resin; the unit of the concentration is expressed as μmol/L
In our previous study [2], the portal uptake function in veno-occlusive regions is usually 30–40 % of that in the non-veno-occlusive regions. These techniques enable visualization of the extent of regions with decreased portal uptake and serve as a guide for the need/lack for venous reconstruction. No matter how accurately volume-analyzing software based on preoperative three-dimensional CT calculate the volume of the regions with interest, its result is virtual and does not enable estimate the degree of portal uptake. Fluorescence images may reflect the actual extent and degree of the portal uptake in the regions with interest as a consequence of a complex system of uptake into the liver, although these techniques make it impossible to observe the deep regions in the liver. In the next part, the authors show clinical application of these techniques.
Clinical Application
Figure 14.2 shows a case of a patient who underwent extended right hepatectomy with excision of the middle hepatic vein for the tumor located in the segment VIII. Our previous criteria for reconstruction of the hepatic vein are described elsewhere [12]. Briefly, the stump of the hepatic vein in the veno-occlusive regions is reconstructed, when the remnant liver volume without venous congestion is less than 40 % of the total liver volume (TLV) for the patient with normal liver function. In this case, volume-analyzing software based on three-dimensional CT estimated the regional liver volume as non-veno-occlusive regions drained by the left hepatic vein (314 mL, 36.9 % of TLV) and veno-occlusive regions drained by the tributary of the middle hepatic vein (77 mL, 9.1 % of TLV) (Fig. 14.2a). In order to determine the need/lack for venous reconstruction, we applied fluorescence imaging technique for evaluation of veno-occlusive regions, after which the regions with decreased portal uptake were identified (Fig. 14.2b). The estimated concentration of ICG introduced in this region was 1.6 μg/mL and corresponded to 30.8 % of that in non-veno-occlusive regions (5.2 μg/mL). The functional remnant liver volume in this case was estimated as 337 mL (40 % of TLV) based on the formula: (functional remnant liver volume) = (liver volume without venous occlusion) + (liver volume with venous occlusion) × (the ratio of the concentration of ICG in the veno-occlusive regions to that in the non-veno-occlusive regions) [2]. Based on the information above, extended right hepatectomy was performed and the stump of the tributary of the middle hepatic vein was not reconstructed. The patient was discharged postoperative day 17 without presenting hepatic dysfunction.
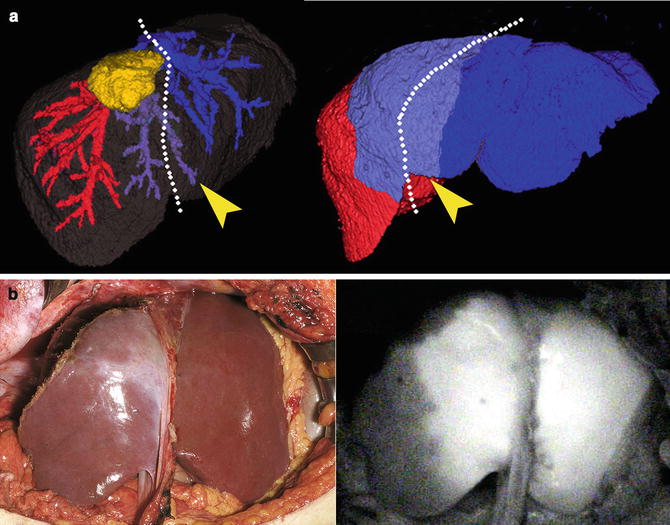

Fig. 14.2


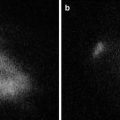
Evaluation of the regional portal uptake in the postoperative remnant liver. (a) A tumor location and planned resection line (white dotted line) was demonstrated on preoperative 3D-CT. Due to the division of MHV tributaries (left, arrowhead), S4 (right, arrowhead) was estimated to be the veno-occlusive regions after liver resection. (b) Fluorescence imaging following intravenous injection of ICG reveals the demarcation between the regions with and without venous occlusion (left, gross appearance, and right, fluorescent images 240 s after the injection). Please see Video 14.1
Stay updated, free articles. Join our Telegram channel

Full access? Get Clinical Tree


