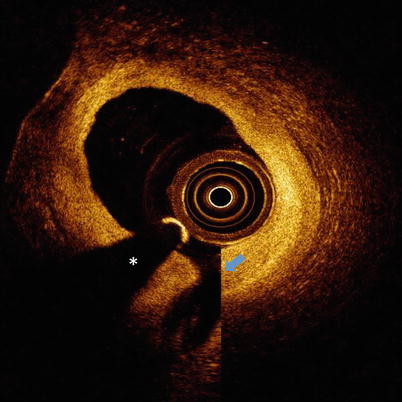
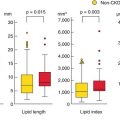
Fig. 5.1
Ghost lines. OCT image with ghost lines between outer catheter (red dotted line) and blue arrow
5.2.3 Residual Blood from Incomplete Lumen Flushing
Blood must be completely flushed from within the lumen during OCT imaging to prevent artifacts resulting from OCT light scattered by red blood cells. When blood is present, lumen artifacts can appear in the OCT image as signal-rich areas instead of a transparent lumen completely free of OCT signal (Fig. 5.2). Scattering of light from within the lumen by blood can cause shadowing that will decrease the intensity of the OCT signal from the arterial wall and can cause difficulty in interpretation of arterial structure. [1–6] Scattering by blood can also introduce significant changes to stent strut appearance including merry-go-round, blooming, and ghost strut artifacts (Fig. 5.2b), which are discussed in Sect. 5.4. If OCT signal is observed in the vessel lumen, modifying the flush parameters and repeating the imaging procedure can correct this artifact. At times there is concern that multiple power injections will increase trauma to the coronary wall and complications to the patient, or that the increased contrast volume will result in renal insufficiency. However, literature demonstrating the safety of power injection of coronary arteries mitigate some of these concerns. For trained cardiologists, hand injection is also a suitable alternative to clear blood during intravascular OCT imaging [7]. When concerns regarding contrast induced renal damage exist Dextran-40 can be used to clear the blood instead of contrast [8, 9].
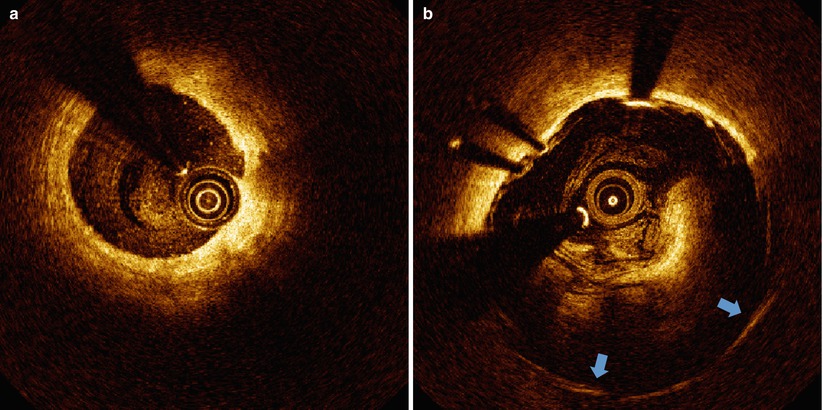
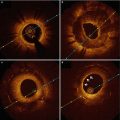
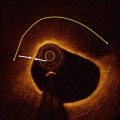
Fig. 5.2
Blood artifact. (a) Coronary artery with “spotty” luminal blood due to poor clearance. (b) Stented superficial femoral artery with “swirled” luminal blood due to very poor clearance. Stent struts with merry-go-rounding (blue arrows) are observed behind the blood
5.2.3.1 Thrombus
Red cell thrombus positioned between the catheter and arterial wall can also cause shadowing. Thrombi can form on the surface of the arterial wall, stent struts or the catheter. Shadow effects are greater for thrombi positioned closer to the catheter. In any of these cases, a shadow will appear beyond the thrombus, diminishing the signal intensity originating from the arterial wall (Fig. 5.3a). Red cell thrombi will typically not only shadow the arterial wall beneath, but also obscure the back side of the clot furthest from the light source and introduce some uncertainty in computing the volume of a red cell thrombus. A white cell thrombus is more translucent (less scattering) to OCT light compared to red thrombi and result in less shadowing (Fig. 5.3b). By examining the signal attenuation strength within the thrombus, distinguishing between red and white cell thrombi is possible. Reconstruction and volume calculations for white thrombi are generally more accurate than for red thrombi.
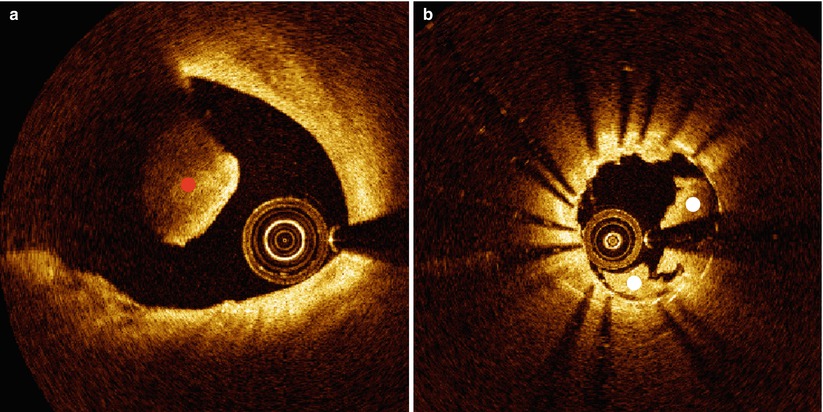
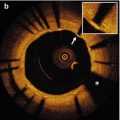
Fig. 5.3
Clots. (a) Red blood clot (denoted by red dot) causing complete attenuation of the OCT beam. (b) White blood clot (denoted by white dots) within a stented vessel causing partial attenuation of the OCT beam
5.2.4 Gas Bubbles
Gas bubbles can form inside fluid-filled catheters. These bubbles are highly scattering due to the large refractive index difference between the gas and surrounding fluid and will also cause the appearance of a shadow that will decrease the signal intensity of the arterial wall (Fig. 5.4) [1–4, 6]. They are recognized by a distinct region of brightness inside the catheter and diminished signal in the part of the OCT image in the path of the disrupted region of the catheter. These gas bubbles can form inside the catheter if the operator does not correctly pre-flush the imaging catheter before placement into the patient for imaging. Gas bubbles can also appear in the lumen of the vessel in cadaver heart studies, causing the appearance of a bright outline of the bubble and a shadow in the OCT image behind the bubble.
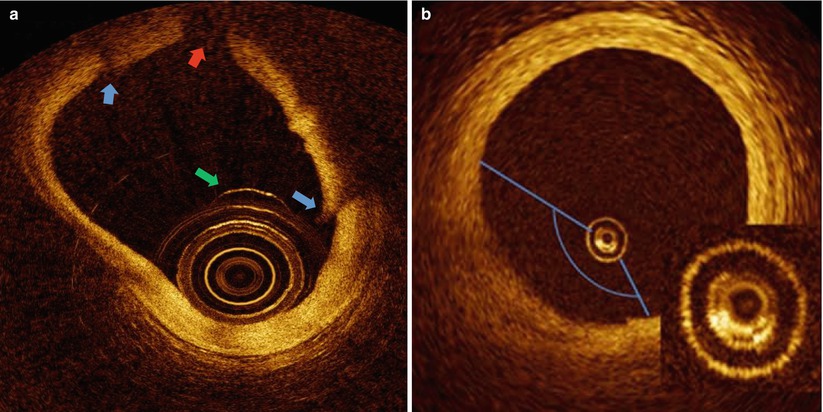
Fig. 5.4
Bubble Artifacts. (a) Ex vivo heart with luminal bubble (green arrow) adhered to catheter. Refraction of light at bubble contour results in bubble shadow (red arrow) and tissue discontinuities (blue arrows). (b) Bubble inside catheter (inset) due to inadequate flushing results in a dimmed sector. (Panel B from Bezerra et al. [2])
5.2.5 Metallic and Biodegradeable Stents
Metal stents block incident OCT light and thus cause shadows behind each strut. A substantial fraction of the arterial cross-section can be disrupted by these shadows, which can then significantly complicate the process of characterizing the underlying tissue structure. Dropout of light occurs behind metallic struts, where struts typically appear as a single leading edge feature that casts a single expanding broad shadow over the arterial wall beginning with the width of the stent strut. This light dropout can often be used as a strategy to recognize the presence of older stents in regions of complex neoimtima and new plaque growth. In contrast to metallic stents, biodegradable stent strut shadows are normally observed along the two lateral sides of the strut, leaving a much greater volume of the native tissue structure (e.g., plaque, intima, media) interpretable for light interrogation.
5.2.6 Superficial Shadowing by Macrophages
Attenuation of light by macrophage accumulations can cause shadows in OCT images that appear falsely as an underlying lipid pool or necrotic core. Thus a relatively normal artery with superficial infiltration of macrophages can even appear as a thin-capped fibroatheroma (Fig. 5.5), causing a non-vulnerable plaque to incorrectly appear vulnerable to rupture. Shadowing is not due to the macrophage itself, but rather is caused by either (1) large pools of lipid-filled macrophages (foam cells) that cause light to attenuate similarly to a lipid pool due to the low index of refraction (IR) of lipid or (2) its association with compact structures with high IR such as micro-calcification and cholesterol crystals [10]. Increased scattering and shadowing by these structures is anticipated by classical scattering theory (e.g., Mie), which describes the way light scatters from objects. In addition to ingesting lipid, macrophages can engulf microcalcifications [11] and cholesterol crystals [12]. Small cholesterol crystals and microcalcifications, both of which have high IRs compared with surrounding tissue structures can cause shadowing. In general, macrophages do not necessarily have optical properties that would cause a shadow, unless they are a large cluster of lipid-rich foam cells or have engulfed a micro-calcification or plaque component that has an IR substantially higher than that of lipid.
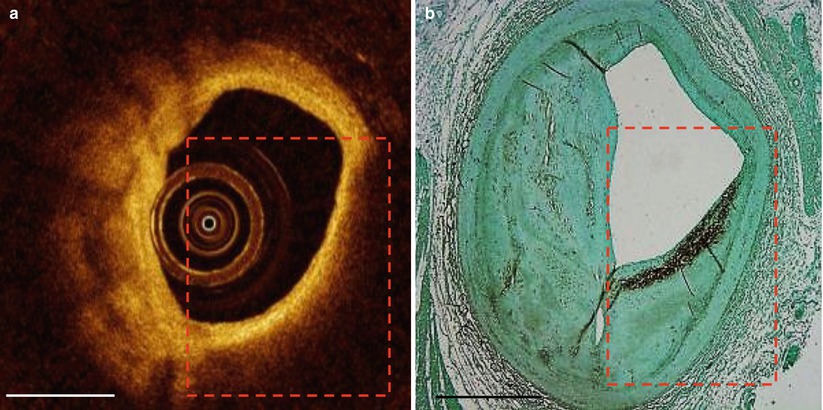
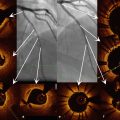
Fig. 5.5
False TCFA. Superficial macrophage infiltration causes appearance of false thin-capped fibroatheroma. The red dashed line outlines the region of light dropout in the OCT image (a) and the region of macrophages in the CD68 histology section (b). Scale bars represent 1 mm
5.2.7 Saturation Artifact
When OCT light is incident on an object that causes a large backscattered signal the OCT detector can saturate. The saturation effect introduces signal energy in much of the OCT signal detection bandwidth so that a bright line appears for that particular A-scan in the OCT image (Fig. 5.6). Polar-to-rectangular conversion causes the saturation artifact to bleed laterally into adjacent A-scans [1–4]. Radial extent of the bright line depends on the artifactual frequencies introduced and can extend beyond the strongly backscattering object deep into the arterial wall and extend to the edge of the OCT image. At larger radial distances from the catheter, polar-to-rectangular conversion results in broadening of the artifact. Objects that can cause a saturation artifact include stent struts, the guide wire, and sometimes components in the arterial wall or tissue surface such as microcalcifications and cholesterol crystals.
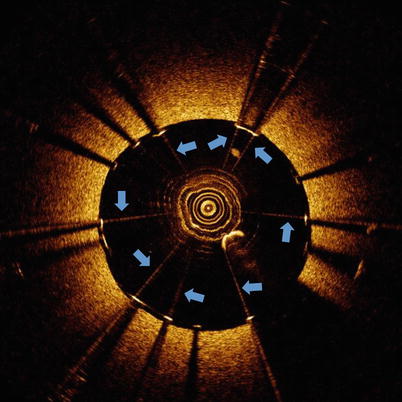
Fig. 5.6
Saturation artifact. OCT image with saturation artifacts (blue arrows) occurring at stent struts
5.3 Catheter Location and Movement
The catheter location within the vessel lumen (center or off-center) and the vessel diameter can affect the OCT image appearance. Additionally, motion of the imaging catheter, due to rotation and pullback speed, can alter the OCT image appearance as well.
5.3.1 Non-Uniform Rotational Distortion (NURD)
NURD is due to a non-constant angular velocity of the mono-fiber optical catheter and appears in OCT images as a blurring or smearing in the lateral (or rotational) direction (Fig. 5.7). [1–3] NURD normally occurs due to mechanical rotational resistance in the catheter due to a either a tortuous or narrow vessel, a tight hemostatic valve, or possibly a crimped catheter sheath. Additionally, NURD can be caused by a defective catheter. The NURD artifact also occurs in other imaging systems that rely on a rotating mechanical element (such as intravascular ultrasound).
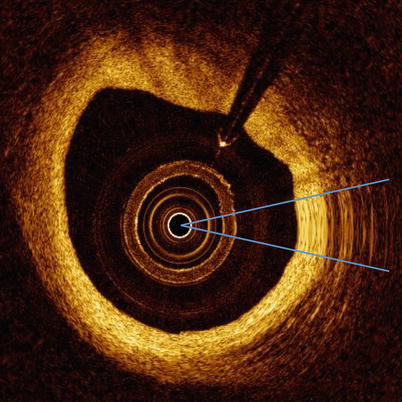
Fig. 5.7
NURD. OCT image with NURD artifact (between two blue lines)
5.3.2 Fold-Over Artifact
Fold-over artifact is observed when the vessel diameter is too large for the field-of-view of the imaging catheter. In such a case, OCT signal aliasing occurs and the image appears to fold back on itself in an inverted reflection of the tissue (Fig. 5.8) [1–3]. The folded-back portion of the image should not be used to assess the tissue geometry of the vessel.
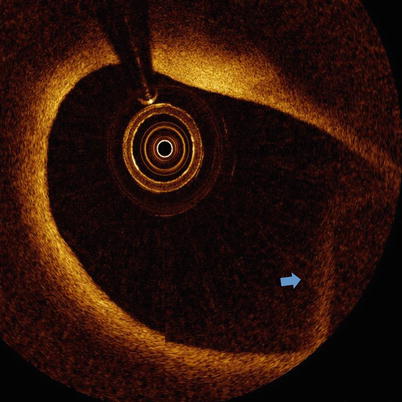
Fig. 5.8
Fold-over artifact. OCT image with fold-over artifact (blue arrow)
5.3.3 Tangential Light Drop-out
When the imaging catheter is positioned close to the arterial wall so that the light is emitted nearly parallel to the tissue surface, that part of the artery wall may appear to attenuate light when in actuality the optical beam is not penetrating in that region (Fig. 5.9). This artifact may be confused with the appearance of a thin-capped fibroatheroma, superficial accumulation of macrophages, a lipid pool, or a necrotic core and thus the knowledge of this artifact should be considered when assessing the tissue composition in regions of artery that are nearly parallel to the OCT light beam [1].
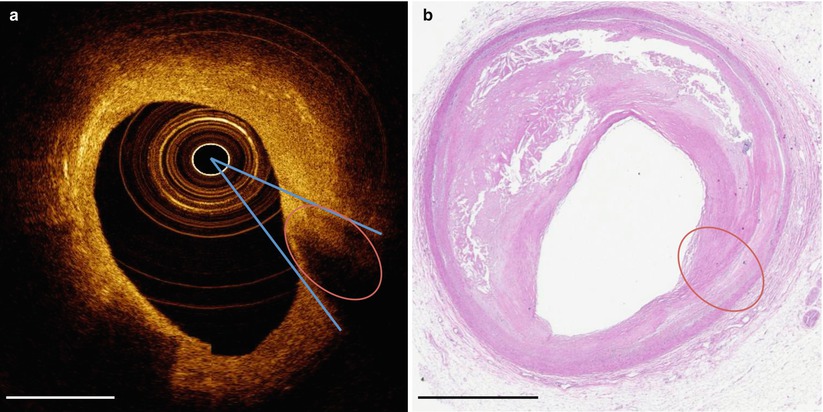
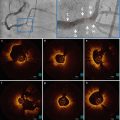
Fig. 5.9
Tangential light drop out. (a) OCT image with tangential light drop out. (b) Corresponding hematoxylin and eosin histology. Oval denotes area where tangential light drop out causes the appearance of a necrotic core that is not revealed by histology. Blue lines indicate the direction of light beams tangential to the tissue that appears to have artifactual light dropout. Scale bars represent 1 mm
5.3.4 Sew-up or Seam Artifact
OCT pullbacks are acquired by the light beam tracing a helix on an idealized cylindrical lumen wall during a pullback. For example, at a 1 mm/s pullback speed, an approximately 270 μm longitudinal separation exists between the starting and final A-scans after a single 360° rotation of the catheter. The combined rotational and longitudinal motion of the catheter results in a discontinuity between successive B-scans, which is called a sew-up or seam artifact. The artifact is represented as a gradient along the lateral direction and normally is most prominent as a discontinuity of the luminal surface but can be observed within the arterial wall as well. Although the sew-up artifact is always present and can be observed in many images presented in this chapter, different conditions can accentuate the appearance. For example, when the relative position between the imaging catheter and vessel wall exhibits a large longitudinal gradient due to vessel tortuosity, luminal diameter changes or calcified and rigid plaque, sew up artifacts will be observed (Fig. 5.10) [1–6].