and Dorin Comaniciu1
(1)
Imaging and Computer Vision, Siemens Corporate Technology, Princeton, NJ, USA
Abstract
The last decade saw tremendous advances in all major medical imaging modalities, with significant improvement in signal-to-noise ratio, sensitivity and specificity, spatial and temporal resolution, and radiation dose reduction. All these developments translated into direct benefits for the quality of care. Most imaging modalities generate now high resolution, isotropic or near-isotropic true 3D volumes, resulting in a large amount of complex data to process. This, however, presents a significant challenge to the already loaded radiologists. As a consequence, intelligent medical image analysis systems are critical to help radiologists to improve accuracy and consistency of diagnosis, increase patient throughput, and optimize daily workflow. The main operations of a computer supported, enhanced reading workflow consist in the detection, segmentation and quantification of various semantic structures in the image data. The quantification of images helps answering questions such as: “Are there inflamed lymph nodes in this volume?”, “Does this scan contain bone lesions?”, and “Has this lesion decreased following treatment?”. This chapter reviews recent advances in medical imaging and presents some of the new challenges and opportunities for image processing and analysis. We then review applications of automatic detection and segmentation in medical imaging, followed by a literature survey on the existing detection and segmentation methods. A brief introduction to the Marginal Space Learning (MSL) based anatomical structure detection and segmentation is presented, followed by the outline of the book content.
The last decade saw tremendous advances in all major medical imaging modalities, with significant improvement in signal-to-noise ratio, sensitivity and specificity, spatial and temporal resolution, and radiation dose reduction. All these developments translated into direct benefits for the quality of care. Most imaging modalities generate now high resolution, isotropic or near-isotropic true 3D volumes, resulting in a large amount of complex data to process. This, however, presents a significant challenge to the already loaded radiologists. As a consequence, intelligent medical image analysis systems are critical to help radiologists to improve accuracy and consistency of diagnosis, increase patient throughput, and optimize daily workflow. The main operations of a computer supported, enhanced reading workflow consist in the detection, segmentation and quantification of various semantic structures in the image data. The quantification of images helps answering questions such as: “Are there inflamed lymph nodes in this volume?”, “Does this scan contain bone lesions?”, and “Has this lesion decreased following treatment?”.
This chapter reviews recent advances in medical imaging and presents some of the new challenges and opportunities for image processing and analysis. We then review applications of automatic detection and segmentation in medical imaging, followed by a literature survey on the existing detection and segmentation methods. A brief introduction to the Marginal Space Learning (MSL) based anatomical structure detection and segmentation is presented, followed by the outline of the book content.
1.1 Advances in Medical Imaging
With the capability of generating images inside a patient’s body non-invasively, medical imaging is ubiquitously present in the current clinical practice. It is estimated that about 400 million medical imaging procedures are performed annually in the USA [54]. Although the conventional diagnostic X-ray is still taking a large share, more advanced imaging modalities have significant presence, e.g., 80 million exams annually for diagnostic Ultrasound [41], 27.5 million for Magnetic Resonance Imaging (MRI) [28], and 72 million for Computed Tomography (CT) exams [20].
Most imaging modalities can today generate isotropic or near-isotropic true 3D volumes. For example, earlier CT scanners could only produce a stack of 2D slices with coarse between-slice resolution (large slice thickness), which prevented the true 3D analysis of image data. Introduced in 1998 by several major vendors, Multi-Slice Computed Tomography (MSCT) (also called multi-detector row computed tomography) changed dramatically the field [18]. Dual source CT has further doubled the temporal resolution with the use of two X-Ray tubes. The number of slices increased from 4 to 8, 16, 32, and 64 in just a few years. Now, 640-slice MSCT is available on market with slices as thin as 0.5 mm. The gantry rotation time also reduced steadily, from around 1 s to 0.25 s, with a temporal resolution of about 66 ms.
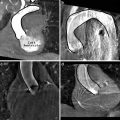
A decade ago, cardiovascular CT was still an extended target since it demanded high spatial resolution, to distinguish small coronary arteries, and high temporal resolution, to compensate the cardiac and respiratory motion [7, 68]. Multi-segment reconstruction of the heart was necessary, in which the volume was stitched by data captured from several heart beats, and the stair-step artifacts were often present due to irregular heart rate of some patients. Now, cardiovascular CT is a routine practice. With the latest scanners, it is possible to scan the whole heart in one beat.
The radiation dose is a big concern for CT. Previously, a cardiac CT scan imposed about 10–15 mSv dose. With the recent advances in dose management and statistical iterative reconstruction algorithms [17] , it is possible to perform a high quality scan for majority of patients with less than 1 mSv dose.
The ultrasonography techniques had also an impressive advance in the last decade. One significant trend is the miniaturization of the ultrasound systems, hand-held devices and wireless probes being available today. An ultrasound probe called Intravascular Ultrasound (IVUS) can be small enough to be attached to the tip of a catheter and inserted into a coronary artery to reveal the existence or nature of the coronary plaque. To visualize in real time the heart valves or the inner lining of the heart, Intracardiac Ultrasound (ICE) has been developed. By the use of a catheter, the ultrasound probe is threaded through the vein in the groin and up into the patient’s heart. A less invasive technique is Transesophageal Echocardiogram (TEE) for which the ultrasound probe is inserted through the patient’s esophagus. The Transthoracic Echocardiogram (TTE) is non-invasive, assuming the transducer to be placed on the chest wall of the patient.
Early 3D ultrasonography steered the probe mechanically or electrically to generate a set of 2D images (or small volume slabs) and stitch them together to reconstruct a 3D volume. The temporal resolution of such a 3D ultrasound system is limited, being subject to stitching artifacts in the case of organs with rapid motion (e.g., a beating heart). Using matrix arrays, the latest 3D ultrasound scanners can directly capture 3D volumes without stitching, achieving scanning speeds of more than 40 volumes/s.
The same trends are also observed in MRI, with significantly improved signal-to-noise ratio, spatial and temporal resolution. With the higher magnet field of the state-of-the-art MRI scanners, detailed anatomical structures are revealed. The 3-Tesla scanners are now industry standard with wide availability and 7-Tesla scanners are under clinical evaluation. Sparse MRI with compressed sensing [50] and parallel MRI imaging with multi-channel coils [65, 70] significantly accelerate the scanning speed. With all these developments, the current MRI scanners can be used to detect coronary stenosis [22], as an alternative to CT.
With all the focus on performance, the imaging systems are getting more and more complex to operate. As a result, new requirements recognize the need for smarter scanners that make it easier for the operator to perform a high quality scan. For example, to reduce the radiation dose, a CT scanner can dynamically tune the X-ray tube current with respect to the targeted body region. The X-ray tube current is maintained high for large body parts (e.g., abdomen, thorax) to achieve sufficient image quality for diagnosis, while being reduced for a thin body part (e.g., neck), thus achieving a comparable image quality. This process requires the scanner to know which part is currently being scanned. Likewise, a stack of MRI slices often have to be aligned with some standard orientations of the target anatomy (e.g., standard views of the heart). In all these applications, the solution has been usually achieved by scanning in advance a low-resolution image/volume of the anatomy of interest and manually identifying the anatomy or orientation of interest. With the recent developments in the automated image processing such as the methods described in this book, the new scanners provide fully automatic positioning and alignment solutions, thus offering a much simplified clinical workflow.
1.2 Applications of Automatic Detection and Segmentation in Medical Imaging
The improvements in the spatial and temporal resolutions of the main imaging modalities resulted in continuously increasing amounts of data to process, thus presenting a challenge to the radiologists. The average workload of a radiologist grew by 34 % from 1991–1992 to 2006–2007 [4], reaching 14,900 studies annually for a full-time job, about 70 cases per day. This represents indeed an important and tedious effort especially when we consider the inherent complexity of the imaging content. For example, it is time consuming for a physician to identify in a volumetric scan small target anatomies such as nodules in the lung or breast. Methods that automatically or semi-automatically detect, segment (delineate), and measure specific structures in the data are therefore critical to optimize the clinical workflow.
As it will be shown, using the Marginal Space Learning (MSL) method, the mean shape aligned with the estimated position, orientation, and anisotropic scales is often very close to the true object boundary. It is also possible to estimate a few nonrigid deformation parameters using the MSL principle to further improve the accuracy of the shape estimate. For such an approach, the border between automated detection and segmentation is blurred, since after object detection we get a quite accurate initial segmentation.
In [8], Carneiro et al. presented an application of automatic detection and measurement in obstetric ultrasonography. During such exam, the sonographer estimates the gestational age of a fetus by measuring the size of a few anatomical structures, including the bi-parietal diameter, head circumference, abdominal circumference, femur length, humerus length, and crown rump length. Accurate estimation of gestational age is important to assess the fetal size, monitor fetal growth, and estimate the expected delivery date. Without automated processing, the clinical workflow requires sonographers to perform those measurements manually, resulting in the following potential issues: (1) The quality of the measurements are user dependent; (2) Exams can take more than 30 min; and (3) Sonographers may suffer from repetitive stress injury (RSI) due to the multiple keystrokes needed to perform the measurements. Therefore, the automation of ultrasound measurements has the potential of improving everyday workflow, increasing patient throughput, improving accuracy of measurements, bringing expert-like consistency to every exam, and reducing the risk of RSI to specialists.
Automatic detection and segmentation is especially useful for interventional cardiology , where the image/volume is captured in real time and needs to be processed as fast as possible. For example, in minimally invasive Transcatheter Aortic Valve Implantation (TAVI) , a C-arm CT volume of the aorta is captured during the intervention [31]. The aorta and aortic valve landmarks need to be detected/segmented and overlaid to a real-time 2D fluoroscopic image sequence to provide visual guidance to physicians during the positioning of the prosthetic valve. It may take more than 10 minutes to manually segment the aorta in 3D and specify the valve landmarks . In addition, it is difficult for the physicians at the side of the surgery table to have access to the computer keyboard and mouse in a sterile environment. Therefore, a dedicated technician needs to be available in the workstation room to perform the manual segmentation. During that period, the whole surgery team (including interventional cardiologists or cardiac surgeons, nurses, and technicians) may be halted, waiting for the segmentation result, while the patient is lying on the table under general anesthesia, with multiple inserted medical devices (e.g., a TEE probe and various catheters ). This is clearly not an ideal scenario. It would be highly beneficial to reduce the image segmentation time, therefore reduce the intervention time and associated risk. An automatic detection/segmentation system designed by us using the methods presented in this book has been developed for this application [85, 86]. It takes only 1–2 s to get an accurate 3D model for the overlay and the system has been successfully tested in real clinical practice at multiple hospitals on thousands of procedures. The physicians can hardly notice the processing delay since the resulting system is so fast, thus contributing to the shortening of the procedure duration.
A few years ago, before the introduction of 3D echocardiography, the sonographers exclusively used 2D echocardiography to evaluate the function of the heart . A few standard 2D cardiac views , e.g., the apical two-chamber view, apical four-chamber view, parasternal long-axis and parasternal short-axis views, were captured and all recommended measurements were performed on these 2D views. More recently, 3D echocardiography started to gradually enter the clinical practice. A large amount of information became available in the 3D volumes and multiple new 3D measurements could be extracted from this data, thus contributing to a richer diagnosis of the patient’s heart condition. However, it has been shown that the sonographer might get quickly lost in the multi-planar reconstruction (MPR) views due to information overload. To increase the acceptability of 3D echocardiography, there was a need to automatically identify in a 3D volume the standard 2D cardiac views that the physicians and sonographers were used to [48]. The automatically detected views helped extracting the traditional 2D measurements and therefore, accelerating the acceptance of 3D echocardiography in clinical practice.
In medical imaging, it often takes tremendous time to train junior physicians such as residents or fellows to have sufficient proficiency to work independently, especially if the task is challenging, e.g., detecting coronary stenosis [37, 64] . Clinical experiments show that an automatic coronary stenosis detection system helps to improve the diagnosis accuracy of junior physicians [1]. Moreover, a computer assisted diagnosis system such as lung nodule detection [51] or colon polyp detection [47, 71], also provides a second opinion that has the potential to improve the diagnosis sensitivity of the expert.
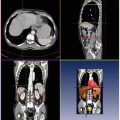
A different need for automation comes from the use of a topogram , which is a 2D X-ray image captured as a scout image to plan the CT exam. A human operator has to manually define the Region of Interest (ROI) of the target organ (e.g., the liver) on this topogram to determine the extent of the desired axial/helical scan (3D). Nevertheless, an automatic algorithm can detect the organs reliably on the topogram, therefore save time and improve consistency/repeatability, especially for follow-up studies of the same patient or for cross-patient comparison [60].
Scout images are also used to plan MRI exams. An MRI scanner has the capability to capture an image with any orientation, however, the between-slice resolution is normally lower than the in-slice resolution. To exam an organ, we often want to align the slice stack properly. For example, in a spinal exam, the task is to align the imaging plane with the target intervertebral disk [13, 35, 36] . Therefore, during exam planning, a low resolution scout volume is captured first. After the detection of the target vertebra disk, the imaging plane orientation and field of view can be automatically determined and the scanning can be triggered using the proper setting. By eliminating user interaction as much as possible, such smart scanner can reduce the cost to train a technician, while increasing the patient throughput. In addition, an automatically determined scanning protocol is especially useful for the follow-up exams to improve the consistency across time.
In summary, the automatic detection and segmentation of anatomical structures in 2D/3D medical images have the following potential benefits in clinical practice:
1.
Reduce the repetitive stress injury.
2.
Reduce the exam time, therefore increase the patient throughput.
3.
Reduce the cost of personnel training, by making the scanner and software more automated and intelligent.
4.
Increase consistency and reproducibility of the exam.
5.
Increase diagnosis accuracy of an expert.
6.
Act as a training tool for junior physicians.
1.3 Previous Work on Automatic Object Detection in Medical Images
The capability to detect an object robustly and efficiently in a cluttered environment is an amazing feature of the human visual system. Automatic object detection received a lot of attention in computer vision, a prominent example being face detection from video [25, 77, 78]. In medical imaging, ad-hoc methods were often proposed to detect a specific anatomy in a specific imaging modality. For example, in [19], the barycenter of the voxels weighted by intensity was used as a rough estimate of the heart center in a cardiac CT volume. Such solution is not robust since it is based on a strong assumption of the imaging protocol: the heart is at the center of the volume and well contrasted.
A limited number of theoretically motivated, generic object detection methods were proposed in the literature. The Hough transform , originally proposed to detect straight lines [26], is a well known technique to detect an object based on its edges. It converts the global pattern detection problem in the image space to a local pattern (ideally a point) detection problem in a transformed parameter space. To detect a straight line, each pixel in an image space is transformed into a sinusoidal curve in the Hough parameter space. After the transformation, collinear points in the image space intersect at a point in the Hough parameter space. Therefore, a peak in the transformed space provides strong evidence that a corresponding straight line exists in the image. It is straightforward to extend the Hough transform to detect other analytic shapes, such as circles and ellipses. Later on, the Hough transform method was extended to detect arbitrary shapes [2]. In the training phase, the complete specification of the exact shape of the target object is pre-computed in the form of the r-table. In the detection phase, the r-table is used to vote for the presence of the target object. The generalized Hough transform has been applied in medical imaging to detect the heart chamber center in [3, 15, 16, 44, 45, 67] . Although it may work well for a rigid object, one drawback of this method is the lack of robustness to detect nonrigid objects.
Unlike the generalized Hough transform that was originated in the computer vision community, the atlas based method [32, 46, 56, 61, 62, 66] was first proposed in the medical imaging community and it is almost a standard method for brain segmentation [52] . Suppose we have a training volume with the target organ delineated (i.e., we know which voxels belong to the target organ). Given an input volume, we do volume registration to align the input volume to the training volume. We can achieve segmentation by transferring the voxel label from the training volume to the corresponding voxel in the input volume. However, due to the large variation of the nonrigid shape and imaging intensity, the result is not robust using only one training volume.
Using multiple training volumes, we can build a statistical atlas . First, we align all training volumes under either affine transformation or nonrigid transformation . We then build two atlases after the alignment, one for a probabilistic atlas where the intensity of each voxel represents its probability belonging to the target organ, and the other for a gray-level atlas where a voxel takes the mean intensity of the corresponding voxels in the aligned training volumes. Given an input volume, we do volume registration to align it with the gray-level atlas. By transforming from the corresponding probabilistic atlas, we know the probability for each voxel of the input volume belonging to the target organ. Initial segmentation can be extracted from this probability map by simple thresholding. However, more accurate segmentation results can be achieved by boundary evolution using active contours , level set , or active shape models .
An atlas based method combines the object detection and rough segmentation into one step, through the volume registration. A major drawback of this method is that volume registration is a hard problem itself, may be even harder than object detection/segmentation it is solving. This is the motivation of some recent work trying to use automatically detected landmarks to initialize the volume registration. Another drawback is that volume registration is computationally expensive, especially for nonrigid volume registration.
Machine learning based methods represent an important class of algorithms for object detection. They are popular and dominate some 2D object detection applications in computer vision, e.g., face detection, after Viola and Jones’ influential work [72]. They leverage the recent advances in discriminative machine learning.
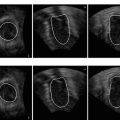
In these methods, object detection or localization is formulated as a classification problem: whether an image block contains the target object or not (see Fig. 1.1a). The object pose parameter space is quantized into a large set of discrete hypotheses . Each hypothesis is tested by the trained classifier to get a detection score. The hypothesis with the highest score is taken as the final detection result (see Fig. 1.1b). This search strategy is quite different from other parameter estimation approaches, such as deformable models , where an initial estimate is adjusted (e.g., using the gradient descent technique) to optimize a predefined objective function. To accurately estimate the object pose, all combinations of translation, rotation, and scaling need to be tested, as shown in Fig. 1.2. However, due to computational power constraints, only three pose parameters (namely 2D translation plus isotropic scaling) are estimated in almost all applications of these techniques. These methods are often called “sliding window” methods since the object position is detected by sliding a window over the whole image and testing each window position.
Fig. 1.1
Machine learning based 2D object detection. (a) A trained classifier with its input and output. (b) Use of the classifier for object detection. ©2008 IEEE. Reprinted, with permission, from Zheng, Y., Barbu, A., Georgescu, B., Scheuering, M., Comaniciu, D.: Four-chamber heart modeling and automatic segmentation for 3D cardiac CT volumes using marginal space learning and steerable features. IEEE Trans. Medical Imaging 27(11), 1668–1681 (2008)
Fig. 1.2
All combinations of the (a) translations, (b) rotations, and (c) scaling need to be tested to detect an object (demonstrated on left ventricle detection in a 2D magnetic resonance image)
Exhaustive search makes the system robust under local optima , however there are two challenges to extend the learning based approaches to 3D. First, the number of hypotheses increases exponentially with respect to the dimensionality of the parameter space. For example, there are nine degrees of freedom for the 3D anisotropic similarity transformation , namely three translation parameters, three rotation angles, and three scales. Note that the ordinary similarity transformation allows only isotropic scaling. In this work, we search for anisotropic scales to cope with the nonrigid deformation of the object. Suppose each dimension is quantized to n discrete values, the total number of hypotheses is n 9 (for very coarse estimation with a small n = 10, n 9 = 1,000,000,000!). The computational demands are too high for the capabilities of the current desktop computers.
The second challenge is that we need efficient features to search the orientation spaces. To estimate the object orientation, one has to rotate either the feature templates or the volume. The widely used Haar wavelet features can be efficiently computed under translation and scaling [58, 72], but no efficient ways are available to rotate the Haar wavelet feature templates. Previously, time-consuming image/volume rotation has been performed to estimate the object orientation [71].
1.4 Previous Work on Medical Image Segmentation
After the region of interest is specified for the target anatomical structure (either manually or automatically detected), we often need to segment it from the background (delineating its boundary). In the following, we review a few popular segmentation methods. A complete review of the previous work on medical image segmentation is out of the scope of this book. Interested readers are referred to the dedicated survey papers [23, 27, 42, 53, 55, 57, 63].
Medical image segmentation methods range from simple thresholding, region growing , watershed , to more complicated approaches, e.g., deformable models , level set , graph cuts , and random walker . Depending on the application, a simple approach may meet the requirement. For example, thresholding followed by connected component analysis may be enough to segment a healthy lung in a CT scan, due to its typical dark appearance. However, in general, more sophisticated methods are often demanded to make a better use of the boundary and region information during segmentation.
Deformable models are a category of popular segmentation methods. For example, as a typical deformable model, the active contour [34] minimizes a predefined energy function to keep the balance between the external force (fitting the contour to the object boundary) and internal force (keeping the contour smooth). The active contour method is likely to get stuck in a local optimum and many variations have been proposed to improve its robustness, e.g., gradient vector flow (GVF) [75] and active balloons [9]. Refer to [53, 74] for more comprehensive reviews of the applications of deformable models to medical image segmentation.
The level set method [59] is closely related to the deformable models, however it has no explicit boundary representation. Instead, the boundary is embedded in an implicit function, which has negative values inside of the object, positive values outside, and a zero value for the object boundary. As an advantage over the active contour, the level set method can handle structural changes (splitting or merging of regions) during the boundary evolution.
Graph cuts are often employed to efficiently solve some global energy minimization problems , therefore have a wide variety of applications in computer vision since many problems can be formulated via energy minimization, e.g., image smoothing, stereo correspondence, and image segmentation. In a typical graph cuts based segmentation [5] we need to specify seed points inside the target object and some seeds outside. The optimal partition of all other pixels is achieved by a minimal-energy cut of the graph that separates the graph into unconnected foreground (target object) and background sets. Different to the deformable models and level set, graph cuts can achieve the global minimum of the energy function. However, the type of energy function that can be solved via graph cuts is limited [39]; therefore the global minimum often does not correspond to the best segmentation of the image from the clinical point of view.
Related posts:
 Comparison of Marginal Space Learning and Full Space Learning in 2D
 Constrained Marginal Space Learning
 Part-Based Object Detection and Segmentation
 Applications of Marginal Space Learning in Medical Imaging
 Nonrigid Object Segmentation: Application to Four-Chamber Heart Segmentation
Stay updated, free articles. Join our Telegram channel

Full access? Get Clinical Tree


