Fig. 1.1
Illustration X-ray production
X-rays are attenuated as they pass through the human body; in general the denser the material, the greater the attenuation. The attenuated beam emerges from the body and passes onto a detector, which allows interpretation of the beam. There are several types of detectors including X-ray film, which is sensitive to radiation and light. Upon detection a chemical reaction occurs. The more radiodense the material, the greater the attenuation of the X-ray beam. Bone attenuates more than soft tissue and appears radiodense (white) on a radiograph. Tissues that do not diminish X-rays are radiolucent or darker on a radiograph. Examples, in decreasing order of radiodensity (white to black), are bone, soft tissue, fat, and air (Fig. 1.2).
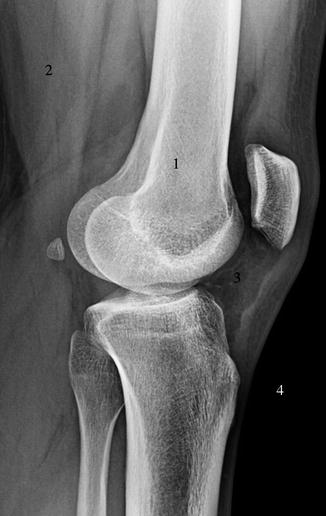

Fig. 1.2
Lateral knee radiograph demonstrating attenuation of X-rays by tissues in decreasing order, 1 bone, 2 soft tissues, 3 fat, 4 air (the greater the attenuation, the whiter the tissue on radiograph)
With the advent of the digital age, digital radiography, DR, was developed whereby X-rays strike a flat panel detector that in turn converts the signals generated into digital information and creates an image on a computer screen. These allow for a “filmless environment” as images are displayed on monitors. Images can be viewed immediately, have a wider dynamic range, and can be manipulated after being captured. Computed radiography, CR, has similar attributes to DR but uses an imaging plate in a cassette, which is then scanned after exposure, converted to an electronic signal, and digitized.
Projections
The two commonest projections are AP and PA. In AP, anterior to posterior, X-rays pass first through the anterior soft tissues, exiting posteriorly to reach the detector; most bone radiographs are acquired as AP projections (Fig. 1.3). The opposite is true for PA projection. Lateral and oblique projections are named with respect to the side closest to the detector. Erect, supine, and standing views indicate the position of the patient (Fig. 1.4).
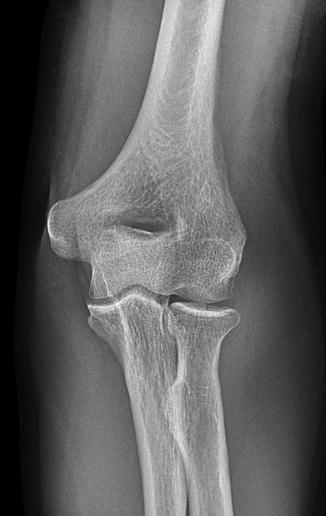
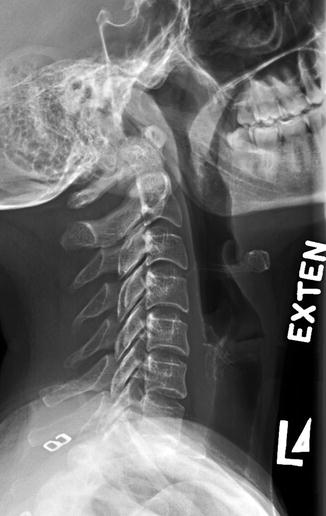

Fig. 1.3
Left elbow radiograph, AP projection

Fig. 1.4
Left (L) lateral radiograph, cervical spine in extension (exten)
Image Analysis and Interpretation
Radiographic images should be assessed from multiple perspectives. There are multiple points of reference on the radiograph that should be reviewed before the image is assessed. First, confirm the correct patient was imaged. Rarely the wrong image is assigned to a patient folder; this may be difficult to detect unless the image is not compatible with the clinical picture, e.g., wrong sex, bone, age, etc. Check the image date and time. Depending on the selected format in PACS, the most recent image may be on the left or right of the screen. Confirm that the correct side/part of the body was imaged and was completely imaged, e.g., inadequate inspiration on chest X-ray (CXR). Check for any additional information on the radiograph, e.g., supine, standing, etc.
Image quality may be affected by multiple technical factors. Patient motion causes blurring of the image. Larger patients have more tissue for the X-ray beam to transverse, and if correct technical factors are not chosen, the beam becomes more attenuated, e.g., lower thoracic spine not visualized behind the heart on a CXR. Patient rotation may obscure normal anatomy. Structures furthest from the detector will suffer from magnification and are less sharp. This is most obvious in assessing the cardiopericardial silhouette on a chest radiograph. The heart lies anteriorly and thus is close to the detector on a PA projection, and size can be adequately assessed. However on the AP radiograph, the heart is farther from the detector, is magnified, and is less sharp in outline.
JABS (Joint, Alignment, Bone, Soft Tissue)
Radiographic assessment in rheumatology requires a thorough review with an organized approach. There are many different approaches, and most radiologists have their own although similar method of assessment. In the hand, for example, there are multiple joints to review on three projections: AP, lateral, and oblique. The JABS technique was developed for the rheumatology patient: joint, alignment, bone, soft tissue.
Joints
Joints are assessed initially. I advise all radiology and rheumatology trainees to take 10 s initially to review the radiograph as a whole to get a global perspective with respect to the extent and severity of disease. It is sometimes easier to have a radiograph with obvious pathology rather than a normal study as the latter often requires a second assessment to exclude occult pathology. If you can identify pathology, then this is where you will start your assessment. It is important to remember that you do not and should not provide an immediate diagnosis. You need to first describe the pathology. By describing the pathology, you may describe changes that help you make the diagnosis which may be different from your initial impression, e.g., erosion with overhanging edge suggests gout. If no pathology is apparent or after you have described the obvious pathology, then you can perform a systematic review at this point using JABS.
In the rheumatology patient, the dominant pathology is usually centered at the joint; hence, the joint is where we will commence. We will want to compare similar joints at the same time; hence, we review the DIP joints together, the PIP joints, etc. This will allow us to identify subtle changes. Assess the joint space: is it maintained uniformly or is it widened (joint effusion/synovial thickening) or narrowed (cartilage loss)? Assess the subchondral bone: is there any increase sclerosis or cyst formation? Review the cortical margin: are there any focal cortical defects to suggest an erosion? If there is an erosion, assess its size and percentage involvement with respect to the head of the involved bone and use the additional views. Where is the erosion, central (e.g., erosive OA, psoriatic arthritis), marginal/periarticular (e.g., rheumatoid arthritis), or juxta-articular or even remote from the joint (e.g., gout)? Marginal erosions occur in the “bare area,” outer margin joints close to capsular attachment where there is no protective articular cartilage covering and where pannus can directly erode the underlying bone, e.g., rheumatoid arthritis. Does the erosion have a sclerotic margin (may indicate an inactive and healing erosion or be a pressure-type erosion as in gout) or not (active erosion, bone unable to lay down new bone due to active disease)? Is there new bone formation? If so, is it typical of an osteophyte (degenerative disease), an enthesophyte, or a new bone related to seronegative arthropathy? Is there periosteal reaction which would again suggest seronegative disease in the absence of trauma?
Alignment
If there is obvious malalignment, this is where we will start. If none, I will obtain a global overview and then commence my review at the distal radioulnar joint and continue distally to the distal phalanges. If malalignment is identified, confirm if it is joint centered and exclude prior trauma. Describe the direction of the alignment for the distal component: is it ulnar/radial or volar/dorsally deviated? Is there underlying subluxation (joint components maintain at least a partial articulation) or dislocation (no residual articulation)? It is important to review all images as reducible subluxations may only be apparent on oblique or lateral views and are reduced on the PA view; hands are placed flat on the table, but recur in the oblique view, e.g., Jaccound’s arthropathy.
Bone
Check bone density. Is it normal, increased (rare), or decreased (osteopenia)? Is it localized or generalized or unilateral or bilateral (if both hands or alternate site available for comparison)? Is there a visible cause, e.g., trauma related or disuse? If localized, is it periarticular? What joints are involved, MCPJs and PIPJs in rheumatoid arthritis? Seronegative arthropathies are not usually associated with periarticular osteopenia. If a single joint is involved, always consider infection in the differential. If generalized, calculate the metacarpal index. The metacarpal index (MCI), the combined cortical mid-metacarpal thickness divided by the outer mid-metacarpal diameter, can be measured for the index finger or as a combined measurement of the second to fourth digits. Values are age related but combined cortical width should be greater than 50 % of the mid-metacarpal. If not, this indicates osteopenia and is discussed in more detail in Chap. 11.
Soft Tissues
I will then finally review the soft tissues. There may be localized or diffuse swelling or thinning of the soft tissues. Soft tissue calcification or vascular calcification may be evident. Check for loss or deviation of the normal soft tissue fat planes. Is there any change in the contour of the skin? These changes usually point to localized soft tissue pathology, e.g., soft tissue swelling on the medial margin of the ulnar styloid process suggests tendinous ECU and/or tenosynovitis of the ECU, commonly seen in rheumatoid arthritis, but may be induced by inflammatory changes within the radiocarpal joint. Is there swelling overlying a joint, e.g., the MCPJ, suggesting a joint effusion? This will alert me to closely review this joint for pathology. Is there generalized swelling of an entire digit, dactylitis? This may suggest infection or seronegative disease such as psoriatic arthropathy. Soft tissue loss particularly distally would suggest scleroderma. Is there soft tissue calcification, and is it within expected location of a tendon, hydroxyapatite depositional disease, or an evidence of calcinosis cutis, e.g., SLE? Soft tissue calcification is reviewed in greater detail in Chap. 16. Vascularar calcification is uncommon and is usually suggestive of chronic renal disease – check for changes of hyperparathyroidism – or diabetes. Exclude soft tissue air, ulcers, and radiodense foreign bodies, all of which may indicate the presence of infection.
Once we have reviewed the radiograph, we need to review any previous studies to assess for interval change. Subtle changes may not be evident on comparison with the most recent exam and only become obvious when distant studies are reviewed; thus, it is paramount to review back to the original available study.
Fluoroscopy
Fluoroscopy allows the real-time visualization of low-intensity X-rays via image intensifier systems. In fluoroscopy the patient is placed between the X-ray source and detector, which remain directly opposite each other (Fig. 1.5). The fluoroscopic unit allows for separate movement of both the patient and the image intensifier. The image is displayed on a monitor in the fluoroscopic room and digitally recorded. Common MSK indications include joint aspirations and injections (Fig. 1.6). Portable fluoroscopy via C-arm units plays an important role in orthopedic surgery as well as many gastrointestinal and urological procedures.
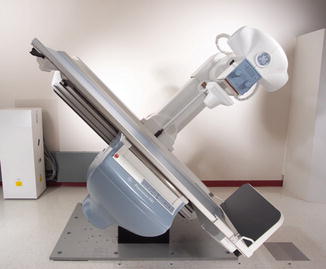
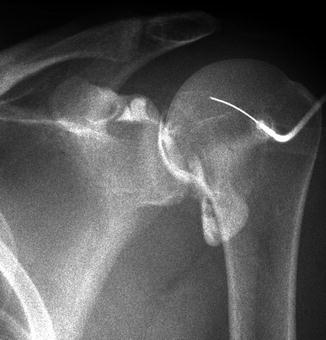

Fig. 1.5
Fluoroscopic unit

Fig. 1.6
Fluoroscopic image acquired at end fluoroscopically guided shoulder arthrogram procedure
Conventional Tomography
This has gained a lower position on the imaging options with the advent of cross-sectional imaging techniques such as CT and MRI. The X-ray source and detector are moved in a set path during an exposure. Anatomy at a set depth remains in focus, while structures at superficial and deeper levels are blurred. It is rarely used in the radiology department but still maintains a role in dentistry.
Tomosynthesis
This is similar to conventional tomography. However in tomosynthesis only one sweep of the X-ray tube is made during which multiple exposures are taken which can be reconstructed to produce multiple images at different levels (Fig. 1.7). The X-ray tube follows a small rotation angle of <40°. The thickness of each slice can be changed depending on the anatomy of the structure being investigated. There has seen a resurgence of interest in tomosynthesis during the last decade with the availability of flat panel radiographic detectors that would allow low-noise rapid image acquisition without geometric distortion. Initial interest was limited to breast and chest imaging, but recently there has been significant research extension into musculoskeletal imaging. Recent research, including that at our institution, has demonstrated increased sensitivity and specificity for erosive disease in the hands and wrists (Fig. 1.8). The radiation exposure is low, comparing 30 × 1 mm slices with two standard radiographs of the hands; the radiation dose is less than three times that of standard radiographs. Tomosynthesis may play a significant role in the future in the detection of erosive disease in rheumatology.
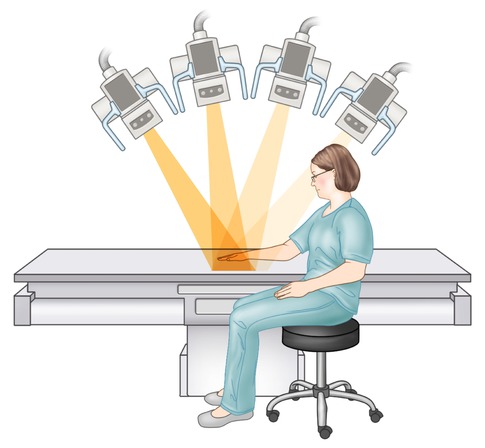
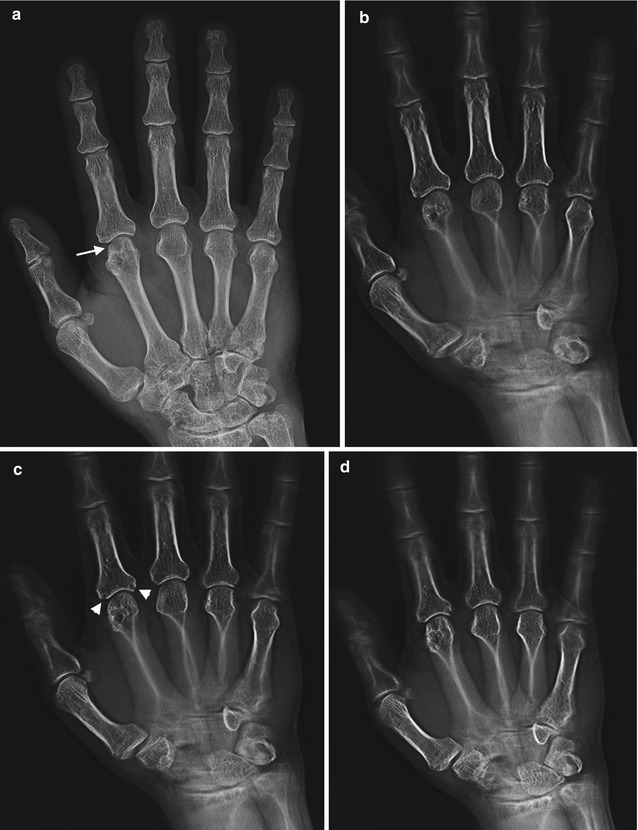
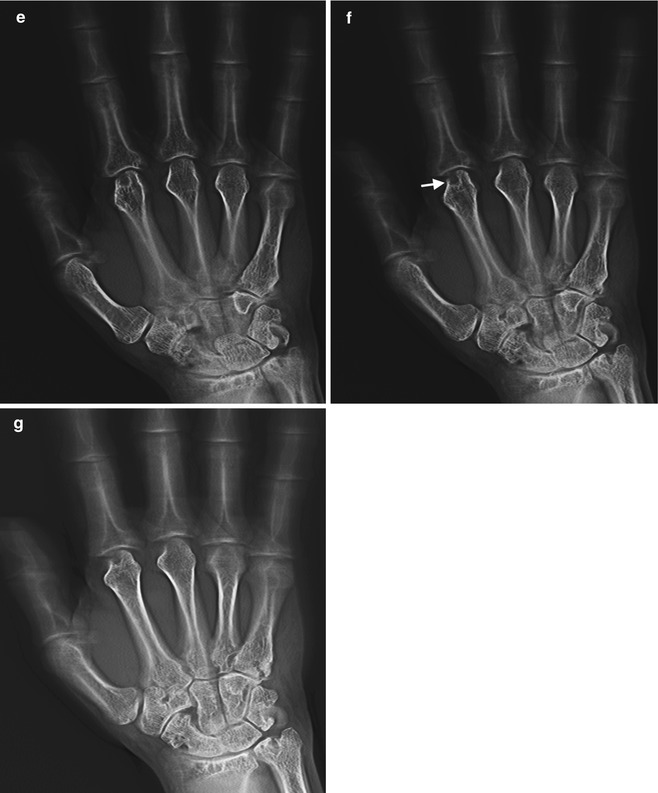

Fig. 1.7
Illustration acquisition tomosynthesis series of hand; note the pathway of the X-ray tube as the images are acquired


Fig. 1.8
(a) AP radiograph, right hand, demonstrates degenerative changes in this patient with CPPD arthropathy and rheumatoid arthritis, no erosions identified; (b–g) tomosynthesis images demonstrate a subchondral cyst on second metacarpal head (arrow), barely perceptible on radiograph, and marginal erosions at the base of proximal phalanx (arrowheads on c) not seen on AP radiograph
Advantages/Disadvantages
Radiography is an inexpensive, noninvasive low-dose radiation study that is easy to acquire and is readily available. It is usually the first line of imaging in many MSK pathologies offering excellent resolution of bone detail. It can identify calcification within soft tissues that may not be evident on MRI. In rheumatological patients, X-rays can quickly assess multiple joints and help localize pathology for further imaging studies if clinically indicated. In addition, clinicians have most of their experience in imaging with X-rays and their interpretation. Discrimination of soft tissue planes is only possible if there is interposed tissue of different attenuation such as fat, air, or bone. Radiographs are however 2-D representations of 3-D anatomy and as such there is superimposition of anatomy. There is limited soft tissue contrast as all soft tissue attenuates the X-ray beam to a similar degree.
Computed Tomography (CT)
Physics
Computed tomography (CT) is derived from the Greek “tomos graphein,” meaning to write a slice, and was one of the major advances in imaging in the twentieth century. CT was developed in the UK in 1972 by Sir Godfrey Hounsfield. The first scanner took several minutes both to acquire and process the image. As with all technological breakthroughs, it was not long before rapid progress was made both in resolution and time required to scan. In 1990, spiral CT was developed, and by 1998, the currently used multislice CT became available (Fig. 1.9). In CT, an X-ray beam rotates in a 360° axis around the patient. The X-ray beam is variably attenuated by the different structures as it passes through the body before it reaches the detectors on the outside of this arc. The detectors then send a digital signal to a computer, which assigns different shades of gray to the different attenuation values and reconstructs an image based on these values. These attenuation values, Hounsfield units, are set so that water has a Hounsfield value of 0 (Table 1.1). In the older single-slice machines, a single rotation, slice, produced one image. In spiral or helical multislice CT, multiple rows of detectors, 4–128, are used as the patient is moved at a set rate through the gantry. This enables a rapid acquisition. Slice thickness can be varied depending on the fine detail required.
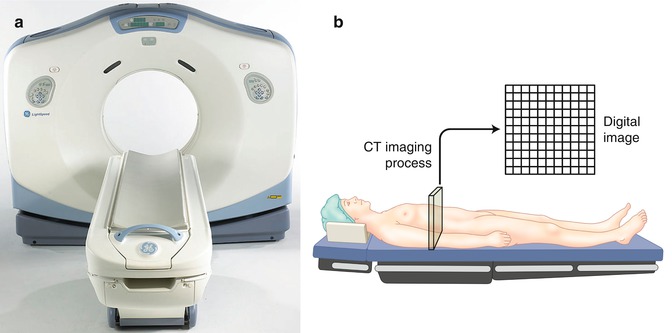

Fig. 1.9
(a) CT scanner. (b) Illustration of CT image composition
Table 1.1
CT attenuation values
Tissue composition | Hounsfield units (HU) |
|---|---|
Bone | 1,000 |
Soft tissue | 20–100 |
Water | 0 |
Fat | −25 to −100 |
Lung | −400 |
Air | −1,000 |
A CT image is composed of multiple 2-D boxes, a pixel, with each pixel representing the mean attenuation value of the structure within the body part that it represents (Fig. 1.10). The matrix determines the number of pixels in an image. In a 512 × 512 matrix, there are 512 pixels in both width and height of the image. Increasing the matrix increases the resolution. When slice thickness is incorporated, the pixel has a 3-D volume and is called a voxel. Images can be reconstructed into axial, sagittal, coronal, and oblique planes with the same resolution as the acquired imaging plane if the study was acquired as an isometric data set, i.e., the voxel has equal measurements in all directions (Fig. 1.11). If not, the reconstructions will suffer from significant artifact. CT images can also be reconstructed into 3-D images (Fig. 1.11). Surface-rendered, volume-rendered, and maximum intensity projection images can be acquired. Images in different planes can be cross-referenced to correctly identify anatomy in different planes. The image can be windowed and the gray scale can be adjusted by changing window width and level to optimize the anatomical region, e.g., lungs, bones, soft tissues, blood, etc. (Fig. 1.12).
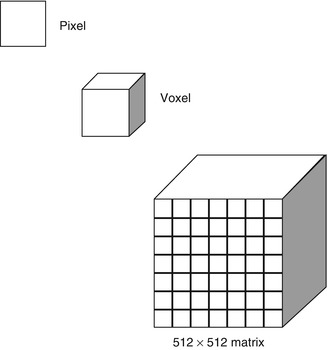
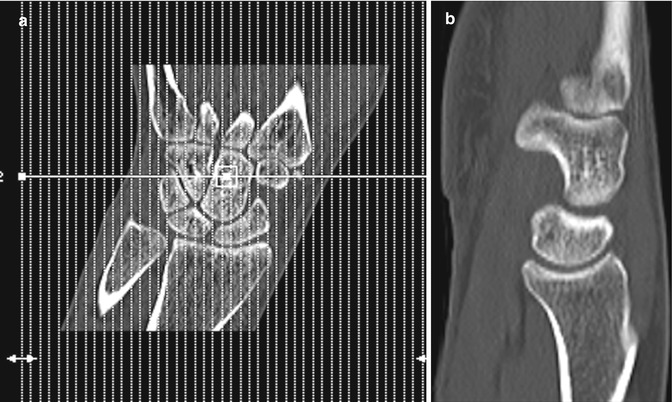
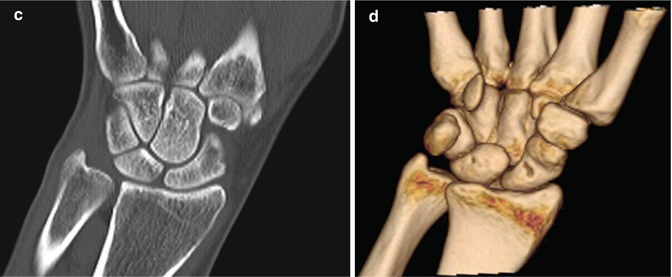
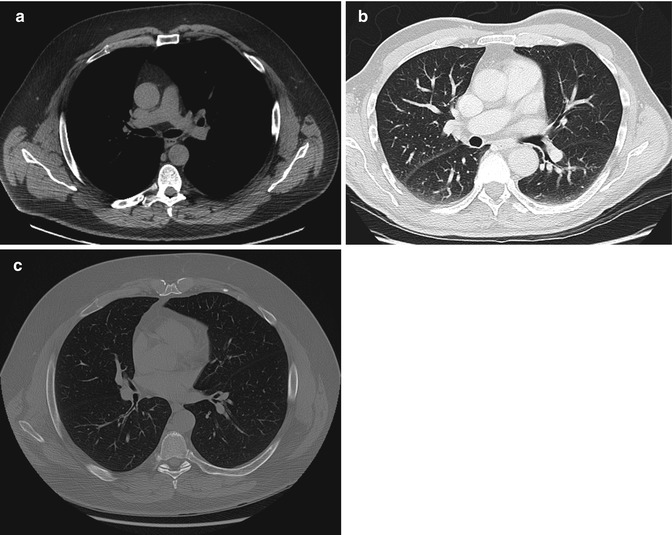

Fig. 1.10
Illustration of image components: pixel, voxel, and matrix


Fig. 1.11
CT wrist (a) low-dose localizer image in coronal plane, similar to radiograph used as template to acquire images in correct planes with respect to anatomy. (b) Sagittal image and (c) coronal image reconstructed from axial images, (d) 3-D image wrist

Fig. 1.12
CT windows; the same image can be manipulated by changing window width and level to optimize structure of concern, (a) soft tissue/mediastinal windows, (b) lung windows, (c) bone windows
Image Analysis and Interpretation
As detailed in the above section in radiography, the correct patient, date, and body part should be confirmed. Check the information provided on the image for matrix, slice thickness, and windowing (Fig. 1.13). The image may also indicate if contrast was used. If not, review the image for vascular structures which will be of higher attenuation than muscle if intravenous contrast has been given; if not, it is of a similar attenuation. Studies may also be acquired in different phases of contrast enhancement, e.g., arterial, venous, and delayed. Oral contrast for gastrointestinal studies may be positive and will appear white, e.g., diluted Gastrografin, or negative, dark, e.g., water. Providing detailed clinical information to the radiologist will allow a correctly protocolled study designed to answer the clinical question. Image quality may be affected by patient motion although modern scanners allow rapid acquisition, in seconds, of large body parts. In situ metal such as orthopedic hardware significantly attenuates the X-ray beam; however, modern scanners have set protocols to diminish this artifact (Fig. 1.14). Beam hardening related to bone also attenuates the beam, e.g., assessment of posterior fossa is diminished due to the thick petrous temporal bone in head CT.
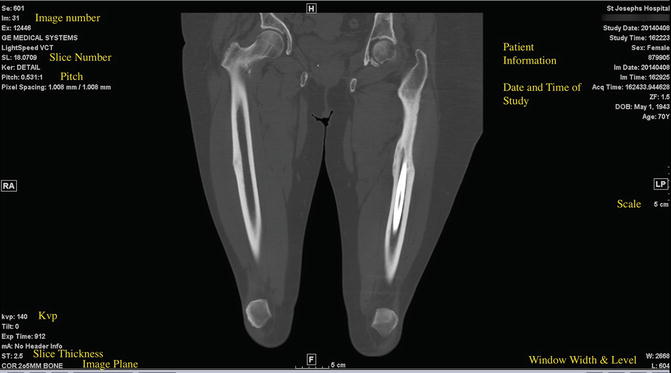
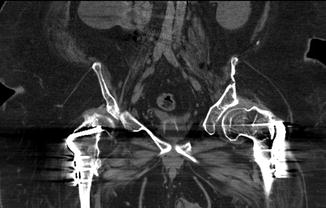

Fig. 1.13
CT image with normal information available detailing date, patient information, window level and width, etc. Patient has atypical stress fractures secondary to bisphosphonate treatment of mid-femurs with internal fixation on the left

Fig. 1.14
CT artifact: beam-hardening artifact related to bilateral plates and screws of the proximal femurs with streak artifact of high attenuation superimposed over adjacent soft tissue with subsequent limitation in the assessment of pathology in this region
Terminology (Table 1.2)
Table 1.2
CT terminology
Hounsfield units | Quantitative scale for attenuation values. Water arbitrarily set at 0 HU, air −1,000 HU, cortical bone +1,000 HU |
Attenuation | Gradual loss of X-rays as they pass through the body. High attenuation regions such as the bone limit transmission of X-rays, termed high attenuating, and appear white. Low-attenuation regions appear dark, gray-black, e.g., fat and air |
CT localizer radiograph | Scanned projection radiograph allows for prescription of scan including start and end points |
Window level
Stay updated, free articles. Join our Telegram channel
Full access? Get Clinical Tree
 Get Clinical Tree app for offline access

|
